Abstract
Centrins are calcium binding proteins that belong to the EF-hand superfamily with diverse biological functions. Herein we present the first systematic study that establishes the relative stability of related centrins via complementary biophysical techniques. Our results define the stepwise molecular behavior of human centrins by two-dimensional infrared (2D IR) correlation spectroscopy, the change in heat capacity and enthalpy of denaturation by differential scanning calorimetry, and the relative stability of the helical regions of centrins by circular dichroism. More importantly, 2D IR correlation spectroscopy provides unique information about the similarities and differences in dynamics between these related proteins. The thermally induced molecular behavior of human centrins can be used to predict biological target interactions that have a relative dependence on calcium affinity. This information is essential for understanding why certain isoforms may be used to rescue a phenotype and therefore also for explaining the different functions these proteins may have in vivo. Furthermore, this comparative approach can be applied to the study of recombinant therapeutic protein candidates for the treatment of disease states.
Centrin is one of 350 eukaryotic signature proteins thought to be critical to the structure and function of the eukaryotic cell.1,2 In higher eukaryotes, e.g., Homo sapiens, there are four centrin isoforms: centrin 1, centrin 2, centrin 3, and the pseudogene centrin 4 (abbreviated as Hscen1–Hscen4, respectively). These centrins are localized to different cellular compartments or associated with specialized tissues with different biological functions, yet in other eukaryotes, only one centrin is required.3 All four isoforms have been associated with the interconnecting cilia within the retina and have been associated with visual signal transduction.4Hscen4 has also been found in neuronal cells within the brain, while Hscen3 has been localized to the distal lumen of the centrioles and basal bodies.4,5Hscen2 has been found to regulate DNA excision repair within the nucleus6,7 and export of mRNA from the nucleus.8 Finally, Hscen1 is localized to the base of the flagella in the sperm and, by contributing the mother centriole of the sperm to the ovum to allow for centriole duplication, is therefore associated with the first division of the zygote.9,10
The canonical role of centrin, and particularly Hscen2, is as a structural and regulatory component of the centriole and basal bodies,11 such that it has commonly been used to identify centrioles and basal bodies in situ.12 The assembly of the microtubule organizing center (MTOC), which includes centrioles and basal bodies, requires many of the same proteins and is highly conserved in eukaryotes.11,12 Failure to duplicate the centriole properly once every cell cycle has been linked to hypertrophy of the centrosomes, aberrant chromosome segregation, and chromosome instability, all important factors in understanding cancer.13−15 Basal bodies are also associated with the assembly of cilia.16 There are two classes of cilia: the motile and the immotile, or primary cilia.16,17 Defects in the basal body are also associated with the aberrant assembly of primary cilia in higher eukaryotes.18,19
Primary cilia, which are immotile and found in almost all organs of the human body, act as a sensory receptor for the cell.18,20 If the primary cilia are found to be defective, their photo-, chemo-, and mechanosensory roles will also be defective. A defective ciliary structure has been recently associated with ciliopathy.
Ciliopathies are a new clinical classification of an expanding group of genetic disorders that cause ciliary dysfunction in many organs.18−23 They include polycystic kidney disease, nephronophthisis, retinal degeneration, such as retinitis pigmentosa, and a series of cilia-associated syndromes such as Bardel-Biedl, Joubert, Alström, and Meckel syndrome, among others.19−26 These syndromes are usually observed within family members with different clinical symptoms or phenotypes. The extent of the clinical variability in the phenotypes even within the same family cannot be explained solely on a genetic basis (single-locus allelism).19,21,24−26 Therefore, an alternate mechanism must also be involved to explain the variability in phenotype. One possible explanation for the observed variability in ciliopathy phenotypes may be the variable expression of conserved proteins27,28 or variability in the function of calcium binding proteins.29
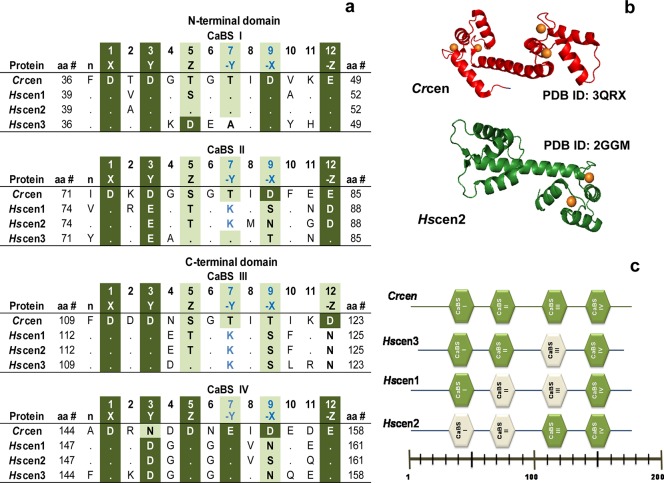
Hscen1–Hscen3 are calcium binding proteins that share common biochemical and structural properties with each other and with Chlamydomonas reinhardtii centrin (Crcen). Their molecular mass is ∼20 kDa; their sequences are >52% identical (Figure S1 of the Supporting Information), and they have an acidic isoelectric point.30,31 Upon closer examination, the sequence of Crcen is >71% identical with those of Hscen1 and Hscen2, while for Hscen3, the level of sequence identity is 52%; the level of sequence identity between Hscen1 and Hscen2 is 84%. Like other EF-hand proteins, centrins respond to cellular Ca2+ influx by selectively binding Ca2+ ions in highly conserved helix–loop–helix motifs.30−35 EF-hand proteins have two globular domains linked by a tethered helix (Figure 1). Each globular domain is composed of two helix–loop–helix motifs, each capable of binding calcium. It is within the loop region that five of six Ca2+-binding residues coordinate directly with a divalent cation. The geometry adopted for calcium binding is that of a pentagonal bipyramid, which can be described in a Cartesian coordinate system as X, Y, Z, −X, −Y, and −Z. The X, Y, Z, and −Z positions coordinate calcium through Asp– or Glu– carboxylates; in the −Y position, the coordination occurs via a backbone carbonyl group, and in the −X position, the residue coordinates indirectly through a water molecule. In canonical EF-hand proteins, like Crcen, there are two high-affinity sites and two low-affinity sites for calcium, as shown in Figure 1. The dissociation constants range from 1 nM to 0.1 mM. However, Hscen1 and Hscen2 calcium binding sites (CaBS) II and III have a sequence that contributes to lower affinity, with Asp88 or Asn125 being responsible for the bidentate coordination of Ca2+ at the −Z (12) position30−33 (Figure 1a).
Figure 1.
EF-hand calcium binding sites (CaBS). (a) Sequence alignment based on the following NCBI accession numbers: XP_001699499 (Crcen), EAX01727 (Hscen1), EAW72900 (Hscen2), and AAI12041 (Hscen3).30−32 Dots in the CaBS sequence alignment represent identical residues when compared to the first sequence (Crcen). (b) Ribbon models of the available full-length Crcen (red ribbon) and Hscen2 (green ribbon) structures were generated from Protein Data Bank entries 3QRX and 2GGM, respectively, using pyMOL from Scrödinger, LLC.35,36 Ca2+ is represented as orange spheres. (c) Schematic diagram of the predicted low-affinity (white) and high-affinity (green) CaBS based on the sequence analysis. In Crcen, the N-terminal domain is composed of high-affinity CaBS as compared to the C-terminal domain, which has the low-affinity sites, yet all sites bind calcium.35,36Hscen3’s CaBS III is predicted to have a low affinity for Ca2+ because of the presence of aspartate residues at positions 2 and 4, which are generally associated with decreased calcium affinity.32 Similarly, for Hscen1 and Hscen2, the presence of the aspartate or asparagine residue at position 12 in CaBS II and III is also predictive of low calcium affinity because of the lack of bidentate coordination with calcium.32,36,37 Finally, residues found in the N-terminal end (as shown in Figure 2) may influence the calcium affinity of the the first CaBS in Hscen2, specifically Asn9 when compared to Ser9 of Hscen1.
While human centrins share similar biochemical and structural properties, a gap exists in our understanding of the relationship between their structure and the diversity of their biological roles. Herein, we present for the first time a comparative molecular biophysical study involving differential scanning calorimetry (DSC),36 circular dichroism (CD),37 and two-dimensional infrared (2D IR) correlation spectroscopy38−42 to assess the relative stability of related centrin proteins that establishes the differences in molecular flexibility and dynamics as a function of temperature. These novel 2D IR correlation spectroscopic results provide unique insight into the molecular behavior these proteins exhibit as a function of temperature, while relating these differences to their lower- and higher-calcium affinity sites. These factors may be crucial in determining their different biological roles and potentially may provide new insight into the modulation of their binding affinities and the role of the EF-hand motif in the regulation of centrin–target interactions.
Experimental Procedures
Bacterial Expression
The Hscen1 and Hscen2 cDNA inserts were generously supplied by E. Schiebel (Peterson Institute for Cancer Research, Manchester, United Kingdom), while the Hscen3 clone was generously supplied by J. Kilmartin (University of Cambridge, Cambridge, United Kingdom). These cDNA inserts were subcloned into a pT7-7 expression vector and transformed into Escherichia coli BL21(λDE3) Star from Stratagene. The new recombinants were then sequenced to verify the identity, proper orientation, and reading frame by J. C. Martinez-Cruzado (University of Puerto Rico, Mayagüez, PR).
The fed-batch method was employed for a 5 L BIOFLO 3000 fermentor (New Brunswick Scientific, Edison, NJ) of E. coli BL21(λDE3) Star cells newly transformed with the desired recombinant. The bacterial cultures were grown in terrific broth medium (Bio 101, Inc., Carlsbad, CA) at 37 °C with 350 rpm agitation, while the dissolved oxygen, pH, and cell density were monitored. Bacterial cultures were induced with 0.5 mM isopropyl β-d-thiogalactoside at the onset of the log phase. Cells were harvested by centrifugation once the stationary phase was reached, usually 3–4 h after induction. Typical yields were 40–80 g of pelleted cells from a 4 L culture.
Isolation and Purification
The purification protocols have all been established in our laboratory.32,40,42 The isolation protocol has been modified to improve the subsequent purification process. Routinely, the harvested cell pellet was lysed using a cold buffer solution containing 50 mM Tris, 0.5 mM EDTA, 0.5 M NaCl, 0.04% NaN3, and 1% IGEPAL (pH 7.4). To minimize proteolytic cleavage of the desired recombinant protein, a cocktail of protease inhibitors was also added (2.0 mg/mL aprotinin, 0.5 mg/mL leupeptin, 1.0 mg/mL pepstatin A, and 2 μL/mL crude lysate of Pefabloc SC). The crude lysate was subjected to preparative centrifugation using a JA-14 rotor and a Beckman J2-MC centrifuge at 9615g for 15 min at 4 °C. This first supernatant sample was then ultracentrifuged using a TI-70 rotor and a Beckman L-80 ultracentrifuge at 70588g for 30 min at 4 °C. This second supernatant was then incubated at 60 °C for 30 min followed by a final preparative centrifugation to remove denatured host protein precipitate using a JA-14 rotor and a Beckman J2-MC centrifuge at 3840g for 30 min at 4 °C to recover the third and final supernatant. This final supernatant sample was then clarified using a hollow fiber cartridge with a 0.1 μm cutoff membrane. The clarified sample was then subjected to buffer exchange using tangential flow filtration with a 5 kDa membrane from Pall Corp. (Ann Arbor, MI). For purification, this sample was then applied to a Phenyl Sepharose CL4B affinity column and, if necessary, an anion exchange chromatography column. In each case, the eluted fractions were analyzed by sodium dodecyl sulfate–polyacrylamide gel electrophoresis (SDS–PAGE) and fractions containing the desired centrin protein were pooled. Typically, 125–600 mg of >98% pure centrin protein was obtained from each batch.
Protein Sample Preparation
For each of the molecular biophysical methods performed below, the buffer conditions and protein concentration were identical to allow for comparative analysis. This was achieved by accurate concentration determination using the predicted molar extinction coefficients: ε280 = 1490 M–1 cm–1 for Crcen, Hscen1, and Hscen2, and ε280 = 8480 M–1 cm–1 for Hscen3. Direct UV absorbance measurements were taken only after exhaustive dialysis of the desired protein against the appropriate buffer conditions using a 5 kDa membrane.
Differential Scanning Calorimetry
Routinely, the desired centrin (1.0 mg/mL) in 50 mM HEPES, 150 mM NaCl, 4 mM CaCl2, and 4 mM MgCl2 (pH 7.4) was analyzed with a VP-DSC microcalorimeter from MicroCal LLC (Northampton, MA). Thermograms were collected at 25 psi and a scan rate of 60 °C/h over a temperature range of 10–127 °C, with an 8 s filtering period. The data analysis was performed using Origin from MicroCal. The sample thermograms were reference subtracted, normalized for concentration to determine the change in heat capacity (ΔCp), and a progressive baseline was obtained to allow for accurate determination of the change in the enthalpy of denaturation (ΔHD) and Tm.36,43
Circular Dichroism
Centrin samples (2.3 μM) in 8 mM HEPES, 2 mM CaCl2, 2 mM MgCl2, and 50 mM NaCl (pH 7.4) were used to acquire far-UV CD spectra on a Jasco (Tokyo, Japan) model J-810 spectropolarimeter equipped with a Peltier temperature controller accessory. The instrument was calibrated using (+)-10-camphorsulfonic acid. Five scans, within the spectral range of 250–190 nm, were collected at a scan rate of 20 nm/min at 5, 25, and 85 °C. In addition, temperature dependence spectra were also collected from 0 to 95 °C, while being monitored at 222 nm at a rate of 1 °C/min. The CD absorbance was converted to mean residue molar ellipticity for each spectral data set to allow for proper comparison between the centrin proteins.37,44 Origin 7 professional software from MicroCal was used to render the desired plots.
Vibrational Spectroscopy
The protein samples were dialyzed under the desired buffer conditions and then lyophilized repeatedly to H → D exchange the sample as previously described.32,40−42 A 35 μL aliquot of 60 mg/mL protein in 50 mM HEPES, 150 mM NaCl, 4 mM MgCl2, and 4 mM CaCl2 (pD 6.6) was deposited on a 49 mm × 4 mm custom-milled CaF2 window with a fixed path length of 40 μm. A reference cell was prepared similarly, and both cells were set in a custom dual-chamber cell holder. The temperature within the cell was controlled via a Neslab RTE-740 refrigerated bath (Thermo Electron Corp.) and monitored with a thermocouple positioned in close contact with the sample cell. The accuracy of the temperature was estimated to be within ±1 °C. Routinely, spectral data acquisition was performed at the desired preset temperature with 10 min intervals, once the temperature in the cell was reached, to allow for thermal equilibrium of the sample. A Jasco model 6200 FT-IR spectrophotometer equipped with a narrowband MCT detector, a sample shuttle, and an interface was used. Typically, 512 scans were co-added, apodized with a triangular function, and Fourier transformed to provide a resolution of 4 cm–1 with the data encoded every 2 cm–1.
FT-IR Spectroscopy
This process provides information regarding the conformational dynamics of proteins. In particular, the amide I′ band typically observed within the range of 1700–1600 cm–1 is characteristic of peptide bonds within a protein, composed mainly of highly coupled carbonyl stretching modes [ν(C=O)] that are sensitive to the conformation of the protein. H → D exchange simplifies the underlying spectral contributions within the amide I′, side chain, and amide II′ bands as follows. As a result, the amide II band observed within the range of 1600–1500 cm–1 is composed of the side chain modes. The amide N–H deformation modes of the peptide bonds within the amide II band (1550 cm–1) shift ∼100 cm–1 to lower wavenumbers, to the amide II′ band (1450 cm–1). The protein sample is considered to be fully exchanged when reversibility is observed upon cooling after heating the amide I′ band returns to the same position and intensity value when compared to the same temperature value upon heating. Therefore, the H → D exchange effectively reduces the number of contributing vibrational modes, without sacrificing structural and dynamic information about the behavior of the protein.32,40−42,45−50
For the FT-IR spectral analysis, the spectral data were not manipulated except for baseline correction. The thermal dependence plots were generated using Origin version 7 from OriginLab Corp. (Northampton, MA).
2D IR Correlation Spectroscopy
Noda developed this technique.38,39 It uses the FT-IR series of sequential spectra as a function of a perturbation (temperature, H → D exchange, ligand titration, etc.) to generate synchronous and asynchronous plots. The spectra are collected at regular intervals of the perturbation. In general, the analysis spreads the acquired spectral data into two dimensions, thus enhancing the spectral resolution in the synchronous plot and providing information about the sequence of molecular events that occur in the asynchronous plot.32,38−42 Both plots provide information about the coupling of vibrational modes within the spectral region of interest (1710–1500 cm–1). Consequently, this technique is sensitive to backbone vibrational modes as well as certain side chain modes (i.e., arginine, aspartates, glutamates, and tyrosine) being perturbed, and as a result, one can identify changes in these modes as a function of the perturbation.
The spectral overlay, peak pick routines, and 2D IR correlation analysis were performed using a Kinetics program for MATLAB (MathWorks, Natick, MA) generously provided by E. Goormaghtigh (Free University of Brussels, Brussels, Belgium).
Results
Partial Amino Acid Sequencing Results for H. sapiens Centrins
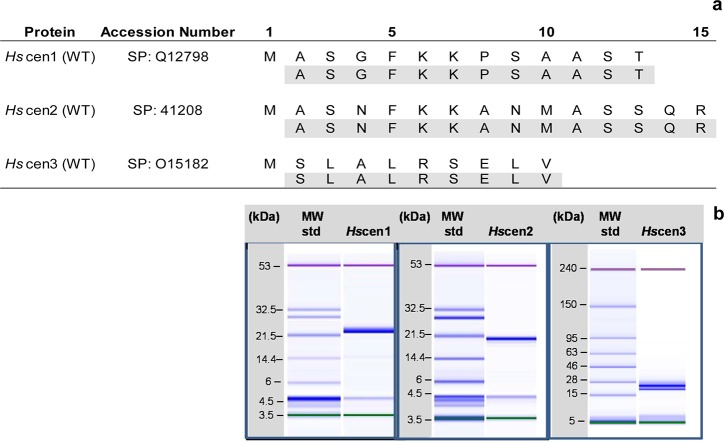
Figure 2 shows these results for all three isoforms. The expected amino acid sequence with the observed loss of the first methionine residue at the amino-terminal end verifies their identities. Also shown are the microchip SDS–PAGE analyses of the purified proteins for all three isoforms. In each case, a single band was observed, indicating >98% purity.
Figure 2.
Biochemical characterization of H. sapiens centrins. (a) Partial amino acid sequencing analysis of the N-terminal end of the recombinant human centrins, validating their identity and the loss of M1. (b) SDS–PAGE microchip analysis of the purified proteins. Each sample contained two internal standards to calibrate the relative mobility in each lane, with an associated band at 4.5 kDa that is also observed in the molecular mass standards. For the assays involving Hscen1 and Hscen2, the lower internal standard was 3.5 kDa and the higher internal standard 53 kDa, while for Hscen3, the assay contained 5 and 240 kDa molecular mass internal standards. In each case, a single band was observed near the expected molecular mass.
Thermal Denaturation of Centrins
The thermal unfolding process for these proteins was determined to be endothermic in each case by DSC, the results of which are summarized in Table 1, Figure 3, and Figure S2 of the Supporting Information. The relative stability of human centrins was compared to that of Crcen in which all CaBS are occupied (Figure 1).32,42 There are two potential causes for the differences in stability. The first is the differences in calcium affinity, and the second is the sequence divergence of these proteins. The comparatively large differences in the Tm and the changes in the enthalpy of denaturation observed in our DSC analysis suggest that calcium affinity is the primary driver of the observed differences in the centrins’ relative stability (results not shown). Crcen was determined to have the highest thermal transition temperature [111.32 °C (Table 1)], whereas Hscen3 was the most stable of the H. sapiens centrins. Hscen3’s Tm was lower by 15.6 °C than that of Crcen, suggesting this is due to the lower calcium affinity as summarized in Figure 1. Similarly, for Hscen1 and Hscen2, whose calcium affinity differs even more from that of Crcen, the transition temperatures were 21.8 and 29.4 °C lower, respectively. The difference in Tm between Hscen1 and Hscen2, which have sequences that are >80% identical, was ∼7.6 °C, suggesting that the differences in the transition temperature may be associated with changes in calcium binding as the EF-hand motif adopts different conformations in the presence (open conformation) and absence (closed conformation) of calcium.30,43 These two isoforms contain two lower-affinity CaBS (CaBS II and III for Hscen1 and CaBS I and II for Hscen2) located in the N- and C-terminal domains for Hscen1, while for Hscen2, the lower-affinity CaBS are located within the N-terminal domain.31 These lower-affinity sites could also account for the pretransitions observed within centrins (Figure S2 of the Supporting Information). As a result, differences in stability could also be translated into differences in backbone flexibility upon the transition between the open and closed conformations.
Table 1. Summary of the DSC Comparative Analysis of H. sapiens and C. reinhardtii Centrins.
| proteina | Tmb (°C) | ΔCpDc(kcal mol–1 °C–1) | ΔHDd(kcal/mol) | temperature range (°C) |
|---|---|---|---|---|
| Hscen1 | 89.52 | 0.4 | 17.9 | 65.06–126.26 |
| Hscen2 | 81.90 | 0.3 | 40.0 | 55.01–115.09 |
| Hscen3 | 95.72 | –0.4 | 47.3 | 75.11–125.02 |
| Crcen | 111.32 | 0.2 | 93.5 | 85.11–126.40 |
Wild-type recombinant proteins.
Transition temperature.
Change in the heat capacity of denaturation.
Change in the enthalpy of denaturation.
Figure 3.
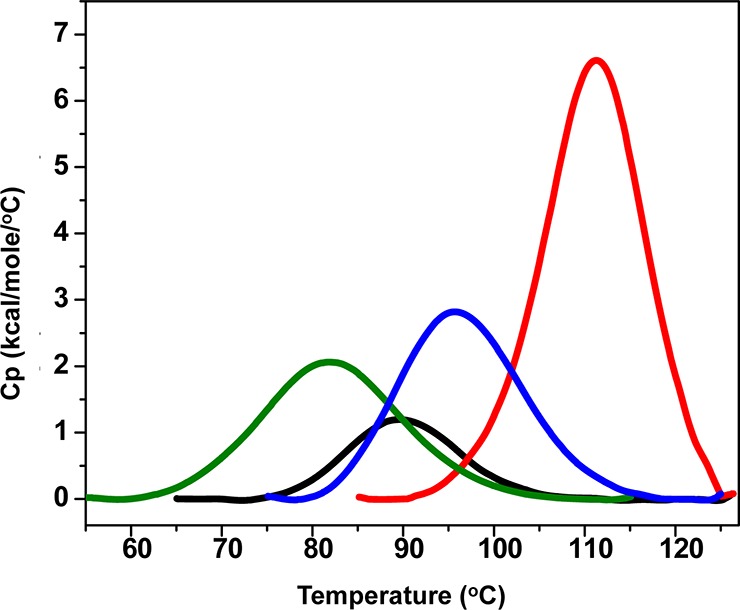
Overlay of DSC thermograms establishing the relative stability of H. sapiens and C. reinhardtii centrins: Hscen1 (black), Hscen2 (green), Hscen3 (blue), and Crcen (red). Their respective Tm vaules are 89.52, 81.90, 95.72, and 111.32 °C, respectively.
We also evaluated the change in the heat capacity of denaturation (ΔCpD) and the change in the enthalpy of denaturation (ΔHD) for these centrins, which provide additional insight into the differences in their stability (Table 1). For Hscen3, the ΔCpD was negative, while for Crcen, Hscen1, and Hscen2, this value was positive, suggesting differences in side chain hydration contributions. Hscen3 contains a primarily nonpolar N-terminal end sequence (Figure 2), as well as a tryptophan residue and an additional tyrosine residue that are not present in the Hscen1 and Hscen2 sequences. More importantly, the lower ΔHD of Hscen1 compared to that of Hscen2 is consistent with loss of calcium coordination at CaBS III because of the differences in calcium binding affinity observed for these two highly conserved proteins, as discussed below in 2D IR Correlation Spectroscopy. The concomitant loss of weak interactions between the helix–loop–helix motifs that are destabilized due to the EF-hand transitions between open and closed conformations arises from the lack of divalent cation coordination with the respective oxygens within the calcium binding loop. Interestingly, the ΔHD determined for Crcen is twice the value for Hscen3 and Hscen2, suggesting the destabilizing effect on the EF-hand motif is similar, although for Hscen3 only one CaBS (III) located on the C-terminal domain has a lower affinity, while for Hscen2, two CaBS in the N-terminal domain have lower affinity. For Hscen1, both N- and C-terminal domains contain one CaBS (II and III) with lower affinity, and thus, the ΔHD is roughly one-half that of Hscen3.
Relative Stability of the Helical Component of Centrins
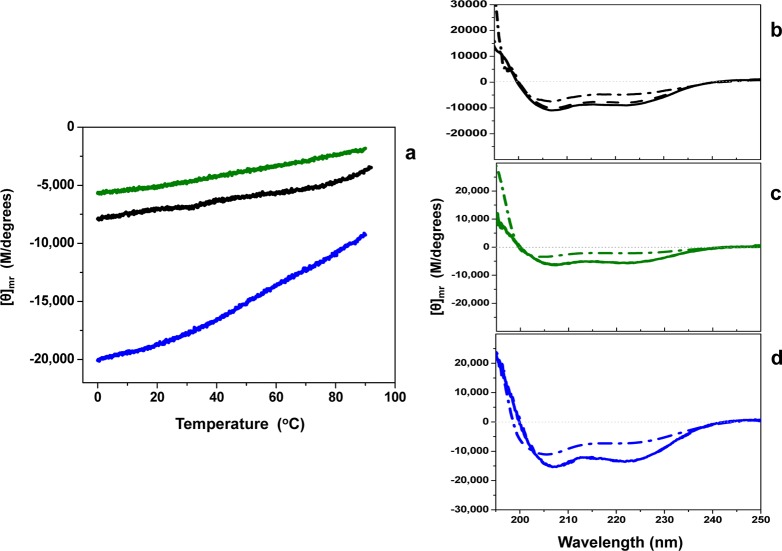
CD experiments were performed to determine the helical content of the human centrins under identical buffer conditions. In addition, CD was used to investigate the extent to which the helical components were being destabilized during thermal denaturation. A relationship consistent with that established by the DSC endotherms was confirmed, as shown in Figure 4a. The mean residue molar ellipticity at 222 nm was monitored as a function of temperature. In addition, the crossover point, random coil, and helical mean residue molar ellipticity for each centrin were determined at 25 °C and are summarized in Table S1 of the Supporting Information. Also shown are the spectral overlays for each human centrin at 5, 25, and 85 °C (Figure 4b–d). All are consistent with exhibition of an isodichroic point, suggesting these proteins undergo a series of conformational changes that do not involve a typical helix-to-random coil transition, but rather a different type of transition, which is discussed below.44 Therefore, a simple two-state model cannot be assumed for these proteins, thus preventing further analysis.
Figure 4.
Relative thermal stability of H. sapiens centrins by CD analysis. (a) Thermal dependence of the helical regions among centrins Hscen1 (black), Hscen2 (green), and Hscen3 (blue). (b–d) Overlay of spectra of far-UV CD at 5 (—), 25 (−–−), and 85 °C (−·−) within the spectral region of 195–250 nm for (b) Hscen1, (c) Hscen2, and (d) Hscen3. The greatest helical content is observed for Hscen3. Also, the relative stabilities established for the thermal dependence of the helical regions for these centrins are in good agreement with the DSC results.
Vibrational Spectroscopy
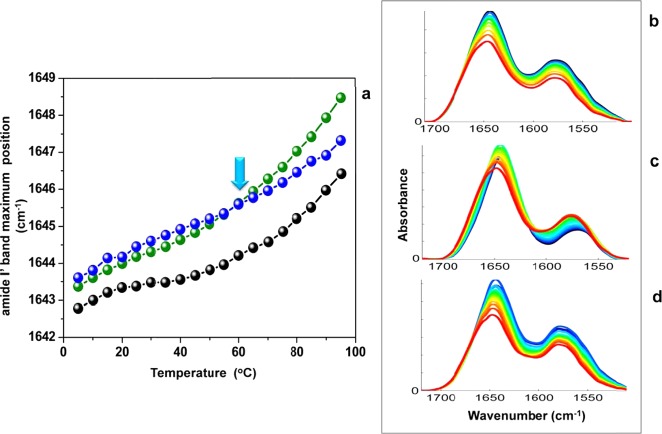
The FT-IR thermal dependence plot and the spectral overlay of the amide I′ and side chain bands within the spectral region of 1710–1500 cm–1 are shown in Figure 5 for fully H → D exchanged Hscen1, Hscen2, and Hscen3. The amide I′ band (1710–1600 cm–1) is composed primarily of peptide bond frequencies [ν(C=O)] that are sensitive to conformational changes within proteins. In general, the amide I′/side chain band ratio varies slightly among human centrins, suggesting differences in the calcium binding state.40 The side chain band (1600–1500 cm–1) is composed of arginine guanidinium [νa(N–D) and νs(N–D)], aspartate, and glutamate [νa–s(COO–)] side chain vibrational modes47,48 located near or within the CaBS of these proteins and thus serving as probes of these sites.32,40,49,50 Furthermore, the carboxylate asymmetric stretching vibrations within the aspartate and glutamate residues are sensitive to the coordination state with calcium, such that when calcium is unbound because of the thermal perturbation, there is a peak shift toward higher wavenumbers (Table 2). This fact allows the identification of the lower- and higher-affinity CaBS.
Figure 5.
FT-IR thermal dependence study for H → D exchanged wild-type centrins within the temperature range of 5–95 °C. (a) Thermal dependence plots for Hscen1 (black), Hscen2 (green), and Hscen3 (blue). The plot shows the amide I′ band maximum as a function of temperature, which is sensitive to all of the backbone ν(C=O) vibrational modes of the protein. The vertical dashed line denotes the first temperature range for all centrins. Also highlighted with the light blue arrow is the temperature (60 °C) at which the Hscen3 curve begins to depart from Hscen2. (b–d) FT-IR spectral overlay of wild-type centrins amide I′ and side chain bands in the spectral region of 1710–1500 cm–1 within the temperature range of 5–95 °C: (b) Hscen1, (c) Hscen2, and (d) Hscen3.
Table 2. Summary of the Peak Assignments for Backbone Vibrational Modes within the Amide I′ Band (1710–1600 cm–1) As Determined by the Synchronous and Asynchronous Plots.
|
Hscen1a peak position (cm–1) |
Hscen2a peak position (cm–1) |
Hscen3a peak position (cm–1) |
||||||
|---|---|---|---|---|---|---|---|---|
| peak assignment | average peak position (cm–1) | 5–35 °C | 40–95 °C | 5–35 °C | 40–95 °C | 5–35 °C | 40–60 °C | 60–90 °C |
| CaBS loopb | 1682.8 | 1686.0 | 1687.5 | 1680.0 | 1683.7 | 1684.3 | 1682.4 | 1675.7 |
| loops | 1668.1 | 1668.8 | 1666.0 | 1666.7 | 1672.5 | 1671.4 | 1668.6 | 1662.8 |
| π-helix | 1653.1 | 1653.7 | 1652.0 | 1653.4 | 1653.7 | 1654.2 | 1654.8 | 1649.9 |
| α-helix | 1643.9 | 1642.5 | 1642.0 | 1643.4 | 1646.2 | 1641.4 | 1645.6 | 1646.1 |
| β-sheet | 1631.2 | 1635.0 | 1626.0 | 1636.7 | 1638.7 | 1626.3 | 1627.2 | 1628.7 |
Underlined peak positions represent the greatest intensity change (i.e., the level of perturbation or flexibility) for the auto peaks within the synchronous plot.
The calcium binding site (CaBS) loop would ordinarily be assigned as a β-turn, but for relevant structural discussions related to the well-known EF-hand motif, we have used the nomenclature associated with these calcium binding proteins.
The position of the peak maximum of the amide I′ band as a function of temperature is used to generate the thermal dependence plots for all three human centrins as shown in Figure 5a. Hscen1 and Hscen2 share similar curve shapes but different relative stabilities, in good agreement with both CD thermal dependence and the DSC endotherms, in which Hscen1 is more stable than Hscen2. Also, Hscen1 and Hscen2 both reveal a pretransition at ∼20 °C. Meanwhile, Hscen3 reveals characteristics similar to those of Hscen2 at low temperatures, yet above 60 °C, the curve departs from that of Hscen2, suggesting differences in backbone dynamics, presumably because of the similarities in the calcium binding affinities it shares with both proteins (Hscen2 and Hscen1). To improve our understanding of the relationship between the backbone dynamics and the calcium binding sites, 2D IR correlation analysis was performed, the results of which are discussed below.
Band Assignments
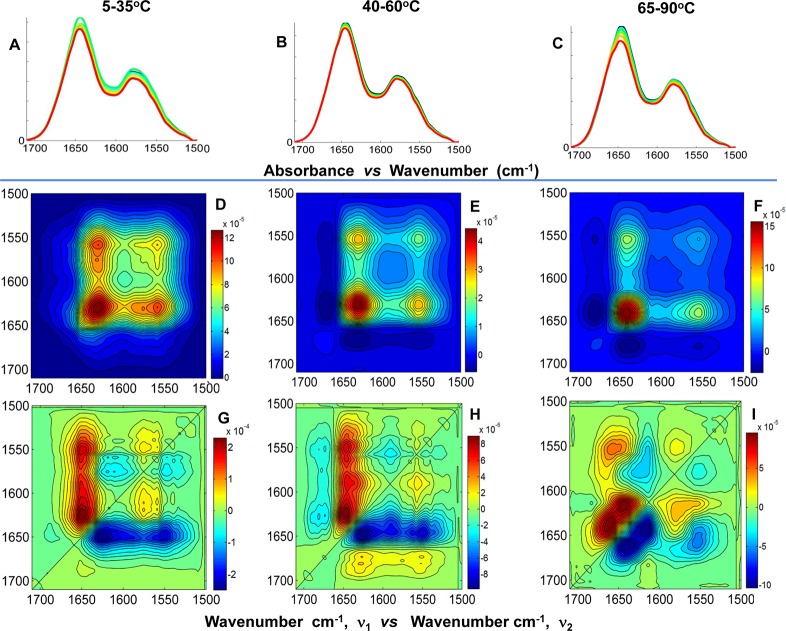
Contributing backbone vibrational modes within the FT-IR spectral overlay and 2D IR correlation analysis are summarized below for the amide I′ band (1710–1600 cm–1) and side chain band (1600–1500 cm–1). In general, all spectral data sets are arranged in columns, and the similar plot types are arranged in rows to facilitate comparison and analysis (Figures 6–8). The band assignments were made using the asynchronous plot for which the highest spectral resolution was obtained and extrapolated to the synchronous and baseline-corrected spectral overlay for each data set to validate the assignment. A summary of the actual band positions for these centrin samples is shown in Tables 2 and 3. The average of the actual peak positions for the backbone vibrational modes determined for each asynchronous plot was used to facilitate interpretation and comparison. Several spectral overlays within the range of 1710–1500 cm–1 for Hscen1, Hscen2, and Hscen3 are shown in Figures 6–8, respectively. The acquired spectra were separated into spectral data sets based on specific temperature ranges (step analysis) to ascertain the thermally induced molecular changes that occurred in the independent terminal domains of these related calcium binding proteins.41 The first temperature range studied for Hscen1 and Hscen2 was the 5–35 °C range (pretransition) shown in panels A, C, and E of Figures 6 and 7. The second temperature range for Hscen1 and Hscen2 used was the 40–95 °C range shown in panels B, D, and F of Figures 6 and 7. Meanwhile, for Hscen3, which exhibited a different thermal dependence plot (Figure 8) compared to those Hscen2 and Hscen1, the spectral data set was separated into three steps: 5–35 °C (Figure 8A,D,G), 40–60 °C (Figure 8B,E,H), and 65–90 °C (Figure 8C,F,I). The band assignments presented below have been validated and are consistent with the available X-ray structural information, previous studies with C. reinhardtii centrin, and the correlations observed within the asynchronous plots during the thermal perturbation.30−33,40−42 The amide I′ band comprises several backbone vibrational modes (Table 2) for the β-turn (1682.8 cm–1), which will be considered as a CaBS loop, because it is associated with the short antiparallel β-sheet segments located within the CaBS;32,40,42 the loops (1668.1 cm–1), also termed the hinge region between the two EF-hand motifs; the π-helix (1653.1 cm–1), located at the C-terminal end of all human centrins; the α-helical regions (1643.9 cm–1); and the β-sheets (1631.2 cm–1). The side chain modes are summarized in Table 3 and include the arginine guanidinium N–D antisymmetric and symmetric stretching modes consistent with our previous studies,40,41 and the aspartates and glutamates, which are located mainly within the CaBS and contain carboxylate stretching modes [νa–s(COO–)] sensitive to coordination with a divalent cation.40,49,50 Lower wavenumbers for the aspartate and glutamate carboxylate stretching modes are associated with the bound calcium state.40 As calcium is released, first from the low-affinity CaBS and then from the high-affinity CaBS, the peak positions shift to higher wavenumbers characteristic of the unbound (apo) state.
Figure 6.
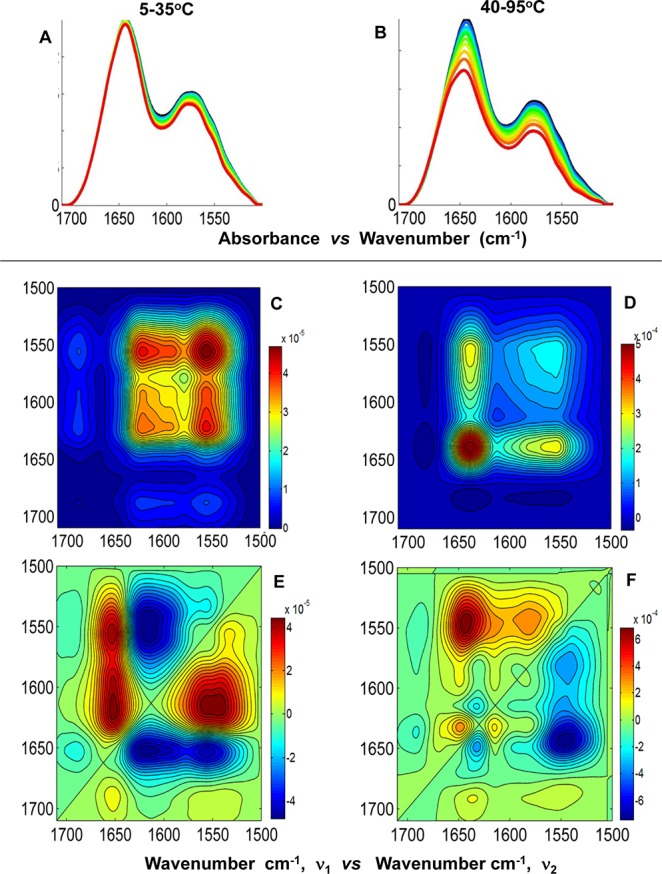
2D IR correlation spectroscopy step analysis of Hscen1 (WT) within the spectral region of 1710–1500 cm–1. (A and B) FT-IR spectral overlays of the amide I′ and side chain bands corresponding to the temperature ranges of 5–35 and 40–95 °C, respectively. (C and D) Synchronous plots and (E and F) asynchronous plots corresponding to the temperature ranges of 5–35 and 40–95 °C, respectively.
Figure 8.
2D IR correlation spectroscopy step analysis of Hscen3 (WT) within the spectral region of 1710–1500 cm–1. (A–C) FT-IR spectral overlays of the amide I′ and side chain bands corresponding to the temperature ranges of 5–35, 40–60, and 65–90 °C, respectively. (D–F) Synchronous plots and (G–I) asynchronous plots corresponding to the temperature ranges of 5–35, 40–60, and 65–90 °C, respectively.
Table 3. Summary of the Peak Assignments for the Side Chain Vibrational Modes within the Side Chain Band (1600–1500 cm–1) As Determined by the Synchronous and Asynchronous Plots.
|
Hscen1a peak position (cm–1) |
Hscen2 peak position (cm–1) |
Hscen3 peak position
(cm–1) |
||||||
|---|---|---|---|---|---|---|---|---|
| peak assignmentb | stretching vibrational mode | 5–35 °Cc | 40–95 °Cd | 5–35 °Cc | 40–95 °Cd | 5–35 °Cc | 40–60 °Cc | 60–90 °Cd |
| arginine | guanidinium νa(N–D) | 1608.7 | 1610.0 | 1603.4 | 1602.8 | 1604.2 | 1608.8 | 1613.3 |
| arginine | guanidinium νs(N–D) | 1578.7 | 1586.2 | 1591.8 | 1597.5 | 1581.3 | 1585.8 | 1581.3 |
| aspartate | νs(COO–) | 1561.4 | 1566.0 | 1572.5 | 1575.0 | 1560.5 | 1562.8 | 1564.1 |
| glutamate | νs(COO–) | 1539.0 | 1548.0 | 1546.8 | 1552.5 | 1546.9 | 1551.3 | 1555.6 |
The underlined peak position represents the greatest intensity change for the auto peaks within the synchronous plot.
Hscen1 and Hscen2 contain a single Tyr residue, and Hscen3 contains two Tyr residues, observed at 1517 cm–1, which will not be discussed in this work.
Aspartate and glutamate peak positions are characteristic of the bound state, presumably in the lower-affinity CaBS.41
Aspartate and glutamate peak positions are characteristic of the unbound (apo) state within the high-affinity CaBS. The loss of calcium binding occurs because of the high-temperature perturbation as a prerequisite step to thermal unfolding.
Figure 7.
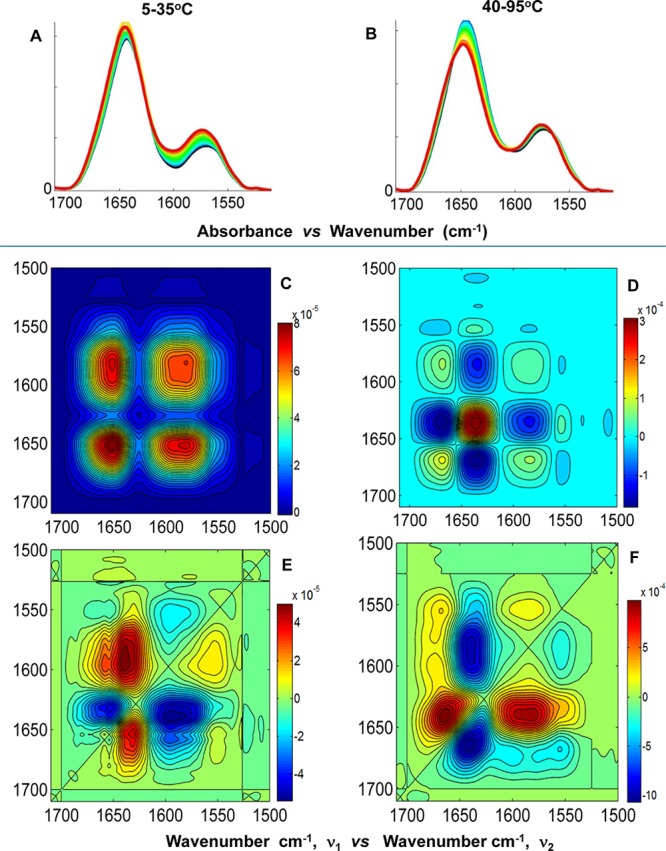
2D IR correlation spectroscopy step analysis of Hscen2 (WT) within the spectral region of 1710–1500 cm–1. (A and B) FT-IR spectral overlays of the amide I′ and side chain bands corresponding to the temperature ranges of 5–35 and 40–95 °C, respectively. (C and D) Synchronous plots and (E and F) asynchronous plots corresponding to the temperature ranges of 5–35 and 40–95 °C, respectively.
2D IR Correlation Spectroscopy
This technique enhances the resolution of the spectral region of interest via the synchronous and asynchronous plots and provides the order of events that occur during the thermal perturbation. The auto-peaks found on the diagonal of the synchronous plots show changes in intensity that occur in the spectral region of interest, and the cross-peaks relate the auto-peaks that are in phase with one another. Meanwhile, the asynchronous plots are composed exclusively of cross-peaks that change in intensity out of phase from one another. According to Noda’s rules, the phase information in the asynchronous plot is used to ascertain the order of events when the synchronous plot is composed of positive cross-peaks. The order of events is reversed when the corresponding cross-peak in the synchronous plot is negative.38,39
Similarities in Conformational Dynamics among Human Centrins
The auto-peaks in the synchronous plot comprise the overall intensity changes (i.e., the magnitude of change) associated with the backbone and side chain modes due to the temperature perturbation as indicated in Tables 2 and 3. Small changes in intensity are equivalent to smaller molecular fluctuations. These intensity changes reflect the thermal instability of the protein, and therefore, a comparative analysis of the overall effect of temperature on each protein can be conducted, providing the molecular similarities associated with the regions of greatest flexibility among the centrins. For Hscen1 (WT) in the temperature range of 5–35 °C, the aspartates (1561.4 cm–1), presumably of the low-affinity CaBS (II and III), had the greatest perturbation, while in the temperature range of 40–95 °C, the α-helical regions (1643.9 cm–1) had the greatest flexibility. For Hscen2 (WT) in the temperature range of 5–35 °C, the π-helix (1653.1 cm–1) located at the C-terminal end of the protein had the greatest flexibility, while in the temperature range of 40–95 °C, it was the short antiparallel β-sheet segments (1631.2 cm–1) located within the CaBS. This suggested that certain backbone vibrational modes are more flexible in Hscen2, which exhibited the lowest thermal transition temperature. For Hscen3 (WT) in the temperature ranges of 5–35 and 40–60 °C, the short antiparallel β-sheet segments (1631.2 cm–1) were located within the CaBS, while the largest intensity change within the temperature range of 65–90 °C was assigned to the α-helical regions (1643.9 cm–1) of Hscen3. The greatest perturbation observed for Hscen3 (WT) in the temperature ranges of 5–35 and 40–60 °C was in the β-sheet, consistent with that of Hscen2 (WT) at 40–95 °C. The greatest perturbation observed for Hscen3 (WT) in the temperature range of 65–90 °C was in the α-helical regions, consistent with that of Hscen1 (WT) at high temperatures. Thus, the similarities in the regions of the protein with greatest molecular flexibility between these centrin proteins were established.
Differences in Conformational and Side Chain Dynamics among Human Centrins
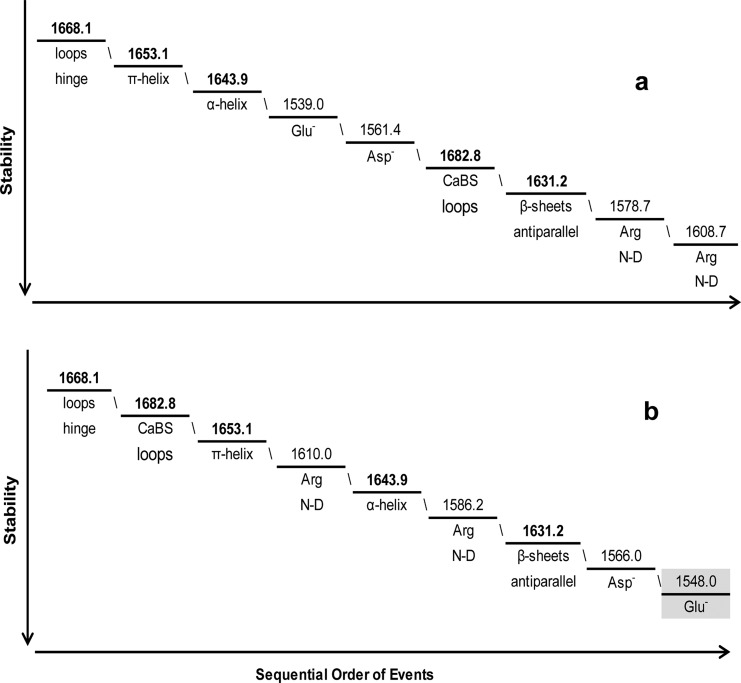
The sequential order of events describes the molecular behavior of these human centrins within the defined temperature ranges to allow for the evaluation of the relative stability of these proteins as shown in Figures 9–11 and summarized in Tables S2–S4 of the Supporting Information. For Hscen1 (WT), similar conformational dynamics were observed in both temperature ranges (5–35 and 40–95 °C), which is consistent with both N- and C-terminal domains containing one EF-hand motif in the open conformation, while the other EF-hand motif is in the closed conformation. The vibrational modes perturbed in the temperature range of 5–35 °C are summarized in Figure 9a. This molecular behavior presumably involving the CaBS II and III describes the pretransition observed for Hscen1 (WT). At higher temperatures leading up to thermal denaturation (40–95 °C) shown in Figure 9b, similar backbone vibrational modes are perturbed, while the side chains are presumably within the higher-affinity CaBS (I and IV) within Hscen1 (Figure 1).
Figure 9.
Sequential order of molecular events for Hscen1 (WT) in the temperature ranges of (a) 5–35 and (b) 40–95 °C. The lowest temperature range includes the Glu– and Asp– side chain perturbations that are presumably associated with the lower-affinity CaBS (II and III) as shown in Figure 1.32,40 The most stable vibrational mode (40–95 °C) was determined to be the glutamates within the high-affinity CaBS (I and IV) as highlighted in panel b.
Figure 11.
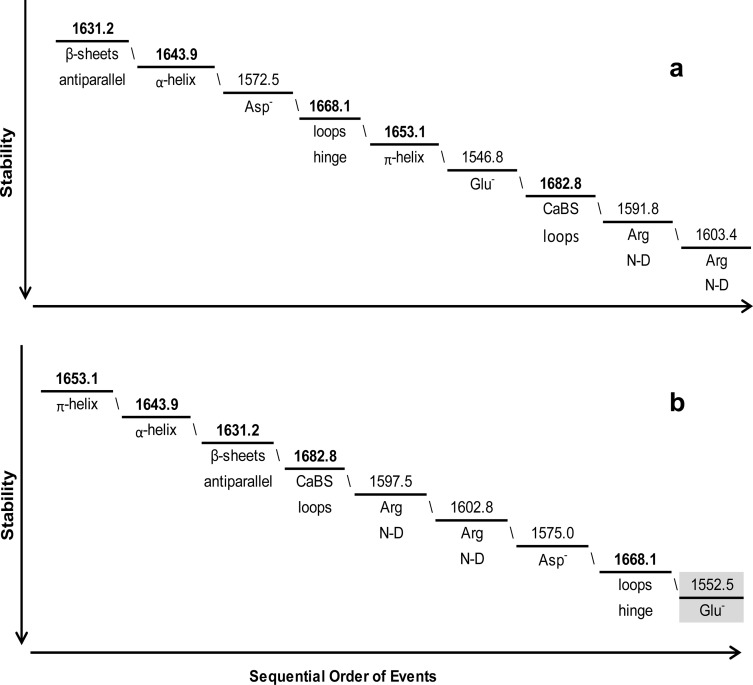
Sequential order of molecular events for Hscen3 (WT) for the temperature ranges of (a) 5–35, (b) 40–60, and (c) 65–90 °C. In the low temperature range of 5–35 °C, the low-affinity CaBS (III) is perturbed, while the most stable vibrational mode (65–90 °C) was determined to be the loops within the EF-hand domains that contained the high-affinity CaBS as highlighted in panel c.
For Hscen2 (WT), the protein behaves more like two independent domains, with the C-terminal domain being more stable than the N-terminal domain. The N-terminal domain is composed of EF-hands in the closed conformation, allowing more flexibility in the β-sheets and helical regions, while the C-terminal domain has both EF-hands in the open conformation causing the π-helix to be perturbed first in the higher temperature range. A summary of the molecular events that occurred in the temperature range of 5–35 °C is shown in Figure 10a. This sequential order of molecular events describes the pretransition of Hscen2 (WT) at higher temperatures leading to denaturation (40–95 °C), which are summarized in Figure 10b. These final events of the sequence are consistent with the EF-hand motif undergoing the transition from the open to the closed conformation, leading to thermal unfolding.
Figure 10.
Sequential order of molecular events for Hscen2 (WT) for the temperature ranges of (a) 5–35 and (b) 40–95 °C. The most stable vibrational mode (40–95 °C) was determined to be the glutamates within the high-affinity CaBS (III and IV)30,31 as highlighted in panel b.
For Hscen3 (WT), the C-terminal domain initially had conformational dynamics similar to those of Hscen1 in which one EF-hand motif is in the open conformation while the other is in the closed conformation. Thermal destabilization begins to occur in the temperature range of 5–35 °C (Figure 11a) within the loop hinge of the C-terminal end (1668.1 cm–1). The second temperature range analyzed for Hscen3 was the 40–60 °C range (Figure 11b), in which the molecular behavior was similar to that of Hscen2 where both EF-hand motifs within the N-terminal domain are in the open conformation. The third temperature range analyzed for Hscen3 was the 65–90 °C range (Figure 11c). The conformational dynamics are unique in that the initial sequential order of events was different from that of Hscen2 and Hscen1. This is consistent with the thermal dependence plot shown in Figure 4, in which the Hscen3 curve deviates from the Hscen2 and Hscen1 curves in having a different slope and therefore can be explained at the molecular level as summarized in Figure 11c.
Discussion
The differences we have observed in the molecular behavior of human centrins are governed by the affinity for Ca2+ within the different CaBS. In general, the lower-affinity CaBS were perturbed first, leading to the differences in the molecular behavior among the EF-hand motifs and in turn affecting the terminal EF-hand domain where these lower-affinity sites are located. Similarly, as the temperature was increased, the higher-affinity CaBS were perturbed, losing the coordination with the divalent cation and causing the molecular flexibility associated with the transition from the open to the closed conformation within the EF-hand motifs. These differences in molecular behavior are important factors that can be used to explain the interaction with a wide variety of biological targets and the diverse roles centrins are observed to have.
When the binding of calcium stabilizes the EF-hand domain in the open conformation, it allows for increased surface area and exposes side chains that would normally be buried for potential interaction with their biological target. It is this interface and the residues that comprise it that are selective for a particular target; therefore, a lower-affinity Ca2+ site would be less likely to accommodate a biological target. This observation may also explain the relative dependence on calcium affinity exhibited by different centrin biological targets. The hinge loop region is also very important because of the biochemical differences dictated by the residue composition.
Another important factor is the intrinsic molecular flexibility dictated by the sequence composition within the EF-hand motif, which causes the differences in dynamics within these structural domains. It is these differences in molecular flexibility that affect the overall complex formation and its stability. This is especially true when one considers C. reinhardtii centrin, which, although all of its sites are bound to calcium, is the most stable of the centrins. Crcen’s level of molecular flexibility within the C-terminal domain and hinge loop residue composition provide the optimal conditions for binding a model peptide, melittin.32 This Crcen–melittin complex, like the Hscen2–XPC complex, adopts an extended conformation, while other centrin complexes, among them the centrin–Sfi1p complex, adopt a different wrap-around conformation requiring the flexibility of the tethered helix.31,32,51 It is, in part, this flexibility that allows centrin to have multiple biological targets and is a hub within the interactome.
Other potential implications may be inferred at the cellular level for centrin in general. In the work by Winey’s group using Tetrahymena thermophila, selective site-directed mutants, specifically Asp– for Ala at the X position of different CaBS, were constructed to cause a decrease in calcium affinity at a particular site.29 The cellular outcomes observed were misorientation of the basal body and changes in its stability. If we consider the differences in molecular flexibility observed in H. sapiens centrins caused by their differences in calcium affinity, then it is feasible to envision the effect on the molecular flexibility of the Tetrahymena thermophila centrin (centrin 1), which might then affect formation of the centrin–target complex and, in turn, the structure of the basal body within this model organism. Further investigation is warranted, and we plan to pursue the study of different centrin–biological target complexes in the near future.
In summary, 2D IR correlation spectroscopy has proven to be an excellent technique for the evaluation of the relative stability of centrins. These novel 2D IR results were in good agreement with the more traditional DSC and CD data and provided a detailed molecular explanation for the differences in stability among highly related centrins. We anticipate that this technique will also be suitable for the evaluation of recombinant protein therapeutics for the evaluation of their relative stability and viability.
Acknowledgments
We thank Drs. Elmar Schiebel (Peterson Institute for Cancer Research) and John Kilmartin (University of Cambridge) for providing the centrin cDNA, Dr. Juan Carlos Martinez-Cruzado (University of Puerto Rico, Mayagüez, PR) for performing the cDNA sequencing of the centrin recombinants, Dr. Michael Berne (Tufts University, Medford, MA) for performing the partial amino acid sequencing of the centrin proteins, and Dr. Melissa Stauffer (Scientific Editing Solutions, Walworth, WI) for editing the manuscript.
Glossary
Abbreviations
- 2D IR
two-dimensional infrared
- DSC
differential scanning calorimetry
- CD
circular dichroism
- Hscen1
centrin 1
- Hscen2
centrin 2
- Hscen3
centrin 3
- Hscen4
centrin 4
- MTOC
microtubule organizing center
- Crcen
C. reinhardtii centrin
- CaBS
calcium binding sites
- FT-IR
Fourier transform infrared.
Supporting Information Available
Amino acid sequence alignment of H. sapiens and C. reinhardtii centrins (Figure S1), DSC thermograms within the temperature range of 10–130 °C (Figure S2), summary of far-UV CD comparative analysis of H. sapiens centrins (Table S1), summary of the sequential order of events for Hscen1 (WT) (Table S2), summary of sequential order of events for Hscen2 (WT) (Table S3), and summary of sequential order of events for Hscen3 (WT) (Table S4). This material is available free of charge via the Internet at http://pubs.acs.org.
The authors declare no competing financial interest.
This project is supported by National Institutes of Health SCORE Grant SO6GM08103 (B.P.-R.), the Henry Dreyfus Teacher Scholar Award (B.P.-R.), the Alfred P. Sloan Foundation (A.R.N.), and the University of Puerto Rico.
Funding Statement
National Institutes of Health, United States
Supplementary Material
References
- Hartman H.; Federov A. (2002) The origin of the eukaryotic cell: A genomic investigation. Proc. Natl. Acad. Sci. U.S.A. 99, 1420–1425. [DOI] [PMC free article] [PubMed] [Google Scholar]
- Salisbury J. L. (2007) A mechanistic view on the evolutionary origin for centrin-based control of centriole duplication. J. Cell. Physiol. 213, 420–428. [DOI] [PubMed] [Google Scholar]
- Giessl A., Trojan P., Pulvermuller A., and Wolfrum U. (2004) Centrins, Potential Regulators of Transducin Translocation in Photoreceptor Cells. In Photoreceptor cell biology and inhereted retinal degenerations (Williams D. S., Ed.) pp 195–215, World Scientific, Singapore. [Google Scholar]
- Laoukili J.; Perret E.; Middendorp S.; Houcine O.; Guennou C.; Marano F.; Bornens M.; Tournier F. (2000) Differential expression and cellular distribution of centrin isoforms during human ciliated cell differentiation in vitro. J. Cell Sci. 113, 1355–1364. [DOI] [PubMed] [Google Scholar]
- Gavet O.; Alvarez C.; Gaspar P.; Bornens M. (2003) Centrin4p, a novel mammalian centrin specifically expressed in ciliated cells. Mol. Biol. Cell 14, 1818–1834. [DOI] [PMC free article] [PubMed] [Google Scholar]
- Araki M.; Masutani C.; Takemura M.; Uchida A.; Sugasawa K.; Kondoh J.; Ohkuma Y.; Hanaoka F. (2001) Centrosome protein centrin2/caltractin1 is part of the xeroderma pigmentosum group C complex that initiates global genome nucleotide excision repair. J. Biol. Chem. 276, 18665–18672. [DOI] [PubMed] [Google Scholar]
- Nishi R.; Okuda Y.; Watanabe E.; Mori T.; Iwai S.; Masutani C.; Sugasawa K.; Hanaoka F. (2005) Centrin 2 stimulates nucleotide excision repair by interacting with xerodermapigmentosum group C protein. Mol. Cell. Biol. 25, 5664–5674. [DOI] [PMC free article] [PubMed] [Google Scholar]
- Resendes K. K.; Rasala B. A.; Forbes D. J. (2008) Centrin 2 Localizes to the Vertebrate Nuclear Pore and Plays a Role in mRNA and Protein Export. Mol. Cell. Biol. 28, 1755–1769. [DOI] [PMC free article] [PubMed] [Google Scholar]
- Manandhar G.; Simerly C.; Salisbury J. L.; Schatten G. (1997) Centosome reduction during mouse spermiogenesis: Centriole and centrin degeneration. Mol. Biol. Cell 8(Suppl.), 56a. [DOI] [PubMed] [Google Scholar]
- Palermo G. D.; Joris H.; Devroey P.; Van Steirteghem A. C. (1992) Pregnancies after intra cytoplasmic sperm injection of single spermatozoon into an oocyte. Lancet 340, 17–18. [DOI] [PubMed] [Google Scholar]
- Pearson C. C.; Giddings T. H.; Winey M. (2009) Basal body components exhibit differential protein dynamics during nascent basal body assembly. Mol. Biol. Cell 20, 904–914. [DOI] [PMC free article] [PubMed] [Google Scholar]
- Salisbury J. L.; Suino K.; Busby R.; Springett M. (2002) Centrin-2 is required for centriole duplication in mammalian cell. Curr. Biol. 12, 1287–1292. [DOI] [PubMed] [Google Scholar]
- Nigg E. A. (2007) Centrosome duplication: Of rules and licenses. Trends Cell Biol. 17, 215–221. [DOI] [PubMed] [Google Scholar]
- Lingle W. L.; Barrett S. L.; Negrón V.; D’Assoro A.; Whitehead C. M.; Salisbury J. L. (2001) Chromosomal instability and loss of tissue differentiation in breast tumors correlate with independent aspects of centrosome amplification. Mol. Biol. Cell 12, 175A. [Google Scholar]
- Lingle W. L.; Barrett S. L.; Negrón V. C.; D’Assoro A. B.; Boeneman K.; Liu W.; Whitehead C. M.; Reynolds C.; Salisbury J. L. (2002) Centrosome amplification drives chromosomal instability in breast tumor development. Proc. Natl. Acad. Sci. U.S.A. 99, 1978–1983. [DOI] [PMC free article] [PubMed] [Google Scholar]
- Dawe H. R.; Farr H.; Gull K. (2007) Centriole/basal body morphogenesis and migration during ciliogenesis in animal cells. J. Cell Sci. 120, 7–15. [DOI] [PubMed] [Google Scholar]
- Hoyer-Fender S. (2010) Centriole maturation and transformation. Semin. Cell Dev. Biol. 21, 142–147. [DOI] [PubMed] [Google Scholar]
- Bandano J. L.; Mitsuma N.; Beales P. L.; Katsanis N. (2006) The Ciliopathies: An emerging class of human genetic disorders. Annu. Rev. Genomics Hum. Genet. 7, 125–148. [DOI] [PubMed] [Google Scholar]
- Hildebrant F.; Benzing T.; Katsanis N. (2011) Mechanism of Disease Ciliopathies. N. Engl. J. Med. 364, 1533–1543. [DOI] [PMC free article] [PubMed] [Google Scholar]
- Ostrowski L. E.; Dutcher S. K.; Lo C. W. (2011) Cilia and models for studying structure and function. Proc. Am. Thorac. Soc. 8, 423–429. [DOI] [PMC free article] [PubMed] [Google Scholar]
- Bettencourt-Dias M.; Hildebrant F.; Pellman D.; Woods G.; Godinho S. A. (2011) Centrosomes and cilia in human disease. Trends Genet. 27, 307–315. [DOI] [PMC free article] [PubMed] [Google Scholar]
- Lee J. E.; Gleeson J. G. (2011) A systems-biology approach to understanding the ciliopathy disorders. Genome Med. 1–9. [DOI] [PMC free article] [PubMed] [Google Scholar]
- Novariano G.; Akizu N.; Gleeson J. G. (2011) Modeling human disease in humans: The ciliopathies. Cell 147, 7079. [DOI] [PMC free article] [PubMed] [Google Scholar]
- Zaki M. S.; Sattar S.; Massoudi R. A.; Gleeson J. G. (2011) Co-Occurrence of distinct ciliopathy diseases in single families suggests genetic modifiers. Am. J. Med. Genet., Part A 9999, 1–8. [DOI] [PMC free article] [PubMed] [Google Scholar]
- Marshall J. D.; Maffei P.; Collin G. B.; Naggert J. K. (2011) Alström Syndrome: Genetics and Clinical Overview. Curr. Genomics 12, 225–235. [DOI] [PMC free article] [PubMed] [Google Scholar]
- Bergmann C. (2011) Educational paper: Ciliopathies. Eur. J. Pediatr. 171, 1285–1300. [DOI] [PMC free article] [PubMed] [Google Scholar]
- Delaval B.; Covassin L.; Lawson N. D.; Doxsey S. (2011) Centrin depletion causes cyst formation and other ciliopathy-related phenotypes in zebrafish. Cell Cycle 10, 3964–3972. [DOI] [PMC free article] [PubMed] [Google Scholar]
- Koblenz B.; Schoppmeier J.; Grunow A.; Lechtreck K. F. (2003) Centrin deficiency in Chlamydomonas causes defects in basal body replication, segregation and maturation. J. Cell Sci. 116, 2635–2646. [DOI] [PubMed] [Google Scholar]
- Vonderfecht T.; Stemm-Wolf A. J.; Hendershott M.; Giddings T. H. Jr.; Meehl J. B.; Winey M. (2011) The two domains of centrin have distinct basal body functions in Tetrahymena. Mol. Biol. Cell 22, 2221–2234. [DOI] [PMC free article] [PubMed] [Google Scholar]
- Gifford J. L.; Walsh M. P.; Vogel H. (2007) Structures and metal-ion-binding properties of the Ca2+-binding helix-loop-helix EF-hand motifs. Biochem. J. 405, 199–221. [DOI] [PubMed] [Google Scholar]
- Thompson J. R.; Ryan Z. C.; Salisbury J. L.; Kumar R. (2006) The structure of the human centrin 2-xeroderma pigmentosum group C protein complex. J. Biol. Chem. 281, 18746–18752. [DOI] [PubMed] [Google Scholar]
- Sosa L. D. V.; Alfaro E.; Santiago J.; Narváez D.; Rosado M. C.; Rodríguez A.; Gómez A. M.; Schreiter E.; Pastrana-Rios B. (2011) The Structure, Molecular Dynamics, and Energetics of Centrin-Melittin Complex. Proteins: Struct., Funct., Bioinf. 79, 3132–3143. [DOI] [PMC free article] [PubMed] [Google Scholar]
- Nakayama S.; Kretsinger R. H. (1998) Classification and evolution of EF-hand proteins. BioMetals 11, 277–295. [DOI] [PubMed] [Google Scholar]
- Veeraraghavan S.; Fagan P. A.; Hu H.; Lee V.; Harper J. F.; Huang B.; Chazin W. J. (2002) Structural independence of the two EF-hand domains of caltractin. J. Biol. Chem. 277, 28564–28571. [DOI] [PubMed] [Google Scholar]
- Weber C.; Lee V. D.; Chazin W. J.; Huang B. (1994) High-level expression in Escherichia coli and characterization of the EF-hand calcium-binding protein caltractin. J. Biol. Chem. 269, 15795–15802. [PubMed] [Google Scholar]
- Makhatadze G. I. (2001) Measuring protein thermostability by differential scanning calorimetry. Curr. Protoc. Protein Sci. 7.9.1–7.9.14. [DOI] [PubMed] [Google Scholar]
- Berova N., Nakanishi K., and Woody R. W., Eds. (2000) Circular dichroism, principles and applications, 2nd ed., pp 912, John Wiley and Sons, New York. [Google Scholar]
- Noda I. (2004) Advances in two-dimensional correlation spectroscopy. Vib. Spectrosc. 36, 143–165. [Google Scholar]
- Noda I. (2008) Recent advancement in the field of two-dimensional correlation spectroscopy. J. Mol. Struct. 883, 2–26. [Google Scholar]
- Pastrana-Rios B.; Ocaña W.; Rios M.; Vargas G. L.; Ysa G.; Poynter G.; Tapia J.; Salisbury J. L. (2002) Centrin: Its secondary structure in the presence and absence of cations. Biochemistry 41, 6911–6919. [DOI] [PubMed] [Google Scholar]
- Pastrana-Rios B. (2001) Mechanism of Unfolding of a Model Helical Peptide. Biochemistry 40, 9074–9081. [DOI] [PubMed] [Google Scholar]
- Sanoguet-Carrero Z.; Campbell M.; Ramos S.; Seda C.; Pastrana-Rios B. (2006) Effects of phosphorylation in Chlamydomonas centrin Ser 167. Calcium Binding Proteins 1, 108–114. [PMC free article] [PubMed] [Google Scholar]
- Lafitte D.; Tsvetkov P. O.; Devred F.; Toci R.; Barras F.; Briand C.; Makarov A. A.; Haiech J. (2002) Cation binding mode of fully oxidized calmodulin explained by the unfolding of the apostate. Biochim. Biophys. Acta 1600, 105–110. [DOI] [PubMed] [Google Scholar]
- Sorensen B. R.; Shea M. A. (1998) Interactions between domains of Apo Calmodulin Alter Calcium Binding and Stability. Biochemistry 37, 4244–4253. [DOI] [PubMed] [Google Scholar]
- Fabian H., and Mantele W. (2002) Infrared Spectroscopy of Proteins. In Encyclopedia of Analytical Chemistry, pp 1–24, John Wiley & Sons Ltd., New York. [Google Scholar]
- Arrondo J. L. R.; Muga A.; Castresana J.; Goñi F. M. (1993) Quantitative Studies of the Structure of Proteins in Solution by Fourier-transform Infrared Spectroscopy. Prog. Biophys. Mol. Biol. 59, 23–56. [DOI] [PubMed] [Google Scholar]
- Chirgadze Y. N.; Fedoroy V.; Trushina N. P. (1975) Estimation of amino acid residue side-chain absorption in the infrared spectra of protein solutions in heavy water. Biopolymers 14, 679–694. [DOI] [PubMed] [Google Scholar]
- Venyaminov S. Y.; Kalnin N. N. (1990) Quantitative IR spectrophotometry of peptide compounds in water (H2O) solutions. 1. Spectral parameters of amino-acid residue absorption-bands. Biopolymers 30, 1243–1257. [DOI] [PubMed] [Google Scholar]
- Mizuguchi M.; Nara M.; Kawano K.; Nitta K. (1997) FT-IR study of the Ca2+-binding to bovine α-lactalbumin. Relationships between the type of coordination and characteristics of the bands due to the Asp– COO– groups in the Ca2+-binding site. Eur. J. Biochem. 250, 72–76. [DOI] [PubMed] [Google Scholar]
- Nara M.; Morii H.; Tanokura M. (2012) Coordination to divalent cations by calcium-binding proteins studied by FT-IR spectroscopy. Biochim. Biophys. Acta 10.1016/j.bbamem.2012.11.025. [DOI] [PubMed] [Google Scholar]
- Li S.; Sandercock A. M.; Conduit P.; Robinson C. V.; Williams R. L.; Kilmartin J. V. (2006) Structural role of Sfi1p-centrin filaments in budding yeast spindle pole body duplication. J. Cell Biol. 173, 867–877. [DOI] [PMC free article] [PubMed] [Google Scholar]
Associated Data
This section collects any data citations, data availability statements, or supplementary materials included in this article.


