


Abstract
A number of copy number variation (CNV) calling algorithms exist; however, comprehensive software tools for CNV association studies are lacking. We describe ParseCNV, unique software that takes CNV calls and creates probe-based statistics for CNV occurrence in both case–control design and in family based studies addressing both de novo and inheritance events, which are then summarized based on CNV regions (CNVRs). CNVRs are defined in a dynamic manner to allow for a complex CNV overlap while maintaining precise association region. Using this approach, we avoid failure to converge and non-monotonic curve fitting weaknesses of programs, such as CNVtools and CNVassoc, and although Plink is easy to use, it only provides combined CNV state probe-based statistics, not state-specific CNVRs. Existing CNV association methods do not provide any quality tracking information to filter confident associations, a key issue which is fully addressed by ParseCNV. In addition, uncertainty in CNV calls underlying CNV associations is evaluated to verify significant results, including CNV overlap profiles, genomic context, number of probes supporting the CNV and single-probe intensities. When optimal quality control parameters are followed using ParseCNV, 90% of CNVs validate by polymerase chain reaction, an often problematic stage because of inadequate significant association review. ParseCNV is freely available at http://parsecnv.sourceforge.net.
INTRODUCTION
Copy number variation (CNV) association is being increasingly adopted in genetic investigations of disease susceptibility loci (1,2). Large de novo CNVs were once considered to be the cause of syndromes, but more complete CNV maps now show that CNVs pervade the genome, and small CNVs can also be disease causing (3). Thus, CNV frequency difference between cases and control subjects at specific loci is necessary to determine if a given CNV plays a role in disease or impacts the expression of a clinical trait. Conceptually, the most important variables involved in CNV analysis include disease under study, sample cohort, array data, CNV calling algorithm and data interpretation using an algorithm implementing CNV statistics. CNV calling and methods of demonstrating association have been hampered by many challenges, which have discouraged researchers from investigating CNVs. ParseCNV is designed to simplify data processing and to improve transparency to render CNV studies more accessible to researchers.
Many CNV calling algorithms have been developed, but relatively few CNV association methods exist. As a result, streamlined implementation of association methods is lacking. CNV calling algorithms evaluate allelic intensity and genotype states in the case of single-nucleotide polymorphisms (SNPs), whereas Comparative genomic hybridization (CGH) signal is based on intensity alone. Typically, both SNP and CGH arrays assess raw data for CNVs at the genome-wide level with discrete genetic determinants. The latter include CN = 0, 1, 2, 3, 4 copy number states captured by both SNP and CGH arrays, together with AA, AB, BB genotype states for SNP arrays. As the array probes have a Gaussian distribution, clustering algorithms are used to determine the expected value for a given state based on a population from which variation of a given sample can be quantified as a LogR-Ratio (LRR)/Log2-Ratio, together with B allele frequency for SNP arrays (4). PennCNV (5) is a popular option for SNP array analysis, implementing a hidden Markov model algorithm. A number of other CNV calling options are available, including QuantiSNP (6), CNVCALL (7), CNVDetector (8), CGHCall (9) and CNV-Seq (10), all of which are publicly available tools and highly enabling to researchers.
Although there are several available CNV association methods in the public domain, including CNVtools (likelihood ratio trend test) (11), Birdsuite (regression sum number copies each allele) (12), Plink (permutation-based test) (13) and CNVassoc (latent class model) (14), all of them have significant limitations, as they lack simple standard input and integrative reporting functions, which limits their discovery power, investigation potential and validation success (Supplementary Note). Although CNVtools and CNVassoc do both CNV calling and association, they make the actual CNV calls hidden to the user and are batch dependent. Here, we demonstrate the robustness of ParseCNV in producing high-quality CNV regions (CNVR) calls by improving transparency and accuracy of CNV association studies.
MATERIALS AND METHODS
Upfront quality control
As multiple confounding factors can bias the detection of CNV calls, it is essential to apply filters, using sample-based quality metrics affecting CNV detection accuracy. Several steps are taken upfront to remove samples with outlier values for the CNV metrics, which can be briefly conceptualized as low call rate, intensity noise, intensity waviness, population stratification, high number of CNVs and relatedness. In this regard, there are several important sample quality metrics measures, specifically (i) sample call rate/clustering quality; (ii) standard deviation of allelic intensity (SD LRR); (iii) G/C base content waviness factor (GCWF); (iv) count CNV; (v) majority ethnicity cluster using principle components analysis from Eigenstrat smartpca (15), multi-dimensional scaling (MDS) (16) or population stratification correction by covariate; and (vi) no duplicates.
For Illumina 550 k data and related Illumina chip platforms, the key data quality metric thresholds we have observed are call rate >98%, SD LRR <0.3, |GCWF| <0.05 and count CNV <100. For Affymetrix 6.0 data, these measures include call rate >96%, SD LRR <0.35, |GCWF| <0.02 and count CNV <80. In addition, observations of quality metric modes from individual laboratories and sample sources are advisable to determine appropriate Quality Control (QC) thresholds. The distribution of these metric measures is constantly reviewed to include only those who fall within a linear mode of the quality metric outside exponential modes for any given genotyping platform. Sample call rate/clustering quality and standard deviation of allelic intensity are crucial minimal sample exclusion metric measures that have been established as a field consensus (17). By providing the PennCNV log files (i.e. summary lines), together with GenomeStudio/GenotypingConsole/Plink missing call rates as input, ParseCNV generates images of the distributions of these quality metrics values to make informed decisions of the necessary data thresholds needed (balancing the trade-off between sample number attrition and study bias). Also, different CNV calling programs provide different quality control fields; hence, less standardization of input is possible. Among several high-quality programs that are available, we find PennCNV to provide the most complete quality metrics.
Input files
After generation of CNV calls, independent of algorithm, CNV association is performed by the newly developed ParseCNV algorithm. ParseCNV uses four standard inputs: case CNV calls (PennCNV format is the default, but any CNV calling method may be used), control CNV calls (PennCNV format), fam file (Plink format) and probe map file (Plink format) (Figure 1). Optional input of raw signal files used as input to the CNV calling algorithm allows raw genotype [B-allele frequency (BAF) if available] and intensity (LRR or Log2-Ratio) (4) signals of associated regions to be parsed with an image that is automatically generated for review. Sample batches can be defined to track their expected versus observed contribution to significant associations.
Figure 1.

CNV Analysis Workflow. Pre-processing, file formats and post-processing. This general framework shows the stepwise procedure to prepare input data to use and evaluate ParseCNV output. ‘…’ represents additional columns not shown.
Probe-based CNV statistics
The general outline of data processing involves mapping the individual-level CNV calls into population-level probe-based CNV statistics followed by filtering significantly associated population CNVRs. CNV calls are mapped onto probe-based statistics defined by the probe map file and calculated for significance based on Fisher’s exact test (18). The Fisher’s exact test statistic consists of a two by two contingency table (with cases deleted versus cases not deleted and controls deleted versus controls not deleted) and is evaluated separately for duplications. This is a conceptual medium between associating all CN states separately and all CNVs together (Figure 2). Singular state and combined state statistics are also calculated for reference. Probes without nominal significance (P < 0.05) are discarded from further association testing. Case-enriched significant probes are then separated from control-enriched significant probes.
Figure 2.
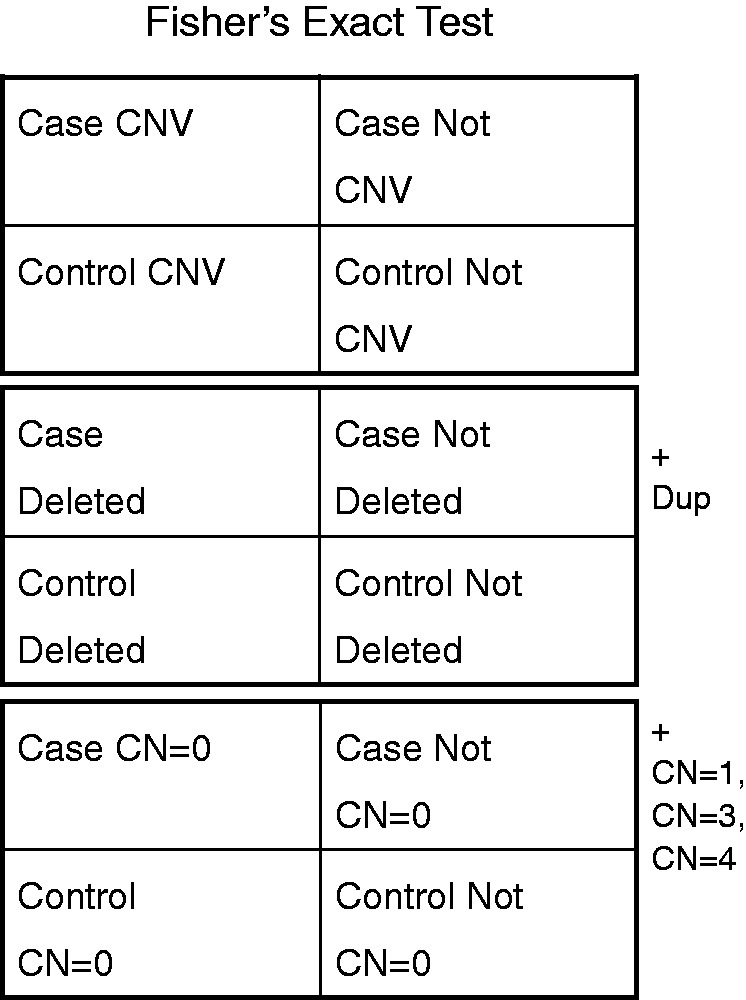
Possible statistical contingency table definitions to capture CNV frequency difference in cases versus control subjects. The middle statistical definition of deletions signifying loss of function mutations and duplications signifying gain of function mutations is used predominantly. This is in contrast to a view that all CNVs are similarly detrimental put forth by the top statistical definition and the view that all CNV states lead to a unique outcome put forth by the bottom statistical definition.
If a family based study is being done, the transmission disequilibrium test is calculated and used to drive CNVR definition. Quantitative trait association is also supported by running ParseCNV with the includePed option, Plink association and InsertPlinkPvalues (part of ParseCNV).
Merging probe-based statistics into CNVRs
Flexibility in probe aggregation incorporated into CNVRs allows for boundary truncation variability problems inherent in many CNV calling algorithms and dynamic case/control overlap to be made, while refining the association region. The aforementioned probe-based statistic output is then merged into CNVRs based on probe proximity (<1 MB) and comparable significance (±1 log P-value) of neighbouring probes. One megabase allows for extension of CNVRs over sparse probe coverage regions. This can be tuned by command line option in keeping with the average probe spacing of the data set or can be made region-specific based on the distance of 5–10 proximal probes.
CNV boundary determination remains a challenge to differentiate true boundary variations versus variability in the probe’s ability to differentiate CNV states. The difficulty is typically attributed to noisy probes within true CNVs. Thus, certain fluctuation in CNV frequency of cases versus control subjects is captured by the respective P-values. Some case calls may stop and others start within the CNVR, making P-value-based merging of probe-based statistics highly flexible. Therefore, the next probe with available data may be noisy, and any probe available substantiating the similar P-value within 1 MB can be used to extend the CNVR. Noisy probes cannot be filtered out before CNV calling because of lack of metrics with specificity for noise and not for true CNV with both behaving similarly in classic probe-based call rate metrics.
Many CNV detection and association tools have difficulties handling CNVR break points, and some algorithms make the assumption of considering CNVR break points as static, which is an oversimplification often leading to false-negative results. For example, a static CNVR may extend outside the boundary in some cases with only partial overlap in control subjects, while having pathogenic impact. Merging neighbouring probes based on proximity and P-value supports dynamic CNVR definition and is flexible for the CNV boundary variations of complex CNVs (Figure 3). The most significant sub-region is included when multiple significant proximal extensions of the respective CNVR exist, to reduce redundancy.
Figure 3.
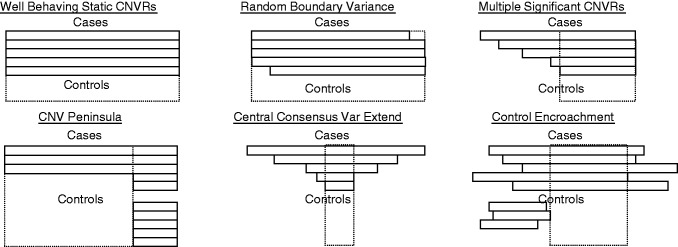
Complex CNV Overlap and CNVR definition examples. Rectangles represent individual sample CNV call boundaries as provided by a CNV calling algorithm. Each assayed point represented by the probe framework listed in the map file input determines the possible boundary assignments. The CNVR definition assigned by ParseCNV is shown as a dashed box. Small variance in individual CNV call boundaries allows extension of CNVR definition. CNV peninsula is shown as the most common false-positive result based on variable extension of CNV boundary (typically the region common to cases and controls has many probes, whereas the case only extension has few probes).
Review of association signals by quality tracking
Based on various parameters that have been referenced in the CNV literature and review of many putative CNV associations by informatics and polymerase chain reaction (PCR) validation, we have amassed red flags for evaluation of significant CNVRs for confidence. These contributing CNV call features are automatically annotated, are viewable in the University of California Santa Cruz (UCSC) browser and are specifically tailored towards reducing false-positive calls from the following criteria:
Many segmental duplications (i.e. nearly identical DNA segments), representing genomic segments that are difficult to uniquely hybridize probes to, which could underlie false-positive CNV detection (19).
Overlapping multiple Database of Genomic Variants (DGV) (20) entries, representing CNV signals observed in ‘healthy’ individuals, suggesting that a potential association result in the study at hand may be false.
Residing at centromere and telomere proximal regions, as they often have sparse probe coverage and only have a single flanking diploid reference to base CNV calls.
Harbouring high or low GC content regions that bias probe hybridization kinetics even after GC model correction is done by CNV calling algorithms, producing false CNV calling and biasing the result.
CNVs captured with low-average number of probes, contributing to association with low confidence. If an association depends on a preponderance of small CNVs, the likelihood of false-positive result is high.
Locus frequently found in multiple studies, such as T cell receptor, Ig, human leucocyte antigens and olfactory receptor (OR genes). T cell receptors undergo somatic rearrangement because of Variable Diverse Joining (VDJ) recombination causing inter-individual differences in the clonality of T-cell populations (21); thus, they are not true CNVs, necessitating exclusion.
CNV regions with high population frequency (for rare CNV focused studies) indicate that probe clustering is likely biased because of a high percentage of samples with CNV used in clustering definition, thus biasing CNV detection.
CNV peninsula of common CNV (sparse probe coverage and nearby high frequency CNV) indicates that within the range of contributing CNV boundaries, there is a non-significant (P > 0.05) P-value, which is notably different from the CNVR association typically because of random extension of common CNVs to neighbouring sparse or noisy probes (Figure 3).
The same inflated sample driving multiple CNV associations signals. Certain samples have many noisy CNV calls arising in rare regions despite upfront sample quality filtering.
Sparse coverage with large gap in probe coverage exists within the CNV calls, indicating uncertainty in the continuity of a single-CNV event, typically because of dense clusters of copy number (intensity only) probes with large intervening gaps.
Low BAF AB frequency: (0.1, 0.4) or (0.6, 0.9) are important for duplications, AB banding of BAF at 0.33 and 0.66 for CN = 3 or 0.25 and 0.75 for CN = 4 are important observations given the relatively modest gain in intensity observed in duplications.
Low-average confidence based on the hidden Markov Model (HMM) confidence score of calls contributing to a CNVR association in PennCNV is a superior indication of CNV call confidence compared with numsnps and length in studies comparing de novo versus inherited CNV calls, giving an indication of the strength of the CNV signal or aggregate difference in probability between the called CN and the next highest probability CN. Other CNV calling algorithms give different range confidence scores or lower values might mean more confidence (i.e. call P-value); hence, threshold may need modification. It is recommended to be in a rawcnv file as column 8, that is, ‘conf = 20.659’ but not required.
Low-average length is a classical confidence scoring parameter in the length of the CNV. If the CNV is too small, it is sub-microscopic, and even if many probes are tightly clustered, bias of local DNA regions and probe overlap make confidence difficult.
Multiple testing correction
To inform the assessment process of statistical significance of CNVR association and reject the null hypothesis of no association of CNVs to the disease under study, various CNV metrics are calculated including (i) the number of probes with a nominal frequency of CNV occurrence (only probes with some CNV detected are informative); (ii) the number of probes with enrichment in cases versus control subjects and vice versa (evidence of more case enriched loci than control enriched loci above certain significance thresholds); (iii) probes with <1% population frequency of CNV (optionally for rare CNV studies); and (iv) the number of CNVRs (multiple probes are needed to detect a single CNV, and these do not count as separate events for multiple-testing correction). These calculated values provide a realistic number of statistical tests to correct for. In practice, using the Illumina and Affymetrix high density SNP arrays, we find P < 5 × 10⁻⁴ uncorrected P-values meet conservative multiple-testing significance based on these criteria.
CNV validation by quantitative polymerase chain reaction
For experimental CNV validation using quantitative PCR (qPCR), the sample input is 60 μl at 6.25 ng/μl (to run the locus + four house-keeping genes in triplicate at 4 μl each run). Twenty base forward and reverse primers were developed for each locus. Universal Probe Library (Roche, Indianapolis, IN, USA) probes were selected using the ProbeFinder v2.41 software (Roche, Indianapolis, IN, USA). Quantitative PCR was performed on an ABI 7500 Real Time PCR Instrument or on an ABI Prism™ 7900HT Sequence Detection System (Applied Biosystems, Foster City, CA, USA). Each sample was analysed in quadruplicate either in 25 μl reaction mixture (250 nM of probe, 900 nM of each primer, Fast Start TaqMan Probe Master from Roche and 10 ng of genomic DNA) or in 10 μl reaction mixture (100 nM of probe, 200 nM of each primer, 1× Platinum Quantitative PCR SuperMix-Uracil–DNA–Glycosylase with 6-Carboxy-X-Rhodamine (ROX) from Invitrogen and 25 ng of genomic DNA). The values were evaluated using Sequence Detection Software v2.2.1 (Applied Biosystems, CA, USA). Data analysis was further performed using either the ΔΔ threshold value (CT) method or qBase. Reference genes, chosen from cordon-bleu homolog (COBL), glucuronidase, beta (GUSB) and alpha-synuclein (SNCA), were included based on the minimal coefficient of variation, and then data were normalized by setting a normal control to a value of 1.
The data output is 0.5 for deletions, 1 for diploid, 1.5 for duplications with standard error values from replicate runs.
TaqMan® Copy Number Assay experiments were also run on Applied Biosystems 7900HT Fast Real-Time PCR System to validate the presence of CNVs. Applied Biosystems CopyCaller™ Software performed relative quantitation analysis of genomic DNA targets using the real-time PCR data from TaqMan® Copy Number Assay experiments. Two replicates were run with confidence score >0.99 for CNV calls. Positive and negative controls were used to confirm probe accuracy.
RESULTS AND DISCUSSION
A deletion and duplication CNVR report showing significant association is provided, including 127 fields in a final output file with 54 highly informative fields included in the default output format and 11 fields in a brief report (Table 1) to aid accessibility for ParseCNV users. Besides P-value and odds ratios (ORs) for each CNVR for all combined CNV state definitions (Figure 2), contributing sample IDs, their CN states, closest gene, gene description, pathway and the average number of probes underlying contributing CNV calls are provided for confidence scoring and biological interpretation. Such tracking information to enable quality assessment beyond initial sample-based quality filtering is not available in other CNV association software tools.
Table 1.
Significant CNVR output fields description
| Column | Description |
|---|---|
| CNVR | CNV region of greatest significance and overlap coordinates. |
| CountSNPs | The number of probes available in the CNVR for this data set. In this case, contributing individual CNV calls may be larger. |
| SNP | Tag SNP for ease and clarity of reporting and replication. |
| DelTwoTailed | Two-tailed Fisher’s exact P-value based on the contingency table Cases Del/Cases Diploid/Controls Del/Controls Diploid as listed separately. |
| DupTwoTailed | Two-tailed Fisher’s exact P-value based on the contingency table Cases Dup/Cases Diploid/Controls Dup/Controls Diploid as listed separately. |
| ORDel | The odds ratio for deletion. |
| ORDup | The odds ratio for duplication. |
| Cases Del | The number of cases with a deletion detected in this region by PennCNV. |
| Cases Diploid | The number of cases without a deletion or duplication detected in this region by PennCNV. |
| Control Del | The number of control subjects with a deletion detected in this region by PennCNV. |
| Control Diploid | The number of control subjects without a deletion or duplication detected in this region by PennCNV. |
| Cases Dup | The number of cases with a duplication detected in this region by PennCNV. |
| Cases Diploid | The number of cases without a deletion or duplication detected in this region by PennCNV. |
| Control Dup | The number of control subjects with a duplication detected in this region by PennCNV. |
| Control Diploid | The number of control subjects without a deletion or duplication detected in this region by PennCNV. |
| IDsCasesDel | The sample IDs of cases corresponding to the Cases Del column for clinical data lookup. To convert to list in Excel: Data-TextToColumns-Delimited-Space then Copy-PasteSpecial-Transpose. |
| IDsCasesDup | The sample IDs of cases corresponding to the Cases Dup column for clinical data lookup. To convert to list in Excel: Data-TextToColumns-Delimited-Space then Copy-PasteSpecial-Transpose. |
| StatesCasesDel | CN states listed corresponding to IDsCasesDel [1 (CN = 0)/2 (CN = 1)]. |
| StatesCasesDup | CN states listed corresponding to IDsCasesDup [5 (CN = 3)/6 (CN = 4)]. |
| TotalStatesCases(1) | The number of cases in Cases Del with a homozygous deletion or both copies lost. |
| TotalStatesCases(2) | The number of cases in Cases Del with a hemizygous deletion or one copy lost. |
| TotalStatesCases(5) | The number of cases in Cases Dup with a hemizygous duplication or one copy gained. |
| TotalStatesCases(6) | The number of cases in Cases Dup with a homozygous duplication or two copies gained. |
| IDsDelControl | The sample IDs of control subjects corresponding to the Control Del column for clinical data lookup. |
| IDsDupControl | The sample IDs of control subjects corresponding to the Control Dup column for clinical data lookup. |
| StatesDelControl | CN states listed corresponding to IDsDelControl [1 (CN = 0)/2 (CN = 1)]. |
| StatesDupControl | CN states listed corresponding to IDsDupControl [5 (CN = 3)/6 (CN = 4)]. |
| TotalStates(1) | The number of Controls in Controls Del with a homozygous deletion or both copies lost. |
| TotalStates(2) | The number of Controls in Controls Del with a hemizygous deletion or one copy lost. |
| TotalStates(5) | The number of Controls in Controls Dup with a hemizygous duplication or one copy gained. |
| TotalStates(6) | The number of Controls in Controls Dup with a homozygous duplication or two copies gained. |
| ALLTwoTailed | All CNV states considered together P. |
| ORALL | All CNV states considered together OR. |
| ZeroTwoTailed | Only CN = 0 CNV state considered together P. |
| ORZero | Only CN = 0 CNV state considered together OR. |
| OneTwoTailed | Only CN = 1 CNV state considered together P. |
| OROne | Only CN = 1 CNV state considered together OR. |
| ThreeTwoTailed | Only CN = 3 CNV state considered together P. |
| ORThree | Only CN = 3 CNV state considered together OR. |
| FourTwoTailed | Only CN = 4 CNV state considered together P. |
| ORFour | Only CN = 4 CNV state considered together OR. |
| Gene | The closest proximal gene based on UCSC Genes, which includes both RefSeq Genes and Hypothetical Gene transcripts. |
| Distance | The distance from the CNVR to the closest proximal gene annotated. If the value is 0, the CNVR resides directly on the gene. |
| Description | The gene description delimited by ‘/’ for multiple gene transcripts or multiple genes listed. |
| Pathway | Annotated pathway membership of gene with reference compiled from Gene Ontology database, BioCarta database and the Kyoto Encyclopedia of Genes and Genomes (KEGG) database (definition files in GeneRef folder). |
| AverageNumsnpsCaseDel | The average numsnp of CNV calls contributing to Case Del CNVR. Allows for much more informative CNV size (confidence) filtering post hoc. |
| AverageLengthCaseDel | The average length of CNV calls contributing to Case Del CNVR. Allows for much more informative CNV size (confidence) filtering post hoc. |
| CNVRangeCaseDel | Alternative larger CNV Range Case Del definition compared with minimal common overlap definition of CNVR. |
| AverageNumsnpsControlDel | The average numsnp of CNV calls contributing to Control Del CNVR. Allows for much more informative CNV size (confidence) filtering post hoc. |
| AverageLengthControlDel | The average length of CNV calls contributing to Control Del CNVR. Allows for much more informative CNV size (confidence) filtering post hoc. |
| CNVRangeControlDel | Alternative larger CNV Range Control Del definition compared with minimal common overlap definition of CNVR. |
| CNVType | Deletion or duplication CNVR significant in combined report. |
| Cytoband | Cytoband genomic landmark designations. |
| redFlagCount | Count red flag from association review (see text, briefly: Segmental Duplications, Database of Genomic Variants, Centromere/Telomere, GC base content, Probe Count, Population Frequency, Peninsula, Inflated). |
| redFlagReasons | The failing metrics for association review and their values. |
In addition to the main association results file, contributing calls to each association are included for trackability. Contributing calls allow for specific break point assessment of individual samples and clear correlation of relevant raw input (i.e. intensity and genotype state). An UCSC custom track is created for graphical review of individual CNV boundaries to assess CNV overlap profiles (Figure 3). BAF and LRR value files for each CNVR are created with all samples having CNV contributing to association for review of the specific association region across many samples (Supplementary Figure S1). Viewing probe intensity data across multiple cases for an associated region allows for generalization of robust signal qualities of a CNVR in a relatively quick manner. An image is automatically generated showing intensity and genotype raw values evaluated by the CNV calling algorithm delimiting each CNVR and each sample (Supplementary Figure S2). Ped files are created separately for deletion and duplication to allow for additional statistical output in Plink, including quantitative trait association. We define deletion ped: CN = 0 → 1 1, CN = 1 → 1 2, other → 2 2, and duplication ped: CN = 4 → 1 1, CN = 3 → 1 2, other → 2 2, designed from lowest to highest frequency in keeping with Hardy–Weinberg Equilibrium. An accessory function InsertPlinkPvalues allows for Plink generated output files to be imported into ParseCNV for Plink P-value driven CNVR definition. Full SNP-based statistics are generated in ParseCNV to allow for specific locus queries regardless of significance.
Correction of the CNV association statistics for population stratification can be achieved based on the Principal component analysis (PCA) or MDS result. The deletion and duplication CNV peds generated by ParseCNV are run in Plink with PCA/MDS as a covariate for a logistic statistical test. The additive model of population stratification corrected P-values is then imported into ParseCNV using InsertPlinkPvalues.
Uncertainty in CNV calls underlying CNV associations is deeply evaluated by multiple lines of evidence to verify significant results parsed for each significant result, including CNV call overlap profiles, genomic context, number of probes supporting the CNV call and single probe intensities. CNV association results review follows four steps (Figure 1).
First, CNV association review is facilitated by automatic red flag annotations, which can be evaluated more carefully by UCSC track review for spurious association. Many segmental duplications, centromere, telomere, CNV peninsula of common CNV, extreme GC content regions, low-average number of SNPs for CNV calls contributing to association, locus frequently found in diverse studies, >1% population frequency and same sample driving multiple CNV associations are all red flags for evaluation (see ‘Materials and Methods’ section). The number of red flags is scored automatically with their failing metric values provided. We use UCSC reference files, which can be updated or adapted to different genome builds, as instructed.
Second, intensity signal is reviewed for specific association regions across many samples, based on an automatically generated image of BAF and LRR probe values. Deletions are only accepted if they show clear drop in intensity (majority are <0) and lack of heterozygous genotypes (BAF 0, 1). Duplications are similarly accepted only if they show AAB or ABB banding (BAF 0.33, 0.66) and increase in intensity (majority are >0), although the latter is not always clear-cut for duplications, which is the reason duplications are often under called.
Third, probe-based intensity is reviewed for whole-chromosome data of a sample with each associated CNVR and population probe clusters, as done in Illumina GenomeStudio and Affymetrix Genotyping Console. This review establishes clear diploid (CN = 2) signal in flanking regions to limit noise likely to increase bias of false-positive CNV calls. Intensity waves flanking a region with genotype support of CNV can be spotted that represent copy neutral loss of heterozygosity or run of homozygosity, which are often overcalled as a deletion by coinciding intensity waves.
Fourth, qPCR wet laboratory review for confirmation of true-positive and true-negative results is critically important. These steps are done in order of increasing effort per locus but the number of loci will be filtered down by each step, thus providing incremental stringency and re-review to establish confidence. Using ParseCNV with the robust quality tracking and confidence scoring through red flags, our validation success rate has been 90% in studies of autism (22), schizophrenia (23), depression (24), obesity (25), immunodeficiency (26) and attention deficit hyperactivity disorder (ADHD) (27). Here, we present the results of 409 attempted and 367 successful validation assays from 7 disease studies with a range of different genomic loci and CN states (Table 2 and Figure 4). Reviewing the failed loci has led to establishment of the various red flag features presented. Over time, the validation success rate has improved as more rare and subtle red flags were identified and refined. Validation of CNVs with an independent method has remained a standard expectation because of false-positive results. With high-validation success rate because of quality tracking and confidence scoring of known confounders leading to failed validations based on experience, we are confident that the majority of significant loci with good confidence scores can be interpreted for biological relevance to disease without prolonged suspicion of a false-positive CNV call until PCR validation is done.
Table 2.
Quantitative PCR validation of CNVR associations
| Project | Validations attempted | Cases | Control subjects | Loci | Count Del | CN 0 | CN 1 | CN 2 | CN 3 | CN 4 | PCR failed | Validation failed | Success rate |
|---|---|---|---|---|---|---|---|---|---|---|---|---|---|
| Autism | 37 | 2195 | 2519 | 25 | 13 | 0 | 8 | 13 | 13 | 3 | 0 | 4 | 0.89 |
| Schizophrenia | 52 | 1735 | 3485 | 8 | 47 | 14 | 21 | 14 | 3 | 0 | 0 | 10 | 0.81 |
| Obesity | 104 | 2559 | 4075 | 35 | 36 | 0 | 31 | 45 | 27 | 0 | 10 | 5 | 0.95 |
| ADHD | 135 | 3506 | 13 327 | 12 | 57 | 0 | 35 | 56 | 37 | 7 | 7 | 11 | 0.92 |
| AutSczAdhd | 10 | 9 | 1 | 1 | 10 | 0 | 9 | 1 | 0 | 0 | 0 | 0 | 1 |
| OldYoung | 23 | 9392 | 7393 | 23 | 12 | 0 | 9 | 3 | 11 | 0 | 1 | 3 | 0.87 |
| Progressive supranuclear palsy | 48 | 1855 | 6701 | 24 | 38 | 0 | 32 | 9 | 7 | 0 | 4 | 9 | 0.81 |
Figure 4.

Quantitative PCR validation of CNVR associations. Each sample with attempted validation for a specific CNV at a specific locus is shown. The validation data output is 0.5 for deletions, 1 for diploid, 1.5 for duplications with standard error values from triplicate runs.
To provide a simplified demonstration of the file input format and output, we simulated data for four cases and four control subjects with CNV calls derived from 10 probes, which after running ParseCNV results in a one probe CNVR deletion and a three probe CNVR duplication with nominal significance because of the reported ranges being observed in four cases and zero control subjects along with other files for association and CNV signal review (Figure 1).
As an example of a real data set using a case/control publicly available data set, 785 autism cases and 1110 control subjects were assessed with 561 308 probes. PennCNV called cases CN0 = 1 855, CN1 = 19 484, CN3 = 11 393, CN4 = 1060 and control subjects CN0 = 959, CN1 = 10 051, CN3 = 6236, CN4 = 579. ParseCNV detected Del/Dup Probes P < 0.05 Case Enrich: 696/1309 and Del/Dup Probes P < 0.05 Control Enrich: 468/1313. Deletion CNVRs: 103 deletion CNVRs and 59 duplication CNVRs were found (after joining based on 1 MB probe neighbours and ±power of 10 P-value) before selecting the most significant CNVR in tightly clustering regions with varying significance. ParseCNV then condensed these probe-based statistics into 57 deletion and 33 duplication CNVRs with nominal significance. These loci were reviewed with red flag annotations, UCSC, raw intensity and qPCR as previously described, resulting in 7 deletion and 12 duplication CNVRs (22). We used this data set to sample different settings of proximity (1 MB) and significance (±1 power of 10 P-value) (Figure 5). By this sampling procedure, we show these defaults are justifiable based on balancing CNVR extension to allow boundary variability while maintaining unique loci except in rare instances. The rawcnv, fam and map files can be freely downloaded from http://parsecnv.sourceforge.net/ to replicate the analysis.
Figure 5.
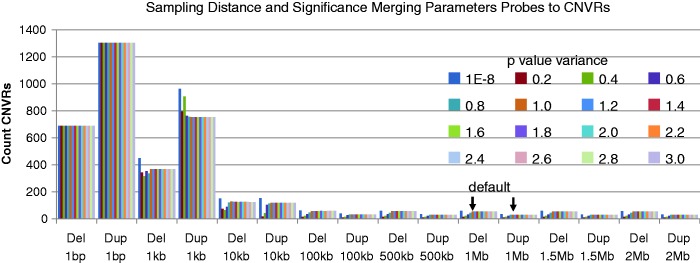
Sampling of different settings of distance (1 MB) and significance (±1 power of 10 P-value). Based on 785 cases versus 1110 control subjects and 561 308 probes data set. By this sampling procedure, we show these defaults are justifiable based on balancing CNVR extension to allow boundary variability while maintaining unique loci, except in rare instances. The x-axis shows the CNVR typed and distance setting. The colour shows the P-value variance setting. The y-axis shows the count CNVRs resulting from these settings.
To further emphasize the unique output features of ParseCNV, we ran Plink on the same data set. Plink detected the same number of cases and controls at each probe and calculated correlating statistical significance (not the same, as ParseCNV uses Fisher exact test, and Plink uses permutation, Supplementary Figure S3). However, CNVRs were not called by Plink; hence, part of ParseCNV was used to reduce redundancy in the Plink result. Four deletion CNVRs and four duplication CNVRs were missed (not significant, P > 0.09) by Plink because of the assessment of all CNV states together, whereas the opposite state was enriched in control subjects (Figure 6). All CNVRs called via Plink statistics were also significant in ParseCNV results. Plink found 92 combined CNV state groups of probes, which were called as CNVRs by a ParseCNV component script. With combined CNV state statistics in ParseCNV, 79 CNVRs resulted. Highly significant P-values using Fisher’s exact test were more constrained with permutation, whereas marginally significant with control frequency using permutation were more constrained with Fisher’s exact test (i.e. 5:1 case:control). Overall, the counts of CNV per probe match exactly, and the P-values correlate highly between ParseCNV and Plink, providing independent validation of correctness (Supplementary Figure S3). However, the lack of CNVR calling and quality tracking in Plink makes for a strong contrast of Plink with ParseCNV.
Figure 6.

Increased frequency of specific CNV state in cases. chr14:104241048–104348254 4:0 (case:control) deletions 2:11 duplications 6:11 combined ParseCNV provides case enriched deletion significance for this region P = 0.03 (duplication control enriched P = 0.09). As Plink only uses combined count definition, the P = 1 and the region is missed. chr11:133663955–133715739 1:3 deletions 5:0 duplications 6:3 combined ParseCNV provides case enriched duplication significance for this region P = 0.01 (deletion control enriched P = 0.65). As Plink only uses combined count definition, the P = 0.12 and the region is missed.
When families are available, inheritance rates of CNVs can improve confidence of CNV calls. De novo events should show consistent parent of origin across genotypes of a given CNV. Trio and joint family based CNV calling procedures in PennCNV can further improve the de novo rate (28). Such metrics can be developed by retrospective evaluation of raw data contributing to false-positive associations and failing PCR validation. Waviness of the intensity data can be ameliorated using the GC wave correction model options (29). Individual CNV call quality metrics include confidence score, number of probes contributing to CNV call and physical CNV size. CNV call filtering may create false association by encountering a locus with control boundary truncation just under the threshold, whereas case calls were just above. If multiple versions or platforms are being used with different probe sets, filtering for the intersection set before CNV calling is recommended. If overlap is minimal between different platforms, a discovery phase with the largest subset can be done with replication in other subsets using all probes available on the chip. ParseCNV has the flexibility of handling multiple different input files and is optimized to handle CNV heterogeneity.
In conclusion, the above referenced probe resolution statistics and dynamic CNVR definition applied in ParseCNV will become increasingly important as the number of CNVs identified in each individual, and the resolution of variable CNV boundaries expands in dense probe arrays and sequencing. With this increased resolution comes additional multiple testing burden, although multiple probes are needed to call a given CNV and many probes may not detect any CNVs (conservative standard is P < 5 × 10⁻⁴ [(22); see ‘Materials and Methods’ section). Assessment of CNVs across the genome has continued to improve (30–35). Recent reports of the extent of discordance between different arrays and CNV calling algorithms have been published (17). This can be readily seen in the DGV entries with widely disparate CNV frequencies across different healthy populations. This is why large cohorts of cases and control subjects typed at a single facility are important with full tracking of quality metrics for each CNVR provided by ParseCNV rather than simply probe-based significance values. Success frequency of qPCR CNV validation has continued to improve by association signal review enabled by ParseCNV.
ETHICS STATEMENT
This research was approved by the Institutional Review Board of the Children’s Hospital of Philadelphia in compliance with the Helsinki Declaration.
CONSENT STATEMENT
All subjects were recruited with signed written informed consent if aged ≥18 years. Parents signed written consent on the behalf of minors/children aged 0–17 years, and the child signed a written assent if aged 7–17 years.
SUPPLEMENTARY DATA
Supplementary Data are available at NAR Online: Supplementary Figures 1–3, Supplementary Methods and Supplementary Reference [36].
FUNDING
Institutional Development Award to the Center for Applied Genomics from The Children’s Hospital of Philadelphia (in part); Adele and Daniel Kubert donation; University of Pennsylvania Biomedical Graduate Studies; Cotswold foundation. Funding for open access charge: Cotswold foundation.
Conflict of interest statement. None declared.
Supplementary Material
ACKNOWLEDGEMENTS
The authors are most grateful for the patients and their families who contributed samples to this study. They thank Nagahide Takahashi, Takeshi Sakurai, Joseph Buxbaum, Renata Pellegrino and Saarene Panossian for designing and performing CNV validation experiments. They thank Kai Wang and Sharon Diskin for helpful discussions. J.T.G. performed analysis and wrote software. H.H. designed the study. J.T.G. and H.H. wrote the manuscript. J.L. provided valuable user feedback, ideas and bug reports.
REFERENCES
- 1.Lee JA, Lupski JR. Genomic rearrangements and gene copy-number alterations as a cause of nervous system disorders. Neuron. 2006;52:103–121. doi: 10.1016/j.neuron.2006.09.027. [DOI] [PubMed] [Google Scholar]
- 2.Girirajan S, Campbell CD, Eichler EE. Human copy number variation and complex genetic disease. Annu. Rev. Genet. 2011;45:203–226. doi: 10.1146/annurev-genet-102209-163544. [DOI] [PMC free article] [PubMed] [Google Scholar]
- 3.Conrad DF, Andrews TD, Carter NP, Hurles ME, Pritchard JK. A high resolution survey of deletion polymorphism in the human genome. Nat. Genet. 2006;38:75–81. doi: 10.1038/ng1697. [DOI] [PubMed] [Google Scholar]
- 4.Peiffer DA, Le JM, Steemers FJ, Chang W, Jenniges T, Garcia F, Haden K, Li J, Shaw CA, Belmont J, et al. High-resolution genomic profiling of chromosomal aberrations using Infinium whole-genome genotyping. Genome Res. 2006;16:1136–1148. doi: 10.1101/gr.5402306. [DOI] [PMC free article] [PubMed] [Google Scholar]
- 5.Wang K, Li M, Hadley D, Liu R, Glessner J, Grant SF, Hakonarson H, Bucan M. PennCNV: an integrated hidden Markov model designed for high-resolution copy number variation detection in whole-genome SNP genotyping data. Genome Res. 2007;17:1665–1674. doi: 10.1101/gr.6861907. [DOI] [PMC free article] [PubMed] [Google Scholar]
- 6.Colella S, Yau C, Taylor JM, Mirza G, Butler H, Clouston P, Bassett AS, Seller A, Holmes CC, Ragoussis J. QuantiSNP: an Objective Bayes Hidden-Markov Model to detect and accurately map copy number variation using SNP genotyping data. Nucleic Acids Res. 2007;35:2013–2025. doi: 10.1093/nar/gkm076. [DOI] [PMC free article] [PubMed] [Google Scholar]
- 7.Cardin N, Holmes C, Wellcome Trust Case Control Consortium. Donnelly P, Marchini J. Bayesian hierarchical mixture modeling to assign copy number from a targeted CNV array. Genet. Epidemiol. 2011;35:536–548. doi: 10.1002/gepi.20604. [DOI] [PMC free article] [PubMed] [Google Scholar]
- 8.Chen PA, Liu HF, Chao KM. CNVDetector: locating copy number variations using array CGH data. Bioinformatics. 2008;24:2773–2775. doi: 10.1093/bioinformatics/btn517. [DOI] [PubMed] [Google Scholar]
- 9.van de Wiel MA, Kim KI, Vosse SJ, van Wieringen WN, Wilting SM, Ylstra B. CGHcall: calling aberrations for array CGH tumor profiles. Bioinformatics. 2007;23:892–894. doi: 10.1093/bioinformatics/btm030. [DOI] [PubMed] [Google Scholar]
- 10.Xie C, Tammi MT. CNV-seq, a new method to detect copy number variation using high-throughput sequencing. BMC Bioinformatics. 2009;10:80. doi: 10.1186/1471-2105-10-80. [DOI] [PMC free article] [PubMed] [Google Scholar]
- 11.Barnes C, Plagnol V, Fitzgerald T, Redon R, Marchini J, Clayton D, Hurles ME. A robust statistical method for case-control association testing with Copy Number Variation. Nat. Genet. 2008;40:1245–1252. doi: 10.1038/ng.206. [DOI] [PMC free article] [PubMed] [Google Scholar]
- 12.Korn JM, Kuruvilla FG, McCarroll SA, Wysoker A, Nemesh J, Cawley S, Hubbell E, Veitch J, Collins PJ, Darvishi K, et al. Integrated genotype calling and association analysis of SNPs, common copy number polymorphisms and rare CNVs. Nat. Genet. 2008;40:1253–1260. doi: 10.1038/ng.237. [DOI] [PMC free article] [PubMed] [Google Scholar]
- 13.Purcell S, Neale B, Todd-Brown K, Thomas L, Ferreira MAR, Bender D, Maller J, Sklar P, de Bakker PIW, Daly MJ, et al. PLINK: a toolset for whole-genome association and population-based linkage analysis. Am. J. Hum. Genet. 2007;81:559–575. doi: 10.1086/519795. [DOI] [PMC free article] [PubMed] [Google Scholar]
- 14.Subirana I, Diaz-Uriarte R, Lucas G, Gonzalez JR. CNVassoc: association analysis of CNV data using R. BMC Med. Genomics. 2011;4:47. doi: 10.1186/1755-8794-4-47. [DOI] [PMC free article] [PubMed] [Google Scholar]
- 15.Price AL, Patterson NJ, Plenge RM, Weinblatt ME, Shadick NA, Reich D. Principal components analysis corrects for stratification in genome-wide association studies. Nat. Genet. 2006;38:904–909. doi: 10.1038/ng1847. [DOI] [PubMed] [Google Scholar]
- 16.Li Q, Yu K. Improved correction for population stratification in genomewide association studies by identifying hidden population structures. Genet. Epid. 2008;32:215–226. doi: 10.1002/gepi.20296. [DOI] [PubMed] [Google Scholar]
- 17.Pinto D, Darvishi K, Shi X, Rajan D, Rigler D, Fitzgerald T, Lionel AC, Thiruvahindrapuram B, Macdonald JR, Mills R, et al. Comprehensive assessment of array-based platforms and calling algorithms for detection of copy number variants. Nat. Biotechnol. 2011;29:512–520. doi: 10.1038/nbt.1852. [DOI] [PMC free article] [PubMed] [Google Scholar]
- 18.Fisher RA. Statistical Methods for Research Workers. Edinburgh: Oliver and Boyd; 1954. ISBN 0050021702. [Google Scholar]
- 19.Sharp AJ, Locke DP, McGrath SD, Cheng Z, Bailey JA, Vallente RU, Pertz LM, Clark RA, Schwartz S, Segraves R, et al. Segmental duplications and copy-number variation in the human genome. Am. J. Hum. Genet. 2005;77:78–88. doi: 10.1086/431652. [DOI] [PMC free article] [PubMed] [Google Scholar]
- 20.Zhang J, Feuk L, Duggan GE, Khaja R, Scherer SW. Development of bioinformatics resources for display and analysis of copy number and other structural variants in the human genome. Cytogenet. Genome Res. 2006;115:205–214. doi: 10.1159/000095916. [DOI] [PubMed] [Google Scholar]
- 21.Lefranc MP, Rabbitts TH. Two tandemly organized human genes encoding the T-cell gamma constant-region sequences show multiple rearrangement in different T-cell types. Nature. 1985;316:464–466. doi: 10.1038/316464a0. [DOI] [PubMed] [Google Scholar]
- 22.Glessner JT, Wang K, Cai G, Korvatska O, Kim CE, Wood S, Zhang H, Estes A, Brune CW, Bradfield JP, et al. Autism genome-wide copy number variation reveals ubiquitin and neuronal genes. Nature. 2009;459:569–573. doi: 10.1038/nature07953. [DOI] [PMC free article] [PubMed] [Google Scholar]
- 23.Glessner JT, Reilly MP, Kim CE, Takahashi N, Albano A, Hou C, Bradfield JP, Zhang H, Sleiman PM, Flory JH, et al. Strong synaptic transmission impact by copy number variations in schizophrenia. Proc. Natl Acad. Sci. USA. 2010;107:10584–10589. doi: 10.1073/pnas.1000274107. [DOI] [PMC free article] [PubMed] [Google Scholar]
- 24.Glessner JT, Wang K, Sleiman PM, Zhang H, Kim CE, Flory JH, Bradfield JP, Imielinski M, Frackelton EC, Qiu H, et al. Duplication of the SLIT3 locus on 5q35.1 predisposes to major depressive disorder. PLoS One. 2010;5:e15463. doi: 10.1371/journal.pone.0015463. [DOI] [PMC free article] [PubMed] [Google Scholar]
- 25.Glessner JT, Bradfield JP, Wang K, Takahashi N, Zhang H, Sleiman PM, Mentch FD, Kim CE, Hou C, Thomas KA, et al. A genome-wide study reveals copy number variants exclusive to childhood obesity cases. Am. J. Hum. Genet. 2010;87:661–666. doi: 10.1016/j.ajhg.2010.09.014. [DOI] [PMC free article] [PubMed] [Google Scholar]
- 26.Orange JS, Glessner JT, Resnick E, Sullivan KE, Lucas M, Ferry B, Kim CE, Hou C, Wang F, Chiavacci R, et al. Genome-wide association identifies diverse causes of common variable immunodeficiency. J. Allergy Clin. Immunol. 2011;127:1360–1367. doi: 10.1016/j.jaci.2011.02.039. [DOI] [PMC free article] [PubMed] [Google Scholar]
- 27.Elia J, Glessner JT, Wang K, Takahashi N, Shtir CJ, Hadley D, Sleiman PM, Zhang H, Kim CE, Robison R, et al. Genome-wide copy number variation study associates metabotropic glutamate receptor gene networks with attention deficit hyperactivity disorder. Nat. Genet. 2011;44:78–84. doi: 10.1038/ng.1013. [DOI] [PMC free article] [PubMed] [Google Scholar]
- 28.Wang K, Chen Z, Tadesse MG, Glessner J, Grant SF, Hakonarson H, Bucan M, Li M. Modeling genetic inheritance of copy number variations. Nucleic Acids Res. 2008;36:e138. doi: 10.1093/nar/gkn641. [DOI] [PMC free article] [PubMed] [Google Scholar]
- 29.Diskin SJ, Li M, Hou C, Yang S, Glessner J, Hakonarson H, Bucan M, Maris JM, Wang K. Adjustment of genomic waves in signal intensities from whole-genome SNP genotyping platforms. Nucleic Acids Res. 2008;36:e126. doi: 10.1093/nar/gkn556. [DOI] [PMC free article] [PubMed] [Google Scholar]
- 30.Iafrate AJ, Feuk L, Rivera MN, Listewnik ML, Donahoe PK, Qi Y, Scherer SW, Lee C. Detection of large-scale variation in the human genome. Nat. Genet. 2004;36:949–951. doi: 10.1038/ng1416. [DOI] [PubMed] [Google Scholar]
- 31.McCarroll SA, Kuruvilla FG, Korn JM, Cawley S, Nemesh J, Wysoker A, Shapero MH, de Bakker PI, Maller JB, Kirby A, et al. Integrated detection and population-genetic analysis of SNPs and copy number variation. Nat. Genet. 2008;40:1166–1174. doi: 10.1038/ng.238. [DOI] [PubMed] [Google Scholar]
- 32.Rueda OM, Diaz-Uriarte R. RJaCGH: Bayesian analysis of aCGH arrays for detecting copy number changes and recurrent regions. Bioinformatics. 2009;25:1959–1960. doi: 10.1093/bioinformatics/btp307. [DOI] [PMC free article] [PubMed] [Google Scholar]
- 33.Kim JH, Hu HJ, Yim SH, Bae JS, Kim SY, Chung YJ. CNVRuler: a copy number variation-based case-control association analysis tool. Bioinformatics. 2012;28:1790–1792. doi: 10.1093/bioinformatics/bts239. [DOI] [PubMed] [Google Scholar]
- 34.Forer L, Schönherr S, Weissensteiner H, Haider F, Kluckner T, Gieger C, Wichmann HE, Specht G, Kronenberg F, Kloss-Brandstätter A. CONAN: copy number variation analysis software for genome-wide association studies. BMC Bioinformatics. 2010;11:318. doi: 10.1186/1471-2105-11-318. [DOI] [PMC free article] [PubMed] [Google Scholar]
- 35.Gai X, Perin JC, Murphy K, O'Hara R, D'arcy M, Wenocur A, Xie HM, Rappaport EF, Shaikh TH, White PS. CNV Workshop: an integrated platform for high-throughput copy number variation discovery and clinical diagnostics. BMC Bioinformatics. 2010;11:74. doi: 10.1186/1471-2105-11-74. [DOI] [PMC free article] [PubMed] [Google Scholar]
- 36.Wu Z, Zhao H. Statistical power of model selection strategies for genome-wide association studies. PLoS Genet. 2009;5:e1000582. doi: 10.1371/journal.pgen.1000582. [DOI] [PMC free article] [PubMed] [Google Scholar]
Associated Data
This section collects any data citations, data availability statements, or supplementary materials included in this article.