Abstract
The normal breast tissue responds to the fluctuation of endogenous hormones during a menstrual cycle (MC) and shows changes in breast density. The changes between left and right breasts of the same women were compared to evaluate the symmetrical response. Twenty-four healthy women were recruited in this study. Four weekly magnetic resonance imaging (MRI) studies were performed during one menstrual cycle. A computer algorithm was used to segment the breast and the fibroglandular tissue to measure the fibroglandular tissue volume (FV) and three morphological parameters: circularity, convexity, and irregularity. The coefficient of variation (CV) for each parameter measured among 4 MRI studies was calculated; also the maximal percent change between two MRI studies that show the highest and the lowest FV was calculated. These parameters measured from left and right breasts were compared using Pearson’s correlation.
For the fibroglandular tissue volume, the coefficient of variation measured between left and right breasts of 24 subjects were highly correlated, with r=0.91; the maximal percent difference was also highly correlated, with r=0.93. Overall, the mean left-to-right difference in the measured FV was small, 1.2 ± 1.1 % for CV, and 2.6 ± 2.3 % for the maximal percent difference. For the three morphological parameters, the mean left-to-right percentage difference was similar to the differences seen in FV; however, these morphological parameters do not reveal a high functional symmetry between left and right breasts. The results showed that the measured fibroglandular tissue volume from left and right breasts of the same woman revealed a high functional symmetry. Since endogenous hormone plays an important role in the development of breast cancer, it would be interesting to investigate whether the functional asymmetry of response in some patients is associated with the risk of developing unilateral breast cancer.
INTRODUCTION
The bilateral breasts of a woman are usually considered symmetrical. Breast asymmetry, however, does happen in some women. Morphologically, breast asymmetry is defined as a difference of the form, position or volume between left and right breasts of the same woman. The asymmetry may be caused by embryological, hormonal, or idiopathic factors; but it can also result from other conditions such as the presence of lesions (benign and malignant), trauma, infection, or surgery [1]. Therefore, asymmetry can be used for detection of abnormal disease on imaging [2–8]. Early signs of breast cancer including the presence of micro-calcifications and the asymmetric densities and parenchymal distortion can be evaluated by comparing the mammograms taken from left and right breasts [9].
Breast density may change with the secretion of hormones such as estrogen [10]. In premenopausal women, the normal breast tissue responds to the fluctuation of endogenous hormones during the menstrual cycle (MC) and shows structural and morphological alterations [11]. Studies have also shown that women with evenly shaped breasts may exhibit shape and size disparities after pregnancy and lactation when the hormonal status is changed [1]. The small asymmetry caused by the hormonal factors between bilateral breasts is termed “fluctuating asymmetry”, which is a measure of “disruptive” developmental stability [12]. Some women may tolerate the hormonal variation well and maintain the breast developmental stability; but others may not and they are more likely to show fluctuating asymmetry. Most breast cancer is unilateral, and the disruptive developmental stability or fluctuating asymmetry between left and right breasts may be related to disease predisposition in one breast [12].
The histological changes of fibroglandular tissue during a menstrual cycle can be assessed by imaging. Previous mammography and MRI studies have focused on the difference of breast density between follicular and luteal phase [13, 14], mainly for investigating their influence on cancer detection and the optimal timing to image patients. To date, there has not been any published study to report the functional response between bilateral breasts to hormonal changes. In a previous study the fluctuation of breast density during MC using four weekly MRI studies done in a cycle was investigated [15]. The acquired data could be further analyzed to investigate the symmetrical response between bilateral breasts. In addition to the fibroglandular tissue volume, we also analyzed the change of the morphological patterns using three quantitative parameters, circularity, convexity, and irregularity. Recent studies have found that breast parenchymal patterns, similar to breast density, are also related to breast cancer risk [16–20]. The purpose of this study is to investigate and compare the functional symmetry of these density parameters between left and right breasts of healthy women responding to the change of endogenous hormonal fluctuations during a menstrual cycle using 3D breast MRI.
MATERIALS and METHODS
Subjects
Twenty-four premenopausal Asian women (age range 23–48, mean 29 y/o) were studied. At the time of participation in this study all subjects were healthy and without any breast related symptoms. The BMI were low, in a narrow range from 17.2 to 25.8 (mean 20.6 ± STD 2.1). They had regular menstrual cycles and were not pregnant at the time of this study. Each woman kept a diary to record the length of their menstrual cycles. One post-menopausal woman had a history of taking hormonal therapy, but had ceased the treatment for 6 months. None was taking contraceptive pills nor receiving hormonal therapy. None had smoking history. This study was approved by the Institutional Review Board and was HIPAA-compliant. All subjects provided written informed consent.
MR Imaging Acquisition
Breast MRI was performed on a 1.5T MR scanner (Siemens, Somatom, Erlangen, Germany) with a 4-channel dual mode breast coil, once a week for 4 consecutive weeks. The first MRI (MRI-1) was done after the start of menstruation as reported by the subject. The scans MRI-2, MRI-3, and MRI-4 were performed in the following 3 weeks in sequence. According to the timing of the MR scanning related to the menstruation, MRI-1 and MRI-2 were more likely in the follicular phase, and MRI-3 and MRI-4 were in luteal phase. Since the purpose of this study was only to characterize the density and morphology change of the breast tissue and not to diagnose breast lesions, the MR studies were performed without the injection of contrast agent. The T1-weighted images acquired using the 3D non-fat-suppressed gradient echo pulse sequence were used for measurements of density and for characterization of breast morphology. The imaging parameters were field of view (FOV)=350 mm, slice thickness=2 mm, repetition time (TR)/ echo time (TE)=11/4.7 msec, flip angle=20 degrees, and matrix size 256×256.
Imaging Analysis
Breast and Fibroglandular Tissue Segmentation
A computer-based algorithm [21, 22] was used for the segmentation of the breast region and the fibroglandular tissue. The training procedure to reach a high intra-operator consistency of < 5% variation, and the inter-operator consistency, were reported before [23]. Using this method, the inter-operator variation was around 3% for breast volume (BV), and 6% for fibroglandular tissue volume (FV) and percent density (PD) [23]. The effect of repositioning of the breast caused about 3–4% of measurement variation [22]. An iterative scheme utilizing the combination of nonparametric nonuniformity normalization (N3) and Fuzzy-C-Means (FCM)-based algorithms (noted as N3+FCM) was used for the bias-field correction [21]. The main segmentation procedures include: 1) Perform a horizontal line along, or posterior to, the posterior margin of the sternum to exclude thoracic region. Depending on the morphology of the breast, the line might be adjusted posteriorly, up to 2.5 cm. This was to ensure that no fibroglandular tissue was inadequately chopped off. Once a new landmark was chosen, it was used for the four breast MR images of the same subject. 2) Apply FCM clustering and b-spline curve fitting to obtain the breast-chest boundary. 3) Apply dynamic searching to exclude the skin of the breast. 4) Apply N3+FCM algorithm to correct the intensity nonuniformity for the segmentation of fibroglandular tissue and fatty tissue. 5) Apply standard FCM algorithm to classify all pixels on the image into 6 clusters; 3 as fibroglandular tissues and the other 3 as fatty tissues. 6) Perform a vertical line perpendicular to the sternum in the middle to separate between left and right breasts. After completing the segmentation from all imaging slices, the total fibroglandular tissue volume (FV) is calculated for left and right breasts separately.
We used the FCM clustering algorithm to segment the fibroglandular and fatty tissues within the breast, and the default setting is N=6, 3 for fibroglandular and 3 for fatty tissues. In our first methodology paper [22] we have used different cluster numbers and evaluated the differences in the obtained segmentation results. If the total number is too small, it may not be sufficient to achieve accurate tissue separation; if the number is too large, it will led to a high measurement variation. In the recent 3 years we have applied this method to many other studies and found that using N=6, 3 for fibroglandular and 3 for fatty tissues, is the optimal setting that can achieve satisfactory results in many different types of MR images acquired using different pulse sequences and different scanners. After the segmentation is done, the results will be inspected, and if necessary, the operator may change the cluster number. However, knowing that changing the cluster number will lead to substantially different results, this is only used as the last option when it is absolutely required.
Overall, the computer-algorithm based method could achieve a high segmentation quality. The method, however, requires some operator intervention, and this is the source of inter-operator variation. The superior, inferior, and posterior boundaries of the breast need to be defined by the operator, and this may lead to different measurements of BV. The choice of different numbers of FCM clusters used in fibroglandular tissue segmentation and the methods used to correct the erroneous segmentation may affect the measured FV.
Characterization of 3D Morphological Parameters
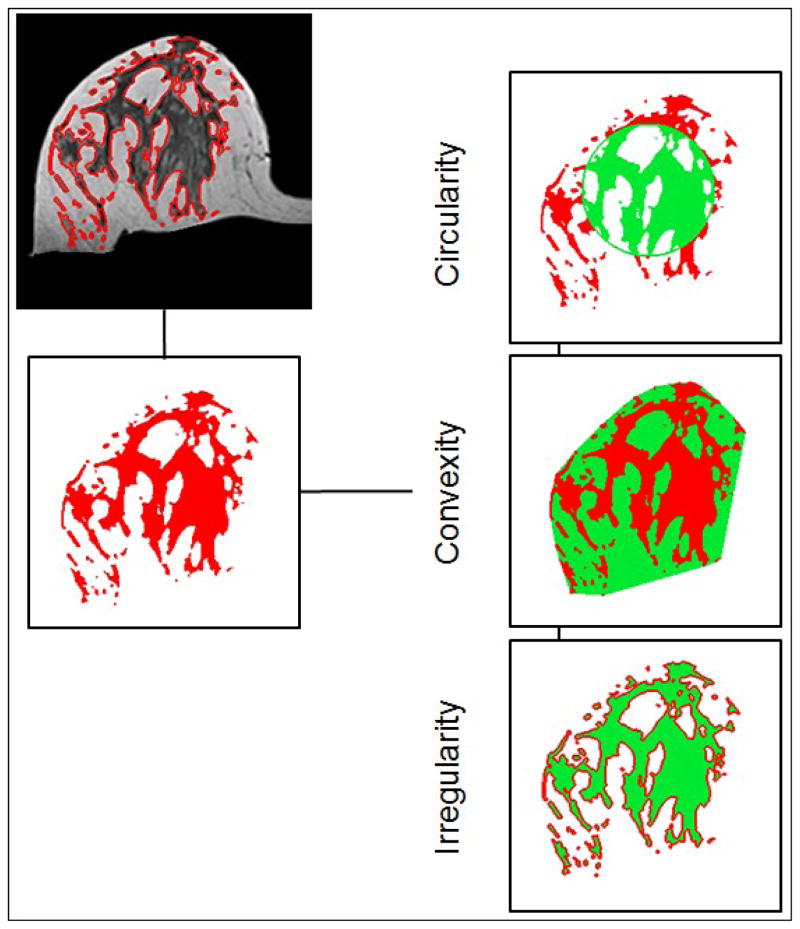
The segmented fibroglandular tissue was also used for the morphological analysis. Three parameters, including circularity, convexity, and irregularity, were analyzed [24] to quantify the three dimensional spatial distribution of the fibroglandular tissue within the breast (examples shown in Figure 1). In fact, previously we have also performed texture analysis using gray level co-occurrence matrix and Laws texture features on MR images, but found them inferior to the morphology analysis reported here to differentiate between two different breast morphologies, intermingled breast and central type breast [24]. The segmented fibroglandular tissue on each imaging slice was reconstructed into a 3-dimensional object, and then the three morphological parameters were calculated as:
Figure 1.
Illustrations of the three breast morphological parameters measured in 3D MRI. The segmented fibroglandular tissue on each imaging slice was reconstructed into a 3-dimensional object, and then the three morphological parameters were calculated. These morphological parameters were introduced to quantitatively characterize the fibroglandular tissue distribution in the breast.
“Circularity” is defined as the ratio of the fibroglandular tissue volume inside an equivalent sphere that has the same total FV volume. The center of the sphere is the centroid of the fibroglandular tissue. A perfect sphere has the circularity of 1. The more scattered distribution pattern will have a lower circularity value.
“Convexity” is defined as the ratio of the total fibroglandular tissue to the outside convex hull which completely wraps it. Same as circularity, a perfect sphere will have a convexity of 1, and the more scattered distribution pattern will have a lower convexity value.
irregularity is define as ( ) where Deff is the radius of the equivalent sphere used in calculating the circularity and S is the surface area. A perfect sphere will have the irregularity of 0, and the more scattered distribution pattern will have a higher irregularity value up to the maximum of 1.
Statistical Analysis
The fluctuation of each measured parameter among the four MR studies (considered as the response to the change of endogenous hormones during a menstrual cycle) was evaluated using the coefficient of variation (CV), defined as the ratio of the standard deviation over the mean value. A higher CV indicated a higher fluctuation over the 4 measurements. In addition, two MRI studies that had the highest fibroglandular tissue volume (more likely in luteal phase from Week-3 and Week-4) and the lowest FV (more likely in follicular phase from Week-1 and Week-2) were selected to calculate the maximal percent difference. Studies of breast cell proliferate activity have shown that most proliferative activity takes place during the luteal phase of the menstrual cycle [25]. The higher cellular proliferation may account for the increased breast density in the luteal phase. These two selected MRI studies were also used to calculate the maximal percent difference for the three morphological parameters. The CV and the maximal percent difference of each parameter measured from left and right breasts of all 24 subjects were compared using the Pearson’s correlation. |r|≥0.7 indicates a strong correlation; 0.7>|r|≥0.3 indicates a weak correlation; and |r|<0.3 indicates little or no correlation. The left-to-right difference was also calculated to indicate the degree of functional symmetry, which was calculated as the absolute value of the difference in the CV or the maximal percent difference measured from left and right breasts of the same woman.
RESULTS
Functional Symmetry of Fibroglandular Tissue Volume
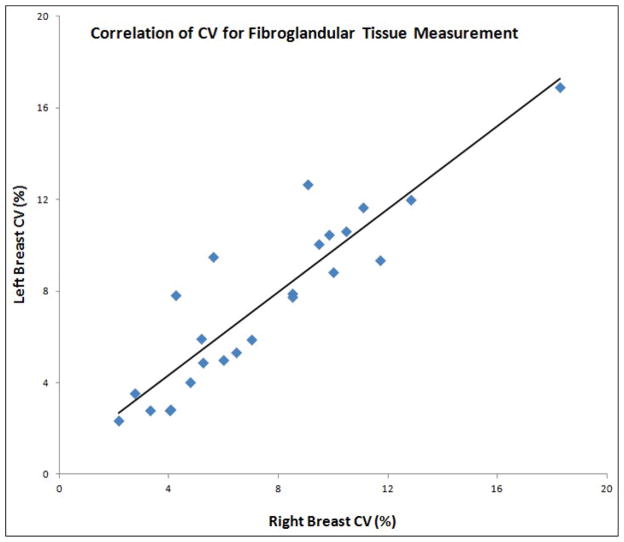
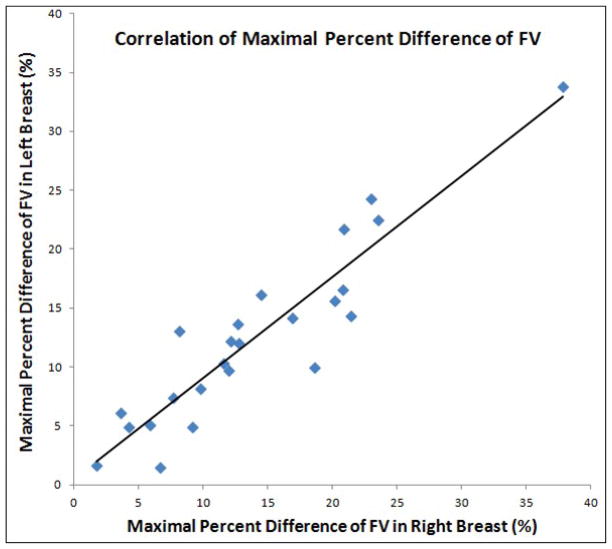
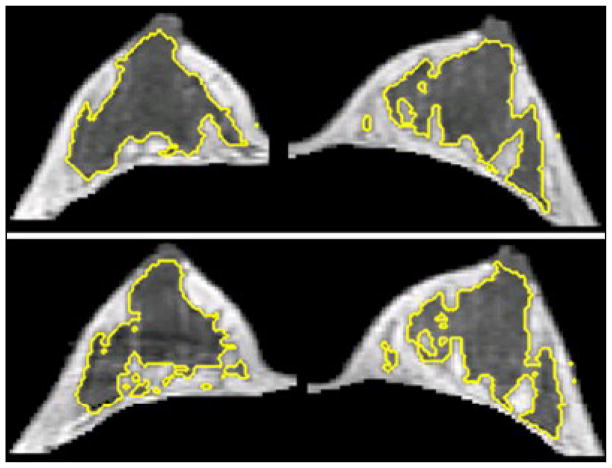
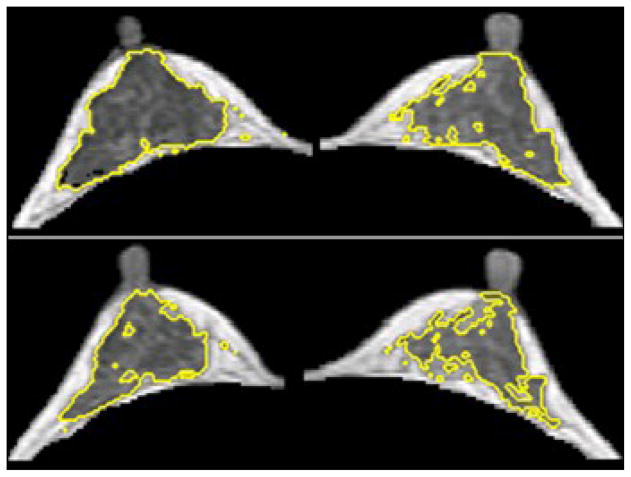
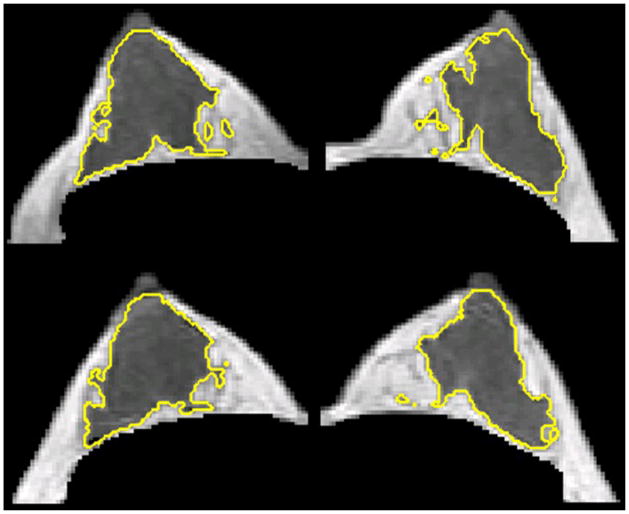
The mean values of FV from 48 breasts measured in each of the four MRI studies are summarized in Table 1. Functional symmetry was defined as the fluctuation of parameters measured between left and right breasts responding to the change of endogenous hormones during a menstrual cycle. The CV of FV measured from left and right breasts were highly correlated, with r=0.91 (Figure 2). The range and the mean ± standard deviation of CV for FV measured from left and right breasts, as well as the left-to-right difference, are listed in Table 2. The mean CV was 7.5% for left breast, also 7.5% for right breast, and the mean left-to-right difference is relatively small, 1.2 ± 1.1 %. Figure 3 shows the correlation of the maximal percent difference of FV measured from left and right breasts. The correlation coefficient (r) was 0.93. Table 3 lists the results for the maximal percent difference. Three case examples are illustrated. Figure 4 illustrates a symmetrical example from a subject showing a small FV fluctuation during MC. The maximal percent difference is 4.9% for left breast and 4.2 % for right breast, showing a relative difference of 15% between them. Figure 5 illustrates another symmetrical example, with a large FV fluctuation. The maximal percent difference is 33.8% for left breast and 37.8 % for right breast, showing a relative difference of 11% between them. Figure 6 illustrates an asymmetrical case. The maximal percent difference of FV is 10.0% for left breast and 18.6% for right breast, thus showing a relative difference of 60% between left and right breasts.
Table 1.
Mean and standard deviation of the measured fibroglandular tissue volume and morphological parameters from left and right breasts of 24 subjects
| Week-1 | Week-2 | Week-3 | Week-4 | mean CV | ||
|---|---|---|---|---|---|---|
| Fibroglandular Volume (ml) | Left | 46.5 ± 21.9 | 45.4 ± 21.3 | 45.0 ± 22.1 | 48.9 ± 25.9 | 7.5% |
| Right | 49.2 ± 26.8 | 47.8 ± 25.2 | 48.0 ± 26.6 | 51.6 ± 31.0 | 7.5% | |
| Circularity | Left | 0.583 ± 0.055 | 0.598 ± 0.066 | 0.591 ± 0.061 | 0.591 ± 0.062 | 2.1% |
| Right | 0.592 ± 0.056 | 0.605 ± 0.067 | 0.608 ± 0.065 | 0.613 ± 0.066 | 2.9% | |
| Convexity | Left | 0.556 ± 0.080 | 0.569 ± 0.093 | 0.571 ± 0.081 | 0.569 ± 0.078 | 4.1% |
| Right | 0.577 ± 0.063 | 0.590 ± 0.079 | 0.592 ± 0.067 | 0.586 ± 0.070 | 3.2% | |
| Irregularity | Left | 0.696 ± 0.071 | 0.690 ± 0.079 | 0.683 ± 0.080 | 0.688 ± 0.077 | 1.5% |
| Right | 0.688 ± 0.065 | 0.684 ± 0.077 | 0.679 ± 0.073 | 0.681 ± 0.076 | 1.8% |
Figure 2.
Correlation of the CV for the fibroglandular tissue volume measured from left and right breasts.
Table 2.
The coefficient of variation of the measured fibroglandular tissue volume and morphological parameters among 4 MRI studies in a menstrual cycle
| Fibroglandular Volume | Circularity | Convexity | Irregularity | |
|---|---|---|---|---|
| Left breast | ||||
| Range of CV | 2.2 ~ 18.3 % | 0.3 ~ 7.3 % | 0.6 ~ 11.7 % | 0.3 ~ 9.1% |
| Mean CV±STD | 7.5 ± 3.8 % | 2.1 ± 1.6% | 4.1 ± 2.5 % | 1.5 ± 1.8 % |
| Right breast | ||||
| Range of CV | 2.3 ~ 16.9 % | 0.7 ~ 8.1 % | 0.9 ~ 7.5 % | 0.4 ~ 7.7% |
| Mean CV±STD | 7.5 ± 3.8 % | 2.9 ± 1.9 % | 3.2 ± 1.6 % | 1.8 ± 1.6 % |
| Difference between Right and Left breasts | ||||
| Range of difference | 0.1 ~ 3.9 % | 0.1 ~ 4.3 % | 0.4 ~ 8.9 % | 0.0 ~ 2.6% |
| Mean±STD | 1.2 ± 1.1 % | 1.4 ± 1.1 % | 2.3 ± 1.8 % | 0.9 ± 0.8% |
Figure 3.
Correlation of the maximal percent difference for the fibroglandular volume measured from left and right breasts. The maximum difference was calculated from the two MRI studies that have the highest and the lowest FV for each subject.
Table 3.
The maximal percent difference of the measured fibroglandular tissue volume and morphological parameters between 2 MRI studies in a menstrual cycle
| Fibroglandular Volume | Circularity | Convexity | Irregularity | |
|---|---|---|---|---|
| Left breast | ||||
| Range of MPD | 1.5 ~ 33.8 % | 0.1 ~ 24.0 % | 0.5 ~ 27.0 % | 0.3 ~ 9.1% |
| Mean±STD | 12.5 ± 7.6 % | 4.0 ± 5.2 % | 5.2 ± 5.4 % | 1.5 ± 1.8% |
| Right breast | ||||
| Range of MPD | 1.8 ~ 37.8 % | 0.2 ~ 16.5 % | 0.1 ~ 12.0 % | 0.4 ~ 7.7 % |
| Mean±STD | 14.0 ± 8.2 % | 3.5 ± 4.0 % | 3.7 ± 3.3 % | 1.8 ± 1.6% |
| Difference between Right and Left Breasts | ||||
| Range of difference | 0.1 ~ 8.6 % | 0 ~ 12.1 % | 0.1 ~ 25.8 % | 0.0 ~ 8.9% |
| Mean±STD | 2.6 ± 2.3 % | 3.2 ± 3.2 % | 4.4 ± 5.2 % | 2.0 ± 2.4% |
Figure 4.
A 23 y/o woman showing symmetrical fluctuation of FV during her MC between left and right breasts. The maximal percent difference of FV was 4.9% for left breast and 4.2 % for right breast. In the upper panel measured in Week-4, the left/right breast volume were 186.8 / 180.5 ml, and the fibroglandular tissue volume were 32.7 / 30.0 ml. In the lower panel measured in Week-1, the left/right breast volume were 189.1 / 174.4 ml, and the fibroglandular tissue volume were 28.8 / 26.6 ml. Since the maximal percent difference of FV was small for both right and left breast, the change could not be seen visually. Note the right breast is the image in the left side and the left breast is the image in the right side.
Figure 5.
A 45 y/o woman showing symmetrical fluctuation of FV during her MC between left and right breasts. The maximal percent difference of FV was 33.8% for left breast and 37.8 % for right breast. In the upper panel measured in Week-4, the left/right breast volume were 178.5 / 167.7 ml, and the fibroglandular tissue volume were 50.1 / 43.9 ml. In the lower panel measured in Week-2, the left/right breast volume were 147.7 / 148.4 ml, and the fibroglandular tissue volume were 34.2 / 31.2 ml. The amount of fibroglandular volume was apparently smaller on the bottom images compared to the top. Because of the remarkable maximal percent difference of FV for both right and left breast, the change could be seen visually. Note the right breast is the image in the left side and the left breast is the image in the right side.
Figure 6.
A 26 y/o woman showing a higher asymmetrical fluctuation of FV during her MC compared to the cases shown in Figures 4 and 5. The maximal percent difference of FV was 10.0% for left breast and 18.6% for right breast. In the upper panel measured in Week-4, the left/right breast volume were 147.5 / 163.5 ml, and the fibroglandular tissue volume were 38.1 / 39.7 ml. In the lower panel measured in Week-2, the left/right breast volume were 162.4 / 167.0 ml, and the fibroglandular tissue volume were 34.5 / 32.9 ml. Visually, the change of FV was more obvious in right breast than in left breast. Note the right breast is the image in the left side and the left breast is the image in the right side.
Functional Symmetry of Breast Morphological Parameters
The three morphological parameters, Circularity, Convexity, and Irregularity, were calculated for each breast. The mean values from 48 breasts measured in each of the four MRI studies are also summarized in Table 1. Figure 7 illustrates the fluctuation of these three morphological parameters measured from left and right breasts in four MRI studies during the menstrual cycle. The CV among the 4 MRI studies was calculated for each breast, and the mean CV from 48 breasts is also listed in Table 1. The mean CV of these morphological parameters was 1.5%–4.1%, which was smaller compared to the CV of the fibroglandular tissue volume (7.5%). The mean ± standard deviation of the CV measured from left and right breasts, and the left-to-right difference, are listed in Table 2. The mean left-to-right difference calculated from the 24 subjects was 1.2 ± 1.1 % for FV, 1.4 ± 1.1 % for Circularity, 2.3 ± 1.8 % for convexity, and 0.9 ± 0.8 % for irregularity. There was no significant difference among these 4 density parameters. The results for the maximal percent difference are shown in Table 3. The mean left-to-right difference calculated from the 24 subjects was 3.2 ± 3.2 % for circularity, 4.4 ± 5.2 % for convexity, and 2.0 ± 2.4% for irregularity, which were comparable to the difference for FV (2.6 ± 2.3 %). In Pearson’s correlation analysis comparing the CV of morphological parameters measured from left and right breasts, the coefficient was r = 0.60 for circularity, r = 0.10 for convexity, and r = 0.78 for irregularity. The maximal percent difference between left and right breasts were not well correlated, with r = 0.55 for circularity, r = 0.14 for convexity, and r = 0.36 for irregularity. For FV, the coefficient was r=0.91 for CV, and r=0.93 for the maximal percent difference; therefore compared to FV, these morphological parameters did not show a high functional symmetry.
Figure 7.
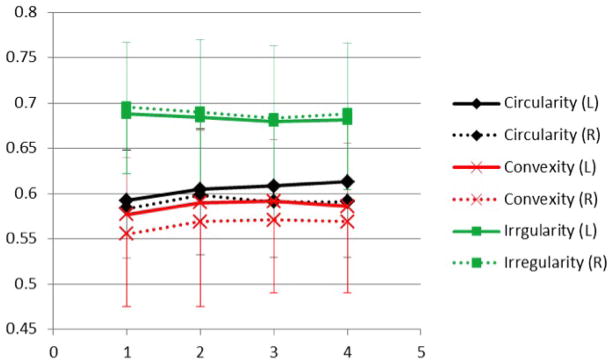
The fluctuation of the three morphological parameters, circularity, convexity, and irregularity, measured weekly during the menstrual cycle. Error bars for each parameter were added.
DISCUSSION
In this study we used 3D MRI to measure the fluctuation of fibroglandular tissue volume and their morphological distribution pattern during the menstrual cycle, and compare the results measured from left and right breasts of the same woman. It is known that the level of circulating hormone changes within a menstrual cycle, and that the breast tissue changes with the hormonal level. In a previous study the fluctuation of breast density within a menstrual cycle was reported [15]. In the present study we further investigated the functional symmetry between left and right breasts responding to the changes of hormones in a cycle.
Evidence from many large screening mammography studies has established the role of mammographic density as an independent risk factor for breast cancer [26–30]. Mammographic density is usually measured as the percent density, defined as the ratio of the area of the dense tissue over the area of the breast. On MRI, we can also measure the percent density as the ratio of the fibroglandular tissue volume normalized to the breast volume. There is increasing evidence suggesting that the key parameter for breast cancer risk may be related more to the absolute amount of dense area than to the percentage of breast density [31–40]; therefore, in the present study we only analyzed the fibroglandular tissue volume. The fibroglandular tissue volume is located inside the breast, and as long as all fibroglandular tissue is included in the segmented breast, it can be measured reliably without being affected by the variation in the measurement of breast volume. Several studies have also analyzed the morphological distribution pattern of the projected dense tissue (texture) on mammograms, and shown differences between women with invasive cancer and women without cancer [16–18]. It was suggested that the mammographic parenchymal pattern measure could serve as an additional risk factor [19]. A very recent study has further found that mammographic texture was independent of density scores and more predictive of risk [20]. Therefore, there is a great interest to investigate the role of texture parameters. However, the mammographic texture is a measure of overlapping tissues projected on mammogram, not revealing genuine 3D distribution information. Breast MRI allows a quantitative measurement of the volume and the morphological distribution pattern of the fibroglandular tissue. In this study we analyzed a total of four parameters: fibroglandular tissue volume, circularity, convexity, and irregularity.
Morphological symmetry of bilateral breasts has been studied before, and the two breasts in a healthy woman are considered symmetrical [2–7]. Asymmetrical difference in mammography may indicate possible abnormalities in one breast. Functional symmetry regarding the response of the two breasts to endogenous hormonal changes is less known. In this study we measured the fluctuation of breast density in a menstrual cycle using 4 weekly MRI studies and compared the results from left and right breasts. The coefficient of variation in the fibroglandular tissue volume were highly correlated with Pearson’s r = 0.91, indicating that the degree of fluctuation during a cycle between the two breasts of the same woman is symmetric. To further understand the changes, we selected two MRI studies, one with the lowest FV in the follicular phase (from Week-1 or Week-2), and the other with the highest FV in the luteal phase (from Week-3 and Week-4), and calculated the difference as the maximal percent change. The maximal percent change measured from left and right breasts is also highly correlated, with Pearson’s r = 0.93. Therefore, these results demonstrate that there is a high functional symmetry between the fibroglandular tissue volumes measured from bilateral breasts.
We also measured the morphological distribution pattern using three quantitative parameters, circularity, convexity and irregularity. The coefficient of variation of these morphological parameters measured from left and right breasts were not highly correlated, with r = 0.60 for circularity, r = 0.10 for convexity, and r = 0.78 for irregularity. The correlation was worse for the maximal percent difference measured between left and right breasts, with r = 0.55 for circularity, r = 0.14 for convexity, and r = 0.36 for irregularity. As shown in Table 1, the CV of these morphological parameters was lower (in the range of 1.5% ~ 4.1 %) compared to the CV of the fibroglandular tissue volume (7.5%). These morphological parameters are defined in the range of 0 to 1, so the dynamic range is very small compared to that of FV. As shown in Figure 7, it can be seen that the parameters measured from the 4 weekly MRI did not change much, and the pattern of the changes between left and right breasts were not symmetric. The results indicate that unlike the fibroglandular tissue volume, the morphological pattern did not show a high functional symmetric change responding to the fluctuation of endogenous hormones within a menstrual cycle. It is likely that there was not a substantial change in the morphological pattern, and these small changes could not be measured reliably due to the small dynamic range of the parameters.
Estrogens are known to be powerful mitotic agents, as well as the stimulators of cell proliferation and growth [3]. There is strong evidence supporting the role of endogenous estrogens in the development of breast cancer [41–44], and based on the evidence the Breast Cancer Preventive Collaboration Group has recommended the inclusion of plasma estrogen level into the risk prediction models [45]. The number of lifetime menstrual cycles from the menarche to the menopause is associated with breast cancer risk [46]. A reduced number of lifetime menstrual cycles, such as through pregnancy (live birth) and breast-feeding, are known to decrease the risk of breast cancer [47]. Findings from the Nurses’ Health Study, which took into account menstrual cycle phase, has suggested that women with high total and free estradiol during the follicular phase are associated with increased risks of breast cancer [48]. However, most breast cancers are unilateral, and the different responses of breast tissue to the systemic estrogen exposure may play a role.
A recent study showed that endogenous hormones affect density in premenopausal women and there is a positive association between estrogen levels and density, which may be involved in the mechanism of breast cancer risk [49]. Since most of the breast cancers occur in the unilateral breast, it will be interesting to investigate whether the long term “uneven” response of bilateral breasts to the endogenous hormonal stimulation may contribute in part to the development of breast cancer. In this study, when all 24 subjects were considered, overall there was a high functional symmetry. However, in some subjects (as the case example illustrated in Figure 6), there was an obvious asymmetrical fluctuation of FV between the two breasts. Whether this functional asymmetry is associated with a high risk of developing breast cancer can be studied in the future. Our results suggest that the difference in the fibroglandular tissue volume measured between the follicular phase and the luteal phase may provide a quantitative risk factor for such studies.
In summary, we have shown that overall there is a high functional symmetry in the change of fibroglandular tissue volume between bilateral breasts of the same woman responding to the fluctuation of endogenous hormones during a menstrual cycle. In contrast, the morphological pattern measured by circularity, convexity and irregularity were not suitable parameters for evaluating the functional symmetry. Since estrogens are known as powerful mitotic agents and endogenous hormone plays an important role in the development of breast cancer, it would be interesting to investigate whether the asymmetrical response between the bilateral breasts to the hormonal fluctuation during MC for a long-term period contributes to the development of unilateral breast cancer. Further study in this research area may also improve our understanding about normal breast physiology and its possible aberrations in women who are at increased risk for cancer.
Acknowledgments
This work was supported in part by NIH/NCI Grant No. R01 CA127927 and R03 CA136071.
LISTS OF ABBREVIATIONS USED
- MC
menstrual cycle
- FV
fibroglandular tissue volume
- CV
coefficient of variation
- MRI
magnetic resonance imaging
- 3D MRI
three dimensional magnetic resonance imaging
- FOV
field of view
- TR
repetition time
- TE
echo time
- N3
nonparametric nonuniformity normalization
- FCM
Fuzzy-C-Means
Footnotes
COMPETING INTERESTS
The authors declare that they have no competing interests.
AUTHORS’CONTRIBUTIONS
JHC designed the case-control study used for this analysis, literature review, interpreted the results, and drafted the manuscript. SC recruited subjects and performed breast MRI studies. DCY recruited subjects and provided clinical information. PTF and ML developed the computer algorithm used in this study, literature review, and did the breast and fibroglandular tissue segmentations. MYS designed the case-control study and interpreted the results. All authors edited the manuscript and approved the final manuscript submitted for publication.
Publisher's Disclaimer: This is a PDF file of an unedited manuscript that has been accepted for publication. As a service to our customers we are providing this early version of the manuscript. The manuscript will undergo copyediting, typesetting, and review of the resulting proof before it is published in its final citable form. Please note that during the production process errors may be discovered which could affect the content, and all legal disclaimers that apply to the journal pertain.
References
- 1.Reilley AF. Breast asymmetry: classification and management. Aesthetic Surg J. 2006;26:596–600. doi: 10.1016/j.asj.2006.07.006. [DOI] [PubMed] [Google Scholar]
- 2.Alterson R, Plewes DB. Bilateral symmetry analysis of breast MRI. Phys Med Biol. 2003;48:3431–3443. doi: 10.1088/0031-9155/48/20/011. [DOI] [PubMed] [Google Scholar]
- 3.Stines J, Tristant H. The normal breast and its variations in mammography. European Journal of Radiology. 2005;54:26–36. doi: 10.1016/j.ejrad.2004.11.017. [DOI] [PubMed] [Google Scholar]
- 4.Venkatesan A, Chu P, Kerlikowske K, Sickles EA, Smith-Bindman R. Positive predictive value of specific mammographic findings according to reader and patient variables. Radiology. 2009;250:648–657. doi: 10.1148/radiol.2503080541. [DOI] [PMC free article] [PubMed] [Google Scholar]
- 5.Wang X, Lederman D, Tan J, Wang XH, Zheng B. Computerized detection of breast tissue asymmetry depicted on bilateral mammograms: a preliminary study of breast risk stratification. Acad Radiol. 2010;17:1234–1241. doi: 10.1016/j.acra.2010.05.016. [DOI] [PMC free article] [PubMed] [Google Scholar]
- 6.Leung JW, Sickles EA. Developing asymmetry identified on mammography: correlation with imaging outcome and pathologic findings. AJR. 2007;188:667–675. doi: 10.2214/AJR.06.0413. [DOI] [PubMed] [Google Scholar]
- 7.Sperber F, Metser U, Gat A, Shalmon A, Yaal-Hahoshen N. Focal asymmetric breast density: mammographic, sonographic and pathological correlation in 97 lesions – a call to restrain biopsies. IMAJ. 2007;9:720–723. [PubMed] [Google Scholar]
- 8.Wang X, Lederman D, Tan J, Wang XH, Zheng B. Computerized prediction of risk for developing breast cancer based on bilateral mammographic breast tissue asymmetry. Med Eng Phys. 2011 Apr 7; doi: 10.1016/j.medengphy.2011.03.001. [Epub ahead of print] [DOI] [PMC free article] [PubMed] [Google Scholar]
- 9.Tang J, Rangayyan RM, Xu J, Naqa IE, Yang Y. Computer-aided detection and diagnosis of breast cancer with mammography: recent advances. IEEE Transactions on information technology in biomedicine. 2009;13:236–251. doi: 10.1109/TITB.2008.2009441. [DOI] [PubMed] [Google Scholar]
- 10.Manning J, Scutt D, Whitehouse G, Leinster S, Walton J. Asymmetry and the menstrual cycle. Ethol Sociobiol. 1996;7:129–143. [Google Scholar]
- 11.Ramakrishnan R, Khan SA, Badve S. Morphological changes in breast tissue with menstrual cycle. Mod Pathol. 2002;15(12):1348–1356. doi: 10.1097/01.MP.0000039566.20817.46. [DOI] [PubMed] [Google Scholar]
- 12.Scutt D, Lancaster GA, Manning JT. Breast asymmetry and predisposition to breast cancer. Breast Cancer Research. 2006;8:R14. doi: 10.1186/bcr1388. [DOI] [PMC free article] [PubMed] [Google Scholar]
- 13.White E, Velentgas P, Mandelson MT, et al. Variation in mammographic breast density by time in menstrual cycle among women aged 40–49 years. J Natl Cancer Inst. 1998;90:906–910. doi: 10.1093/jnci/90.12.906. [DOI] [PubMed] [Google Scholar]
- 14.Graham SJ, Stanchev PL, Lloyd-Smith JO, Bronskill MJ, Plewes DB. Changes in fibroglandular volume and water content of breast tissue during the menstrual cycle observed by MR imaging at 1.5 T. J Magn Reson Imaging. 1995;5:695–701. doi: 10.1002/jmri.1880050613. [DOI] [PubMed] [Google Scholar]
- 15.Hussain Z, Roberts N, Whitehouse GH, García-Fiñana M, Percy D. Estimation of breast volume and its variation during the menstrual cycle using MRI and stereology. Br J Radiol. 1999;72(855):236–245. doi: 10.1259/bjr.72.855.10396212. [DOI] [PubMed] [Google Scholar]
- 16.Li H, Giger LM, Olopade OI, Margolis A, Lan L, Chinander MR. Computerized texture analysis of mammographic parenchymal patterns of digitized mammograms. Acad Radiol. 2005;12:863–873. doi: 10.1016/j.acra.2005.03.069. [DOI] [PubMed] [Google Scholar]
- 17.Huo Z, Giger ML, Olopade OI, et al. Computerized analysis of digitized mammograms of BRCA1 and BRCA2 gene mutation carriers. Radiology. 2002;225:519–526. doi: 10.1148/radiol.2252010845. [DOI] [PubMed] [Google Scholar]
- 18.Wei J, Chan HP, Wu YT, et al. Association of computerized mammographic parenchymal pattern measure with breast cancer risk: a pilot case-control study. Radiology. 2011;260(1):42–49. doi: 10.1148/radiol.11101266. [DOI] [PMC free article] [PubMed] [Google Scholar]
- 19.Manduca A, Carston MJ, Heine JJ, et al. Texture features from mammographic images and risk of breast cancer. Cancer Epidemiol Biomarkers Prev. 2009;18:837–845. doi: 10.1158/1055-9965.EPI-08-0631. [DOI] [PMC free article] [PubMed] [Google Scholar]
- 20.Nielsen M, Karemore G, Loog M, et al. A novel and automatic mammographic texture resemblance marker is an independent risk factor for breast cancer. Cancer Epidemiology. 2011;35:381–387. doi: 10.1016/j.canep.2010.10.011. [DOI] [PubMed] [Google Scholar]
- 21.Lin M, Chan S, Chen JH, et al. A new bias field correction method combining N3 and FCM for improved segmentation of breast density on MRI. Medical Physics. 2011;38(1):5–14. doi: 10.1118/1.3519869. [DOI] [PMC free article] [PubMed] [Google Scholar]
- 22.Nie K, Chen JH, Chan S, et al. Development of a quantitative method for analysis of breast density based on 3-Dimensional breast MRI. Medical Physics. 2008;35(12):5253–5262. doi: 10.1118/1.3002306. [DOI] [PMC free article] [PubMed] [Google Scholar]
- 23.Chan SW, Su MY, Lei FJ, Wu JP, Lin MQ, Nalcioglu O, Stephen F, Chen JH. Menstrual cycle related fluctations in breast density measured by 3D MRI. Radiology. 2011;261(3):744–751. doi: 10.1148/radiol.11110506. [DOI] [PMC free article] [PubMed] [Google Scholar]
- 24.Nie K, Chen JH, Chang D, Hsu CC, Nalcioglu O, Su MY. Quantitative analysis of breast parenchymal patterns using 3D fibroglandular tissue segmentation based on MRI. Medical Physics. 2010;37(1):217–226. doi: 10.1118/1.3271346. [DOI] [PMC free article] [PubMed] [Google Scholar]
- 25.Pike MC, Spicer DV, Dahmoush L, Press MF. Estrogens, progestogens, normal breast cell proliferation, and brgeast cancer risk. Epidemiol Rev. 1993;15:17–35. doi: 10.1093/oxfordjournals.epirev.a036102. [DOI] [PubMed] [Google Scholar]
- 26.Boyd NF, Guo H, Martin LJ, et al. Mammographic density and the risk and detection of breast cancer. N Engl J Med. 2007;356(3):227–236. doi: 10.1056/NEJMoa062790. [DOI] [PubMed] [Google Scholar]
- 27.Vachon CM, Brandt KR, Ghosh K, et al. Mammographic breast density as a general marker of breast cancer risk. Cancer Epidemiol Biomarkers Prev. 2007;16(1):43–49. doi: 10.1158/1055-9965.EPI-06-0738. [DOI] [PubMed] [Google Scholar]
- 28.Boyd NF, Martin LJ, Sun L, et al. Body size, mammographic density, and breast cancer risk. Cancer Epidemiol Biomarkers Prev. 2006;15(11):2086–2092. doi: 10.1158/1055-9965.EPI-06-0345. [DOI] [PubMed] [Google Scholar]
- 29.Ziv E, Shepherd J, Smith-Bindman R, Kerlikowske K. Mammographic breast density and family history of breast cancer. J Natl Cancer Inst. 2003;95(7):556–558. doi: 10.1093/jnci/95.7.556. [DOI] [PubMed] [Google Scholar]
- 30.Yaghjyan L, Colditz GA, Collins LC, Schnitt SJ, Rosner B, Vachon C, Tamimi RM. Mammographic breast density and subsequent risk of breast cancer in postmenopausal women according to tumor characteristics. J Natl Cancer Inst. 2011;103(15):1179–1189. doi: 10.1093/jnci/djr225. [DOI] [PMC free article] [PubMed] [Google Scholar]
- 31.Shepherd JA, Kerlikowske K, Ma L, Duewer F, Fan B, Wang J, Malkov S, Vittinghoff E, Cummings SR. Volume of mammographic density and risk of breast cancer. Cancer Epidemiol Biomarkers Prev. 2011;20(7):1473–1482. doi: 10.1158/1055-9965.EPI-10-1150. [DOI] [PMC free article] [PubMed] [Google Scholar]
- 32.Ursin G, Hovanessian-Larsen L, Parisky YR, et al. Greatly increased occurrence of breast cancers in areas of mammographically dense tissue. Breast Cancer Res. 2005;7(5):R605–R608. doi: 10.1186/bcr1260. [DOI] [PMC free article] [PubMed] [Google Scholar]
- 33.Byrne C, Schairer C, Wolfe J, et al. Mammographic features and breast cancer risk: effects with time, age, and menopause status. J Natl Cancer Inst. 1995;87(21):1622–1629. doi: 10.1093/jnci/87.21.1622. [DOI] [PubMed] [Google Scholar]
- 34.Kato I, Beinart C, Bleich A, et al. A nested case-control study of mammographic patterns, breast volume, and breast cancer (New York City, NY, United States) Cancer Causes Control. 1995;6(5):431–438. doi: 10.1007/BF00052183. [DOI] [PubMed] [Google Scholar]
- 35.Maskarinec G, Meng L. A case-control study of mammographic densities in Hawaii. Breast Cancer Res Treat. 2000;63(2):153–161. doi: 10.1023/a:1006486319848. [DOI] [PubMed] [Google Scholar]
- 36.Torres-Mejía G, De Stavola B, Allen DS, et al. Mammographic features and subsequent risk of breast cancer: a comparison of qualitative and quantitative evaluations in the Guernsey prospective studies. Cancer Epidemiol Biomarkers Prev. 2005;14(5):1052–1059. doi: 10.1158/1055-9965.EPI-04-0717. [DOI] [PubMed] [Google Scholar]
- 37.Ursin G, Ma H, Wu A, et al. Mammographic density and breast cancer in three ethnic groups. Cancer Epidemiol Biomarkers Prev. 2003;12(4):332–338. [PubMed] [Google Scholar]
- 38.Vachon CM, Brandt KR, Ghosh K, et al. Mammographic breast density as a general marker of breast cancer risk. Cancer Epidemiol Biomarkers Prev. 2007;16(1):43–49. doi: 10.1158/1055-9965.EPI-06-0738. [DOI] [PubMed] [Google Scholar]
- 39.Maskarinec G, Pagano I, Chen Z, et al. Ethnic and geographic differences in mammographic density and their association with breast cancer incidence. Breast Cancer Res Treat. 2007;104(1):47–56. doi: 10.1007/s10549-006-9387-5. [DOI] [PubMed] [Google Scholar]
- 40.Stone J, Warren RML, Pinney E, Warwick J, Cuzick J. Determinants of percentage and area measures of mammographic density. Am J Epidemiol. 2009;170:1571–1578. doi: 10.1093/aje/kwp313. [DOI] [PubMed] [Google Scholar]
- 41.Pike MC, Krailo MD, Henderson BE, Casagrande JT, Hoel DG. ‘Hormonal’ risk factors, ‘breast tissue age’ and the age incidence of breast cancer. Nature. 1983;303:767–770. doi: 10.1038/303767a0. [DOI] [PubMed] [Google Scholar]
- 42.Key TJ, Pike MC. The role of oestrogens and progestagens in the epidemiology and prevention of breast cancer. Eur J Cancer Clin Oncol. 1988;24:29–43. doi: 10.1016/0277-5379(88)90173-3. [DOI] [PubMed] [Google Scholar]
- 43.Bernstein L, Ross RK. Endogenous hormones and breast cancer risk. Epidemiol Rev. 1993;15:48–65. doi: 10.1093/oxfordjournals.epirev.a036116. [DOI] [PubMed] [Google Scholar]
- 44.Muti P. The role of endogenous hormones in the etiology and prevention of breast cancer: the epidemiological evidence. Recent Results Cancer Res. 2005;166:245–256. doi: 10.1007/3-540-26980-0_16. [DOI] [PubMed] [Google Scholar]
- 45.Santen RJ, Boyd NF, Chlebowski RT, Cummings S, Cuzick J, Dowsett M, Easton D, Forbes JF, Key T, Hankinson SE, Howell A, Ingle J Breast Cancer Prevention Collaborative Group. Critical assessment of new risk factors for breast cancer: considerations for development of an improved risk prediction model. Endocr Relat Cancer. 2007;14(2):169–187. doi: 10.1677/ERC-06-0045. [DOI] [PubMed] [Google Scholar]
- 46.Bernstein L, Ross RK. Endogenous hormones and breast cancer risk. Epidemiol Rev. 1993;15:48–65. doi: 10.1093/oxfordjournals.epirev.a036116. [DOI] [PubMed] [Google Scholar]
- 47.Henderson BE, Ross RK, Judd HL, Krailo MD, Pike MC. Do regular ovulatory cycles increase breast cancer risk? Cancer. 1985;56:1206–1208. doi: 10.1002/1097-0142(19850901)56:5<1206::aid-cncr2820560541>3.0.co;2-9. [DOI] [PubMed] [Google Scholar]
- 48.Eliassen AH, Missmer SA, Tworoger SS, et al. Endogenous steroid hormone concentrations and risk of breast cancer among premenopausal women. J Natl Cancer Inst. 2006;98:1406–1415. doi: 10.1093/jnci/djj376. [DOI] [PubMed] [Google Scholar]
- 49.Walker K, Fletcher O, Johnson N, et al. Premenopausal mammographic density in relation to cyclic variations in endogenous sex hormone levels, prolactin, and insulin-like growth factors. Cancer Res. 2009;69(16):6490–6499. doi: 10.1158/0008-5472.CAN-09-0280. [DOI] [PubMed] [Google Scholar]


