

Abstract
Merkel cell carcinoma (MCC) is an aggressive cutaneous neuroendocrine tumor with high mortality rates. Merkel cell polyomavirus (MCPyV), identified in the majority of MCC, may drive tumorigenesis via viral T antigens. However, mechanisms underlying pathogenesis in MCPyV-negative MCC remain poorly understood. To nominate genes contributing to pathogenesis of MCPyV-negative MCC, we performed DNA microarray analysis on 30 MCCs. MCPyV status of MCCs was determined by PCR for viral DNA and RNA. 1593 probe-sets were differentially expressed between MCPyV-negative and -positive MCC, with significant differential expression defined as at least 2-fold change in either direction and p-value of ≤ 0.05. MCPyV-negative tumors showed decreased RB1 expression, whereas MCPyV-positive tumors were enriched for immune response genes. Validation studies included immunohistochemistry demonstration of decreased RB protein expression in MCPyV-negative tumors and increased peritumoral CD8+ T lymphocytes surrounding MCPyV-positive tumors. In conclusion, our data suggest that loss of RB1 expression may play an important role in tumorigenesis of MCPyV-negative MCC. Functional and clinical validation studies are needed to determine whether this tumor suppressor pathway represents an avenue for targeted therapy.
Introduction
Merkel cell carcinoma (MCC) is an aggressive neuroendocrine tumor of the skin with high rates of recurrence, metastasis, and mortality. The incidence of MCC has nearly tripled in the past 20 years and this malignancy is more prevalent in the immunosuppressed and elderly. The 5-year overall survival from time of diagnosis is 30-64%. Survival decreases upon metastasis to lymph nodes, distant skin sites, or distant organs (Bichakjian et al., 2007).
There is increased risk for MCC in solid organ transplant recipients, chronic lymphocytic leukemia patients, and HIV-infected patients, suggesting an infectious etiology for this malignancy (Bhatia et al., 2011; Engels et al., 2002; Kuhajda et al., 1986; Penn and First, 1999). The DNA of a novel virus, Merkel cell polyomavirus (MCPyV), has been identified in approximately 80% of MCCs (Becker et al., 2009; Bhatia et al., 2011; Brewer et al., 2012; Feng et al., 2008; Foulongne et al., 2008; Garneski et al., 2009; Kassem et al., 2008; Katano et al., 2009). MCPyV may contribute to tumorigenesis via a truncated large T antigen (LTAg) and small T antigen (STAg), which inhibit the tumor suppressor retinoblastoma (RB) and promote signaling by the mammalian target of rapamycin pathway, respectively (Houben et al., 2012; Shuda et al., 2008; Shuda et al., 2011). Mechanisms of tumorigenesis specific to MCPyV-negative tumors are less well understood, although altered expression of RB, p53, and/or c-KIT suggest that these molecules may play a role (Bhatia et al., 2010b; Sihto et al., 2011; Waltari et al., 2011).
To our knowledge, transcriptional profiles of MCPyV-negative and -positive tumors have not been compared. To nominate candidate genes involved in MCPyV-independent MCC tumorigenesis, we performed DNA microarray analysis of Merkel cell carcinoma tumors and correlated profiling results with MCPyV tumor status.
Results
Patient demographics
Patient demographic information is summarized in Table 1. The study included 30 tumors from 27 patients (14 men and 13 women) diagnosed with MCC between 2005 and 2010. The mean patient age at diagnosis was 75 years. Two patients were immunosuppressed at the time of diagnosis due to organ transplant. Two additional patients had chronic lymphocytic leukemia.
Table 1.
Patient and tumor characteristics of profiled cases.
| Primary tumor | |||||||||||
|---|---|---|---|---|---|---|---|---|---|---|---|
|
|
|||||||||||
| Patient no. | Case no. | Tumor type/source | Gender | Stage at diagnosis | Age at diagnosis | Immunosuppression | Outcome | Time to outcome (months) | Breslow (mm) | Body site | MCPyV1 |
| 1 | 1 | Primary/skin | M | 3 | 65 | no | DOD2 | 13 | ≥7 | shoulder | negative |
| 2 | 2 | Primary/skin | F | 1 | 82 | no | DOC3 | 36 | ND7 | leg | positve |
| 3 | 3 | Primary/skin | M | 2 | 88 | no | DOC | 23 | >6 | leg | positive |
| 4 | 4 | Primary/skin | M | 1 | 81 | no | AWED4 | 41 | 3.3 | forehead | negative |
| 5 | 5 | Primary/skin | M | 1 | 59 | yes | DOD | 15 | >2.2 | ear | negative |
| 6 | 6 | Primary/skin | M | 1 | 70 | no | AWED | 33 | >4 | ear | negative |
| 7 | 7 | Primary/skin | F | 1 | 85 | no | LTFU5 | 5.5 | cheek | positive | |
| 8 | 8 | Primary/skin | F | 2 | 68 | no | AWED | 37 | 1.85 | leg | ND |
| 9 | 9 | Primary/skin | F | 2 | 77 | no | AWED | 7 | ≥9 | eyelid | positive |
| 10 | 10 | Primary/skin | M | 3 | 80 | no | AWED | 18 | ≥ 4.1 | arm | positive |
| 11 | 11 | Primary/skin | M | 1 | 59 | no | AWED | 13 | 3.8 | arm | positive |
| 12 | 12 | Primary/skin | F | 1 | 75 | no | AWED | 12 | 4.8 | leg | positive |
| 13 | 13 | Primary/skin | M | 1 | 85 | no | AWED | 6 | 9 | hand | negative |
| 14 | 14 | Primary/skin | F | 2 | 77 | no | AWED | 12 | ≥9 | cheek | negative |
| 15 | 15 | Primary/skin | M | 2 | 78 | no | DOD | 7 | 3.1 | cheek | negative |
| 16 | 16 | Primary/skin | M | 1 | 80 | no | AWED | 6 | ≥ 2.5 | leg | positive |
| 17 | 17 | Metastasis/skin | F | 3 | 78 | no | DOD | 14 | 6 | leg | ND |
| 18 | 18 | Metastasis/skin | M | 3 | 85 | no | DOD | 12 | ≥5 | nose | negative |
| 19 | 19 | Metastasis/skin | M | 3 | 69 | no | DOD | 17 | >6 | temple | negative |
| 20 | 20 | Metastasis/skin | F | 3 | 67 | yes9 | DOD | 16 | 10 | forearm | positive |
| 21 | 21 | Metastasis/skin | F | 3 | 57 | no | AWED | 62 | ND | foot | positive |
| 22 | 22 | Metastasis/parotid | F | 3 | 85 | no | DOD | 9 | 18 | cheek | positive |
| 23 | 23 | Metastasis/parotid | F | 3 | 90 | no | AWED | 12 | 9 | temple | negative |
| 24 | 24 | Metastasis/LN8 | F | 3 | 79 | no | AWED | 20 | 12 | arm | positive |
| 25 | 25 | Primary/skin | F | 2 | 85 | no | DOD | 27 | ND | arm | ND |
| (25) | 26 | Metastasis/skin | negative | ||||||||
| 26 | 27 | Primary/skin | M | 2 | 53 | yes | AWRD6 | 10 | 19 | arm | negative |
| (26) | 28 | Metastasis/LN | negative | ||||||||
| 27 | 29 | Primary/skin | M | 1 | 71 | yes9 | DOD | 25 | 4 | neck | equivocal |
| (27) | 30 | Metastasis/parotid | negative | ||||||||
MCPyV status was determined by PCR of tumor genomic DNA and cDNA, as described in the text.
DOD: died of disease.
DOC: died of other causes.
AWED: alive without evidence of disease.
LTFU: lost to followup.
AWRD: alive with residual disease.,
ND: Not determined (due to lack of PCR-quality DNA in the case of MCPyV status).
LN: lymph node.
Patient with history of chronic lymphocytic leukemia.
Transcriptional profiling demonstrates distinct gene expression patterns in Merkel cell carcinoma compared with other primary cutaneous carcinomas
To characterize gene expression patterns in MCC, we analyzed transcriptional profiles of 19 primary MCCs, 11 metastatic MCCs, three MCC cell lines, four primary cutaneous squamous cell carcinomas (SCCs), and two basal cell carcinomas (BCCs). Oligonucleotide arrays with over 54,000 probe-sets representing over 47,400 transcripts were utilized. To generate an unsupervised two-dimensional representation of relative gene expression across all tumors, we performed principal component analysis (PCA) of all probe-sets. The resulting PCA plot demonstrated clear distinction of MCCs from SCCs and BCCs, with only one outlier (Figure 1). Cultured MCC cells, which represent a pure population of tumor cells, assorted with MCC tumor specimens. The single MCC outlier case was morphologically similar to other MCC tumors in the cohort, but had lower tumor volume than other samples.
Figure 1. Principal component analysis of Merkel cell carcinoma transcriptional profiles relative to Merkel cell carcinoma cell lines and nonmelanoma skin cancers.

Merkel cell carcinomas have a distinct expression profile compared to squamous cell and basal cell carcinomas. Solid squares indicate primary cutaneous squamous cell carcinomas (SCC). Solid circles indicate basal cell carcinomas (BCC). Solid triangles indicate Merkel cell carcinoma primary tumors (MCC). Open triangles indicate metastatic MCC tumors (Met). Asterisks indicate MCC cell lines. PC1: principal component 1. PC2: principal component 2.
For all analyses, significant differential expression was defined as at least 2-fold differential expression in either direction, with an adjusted p-value of ≤ 0.05. Relative to squamous cell carcinomas, MCCs demonstrated significant differential expression of over 4000 probe-sets (Figure S1, Table S1, and data not shown), with a false discovery rate of 1.8%. In validation of our approach, our screen identified established diagnostic markers of MCC including cytokeratin 20, chromogranin A, synaptophysin, and NCAM1, as well as known markers for SCC such as cytokeratin 5/6 and TP63 (Table S1). In addition, we observed upregulation of the proposed mechanoreceptor genes Piezo2 (FAM38B) and TRPC1 (Chalfie, 2009; Coste et al., 2010; Garrison et al., 2011). To screen for upregulated genes with potential roles in tumorigenesis, we searched the data set for the term “oncogene” in the gene description, and filtered these candidates by literature search to identify genes with known roles in cancer biology. Using this method, we identified potentially protumorigenic genes including FYN, AKT3, MYB, RAB3B, JUND, and FEV (Table S1)(Hers et al., 2011; Nakayama et al., 2012; Peter et al., 1997; Ramsay and Gonda, 2008; Saito et al., 2010; Tan et al., 2012). In further validation of our data set, we also found upregulation of genes previously reported to be expressed in MCC, including SOX2, BCL2, MYCL1, VEGFA, GPC3, ATOH1, HIP1, and KIT (Table S1)(Ames et al., 2011; Ben-Arie et al., 2000; Brunner et al., 2008; Fernandez-Figueras et al., 2007; He et al., 2009; Kennedy et al., 1996; Laga et al., 2010; Leonard et al., 2002; Moll et al., 1996; Paulson et al., 2009; Plettenberg et al., 1996; Su et al., 2002). We also identified upregulation of numerous genes previously described as expressed in benign Merkel cells, including neuronal transcription factors, presynaptic molecules, and ion channels (Table S1)(Haeberle et al., 2004).
The group of over- or under-expressed genes in MCC relative to SCC was assessed for functional clusters by gene ontology (GO) analysis, which revealed that MCCs were enriched for gene sets associated with neural differentiation (Table S2). Comparison with a database of gene expression profiles via parametric gene set analysis revealed similarity between MCC and tumors including neuroblastoma (Figure S2).
Comparison of MCC with BCC yielded 650 significantly different probe-sets. Genes upregulated in BCC relative to MCC included the Hedgehog pathway transcripts GLI1, GLI2, PTCH1, and PTCH2, as well as the Hedgehog target basonuclin (Table S3), consistent with the known role of Hedgehog signaling in BCC (Cui et al., 2004; Kasper et al., 2012).
In silico comparison of MCC with normal skin demonstrated significant difference in expression in > 8000 probe-sets, with significant differential expression defined as at least 2-fold differential expression in either direction, with an adjusted p-value of ≤ 0.05. PCA demonstrated clear separation between groups (Figure S3). We observed differential expression of MCC diagnostic markers, proposed mechanoreceptor genes, and protumorigenic genes (Table S4).
MCPyV status and clinical features
By PCR detection of MCPyV DNA and RNA, we found that 12/26 (46%) of tumors in our cohort were MCPyV-positive and 14/26 (54%) were MCPyV-negative (Figure S4). There was no significant difference in age at diagnosis and stage at presentation between MCPyV-negative and MCPyV-positive groups. Tumors showed significantly different anatomic distribution by MCPyV status (p = 0.029). Specifically, eight of eleven (73%) MCPyV-negative primary tumors were located in the head and neck region and three (27%) were on the upper extremities, whereas none were on the lower extremity. In contrast, three of twelve (25%) MCPyV-positive primary tumors were located on the head and neck, four (33%) on the upper extremity, and five (42%) on the lower extremity.
Transcriptional profiling identifies distinct gene expression patterns in MCPyV-negative MCC
We analyzed gene expression patterns in MCPyV-positive versus -negative tumors. By PCA of all probe-sets, the majority of MCPyV-positive tumors formed a cluster which displayed partial overlap with MCPyV-negative tumors (Figure 2). 1593 probe-sets displayed significant differential expression between MCPyV-positive and -negative tumors, with a false discovery rate of 1.9% (Figure 3 and data not shown). By GO and Kyoto Encyclopedia of Genes and Genomes (KEGG) pathway analysis, MCPyV-negative tumors displayed relative upregulation of gene groups associated with Notch signaling and receptor tyrosine kinase signaling, among others (Table 2 and data not shown).
Figure 2. Principal component analysis of Merkel cell carcinoma tumors by Merkel cell polyomavirus status.

The majority of Merkel cell polyomavirus (MCPyV)-positive tumors (open circles) display a distinct cluster which partially overlaps with MCPyV-negative tumors (solid squares). MCPyV-negative tumors are more heterogeneous. Negative: MCPyV T antigen (TAg) DNA and RNA negative. Positive: TAg DNA and RNA positive. PC1: principal component 1. PC2: principal component 2.
Figure 3. Genes with greatest differential expression in Merkel cell polyomavirus-positive tumors relative to -negative tumors.
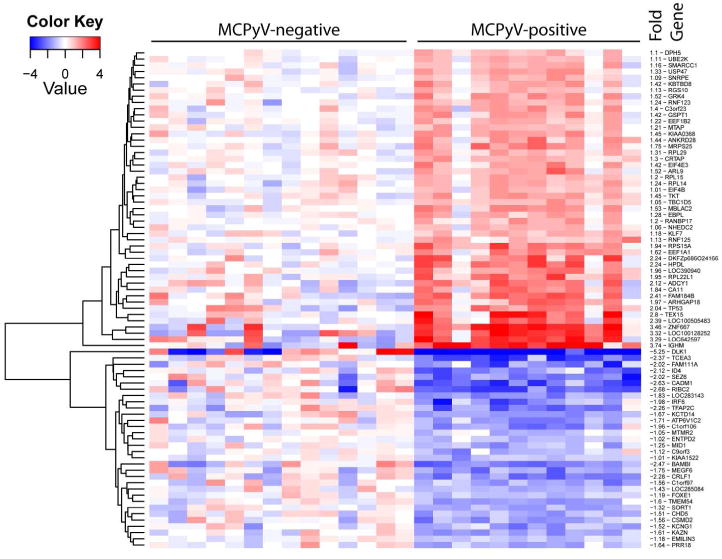
All genes shown have adjusted p-value ≤ 0.05. Fold values are in log2.
Table 2.
Functional gene classes enriched in Merkel cell polyomavirus-negative compared to -positive tumors.
| KEGG pathway1, probe-set | Gene | Description | Fold2 |
|---|---|---|---|
| Axon guidance | |||
| 229288_at | EPHA7 | EPH receptor A7 | 4.41 |
| 214607_at | PAK3 | p21 protein (Cdc42/Rac)-activated kinase 3 | 4.72 |
| 231325_at | UNC5D | unc-5 homolog D (C. elegans) | 4.29 |
| 200965_s_at | ABLIM1 | actin binding LIM protein 1 | 3.53 |
| 227449_at | EPHA4 | EPH receptor A4 | 3.27 |
| 230425_at | EPHB1 | EPH receptor B1 | 4.06 |
| 209589_s_at | EPHB2 | EPH receptor B2 | 2.50 |
| 236088_at | NTNG1 | netrin G1 | 2.36 |
| 213169_at | SEMA5A | semaphorin 5A | 2.03 |
| 223610_at | SEMA5B | semaphorin 5B | 2.16 |
| 32541_at | PPP3CC | protein phosphatase 3, catalytic subunit, gamma isozyme | 0.49 |
| 212298_at | NRP1 | neuropilin 1 | 0.48 |
| 240425_x_at | ROBO2 | roundabout, axon guidance receptor, homolog 2 (Drosophila) | 0.43 |
| 227955_s_at | EFNA5 | ephrin-A5 | 0.29 |
| 213603_s_at | RAC2 | rho family, small GTP binding protein Rac2 | 0.36 |
| 206941_x_at | SEMA3E | semaphorin 3E | 0.11 |
| Pathways in cancer | |||
| 208606_s_at | WNT4 | wingless-type MMTV integration site family, member 4 | 3.94 |
| 203638_s_at | FGFR2 | fibroblast growth factor receptor 2 | 2.75 |
| 210512_s_at | VEGFA | vascular endothelial growth factor A | 2.73 |
| 205463_s_at | PDGFA | platelet-derived growth factor alpha polypeptide | 2.25 |
| 230288_at | FGF14 | fibroblast growth factor 14 | 2.06 |
| 227271_at | FGF11 | fibroblast growth factor 11 | 2.07 |
| 227314_at | ITGA2 | integrin, alpha 2 (CD49B, alpha 2 subunit of VLA-2 receptor) | 2.25 |
| 221029_s_at | WNT5B | wingless-type MMTV integration site family, member 5B | 2.04 |
| 239178_a | FGF9 | fibroblast growth factor 9 (glia-activating factor) | 0.43 |
| 203132_at | RB1 | retinoblastoma 1 | 0.41 |
| 223709_s_at | WNT10A | wingless-type MMTV integration site family, member 10A | 0.28 |
| Notch signaling pathway | |||
| 224215_s_at | DLL1 | delta-like 1 (Drosophila) | 4.99 |
| 201218_at | CTBP2 | C-terminal binding protein 2 | 2.71 |
| 203394_s_at | HES1 | hairy and enhancer of split 1, (Drosophila) | 2.50 |
| 32137_at | JAG2 | jagged 2 | 2.35 |
| 216268_s_at | JAG1 | jagged 1 | 2.25 |
| Neuroactive ligand-receptor interaction | |||
| 209990_s_at | GABBR2 | gamma-aminobutyric acid (GABA) B receptor, 2 | 7.94 |
| 231192_at | LPAR3 | lysophosphatidic acid receptor 3 | 5.98 |
| 221107_at | CHRNA9 | cholinergic receptor, nicotinic, alpha 9 | 4.41 |
| 231384_at | GRIN2A | glutamate receptor, ionotropic, N-methyl D-aspartate 2A | 2.69 |
| 209793_at | GRIA1 | glutamate receptor, ionotropic, AMPA 1 | 2.62 |
| 213506_at | F2RL1 | coagulation factor II (thrombin) receptor-like 1 | 2.30 |
| 229944_ at | OPRK1 | opioid receptor, kappa 1 | 2.14 |
| 229309_at | ADRB1 | adrenergic, beta-1-, receptor | 2.0 |
| 230593_at | GRIK3 | glutamate receptor, ionotropic, kainate 3 | 2.03 |
| 206128_at | ADRA2C | adrenergic, alpha-2C-, receptor | 0.41 |
| 205279_s_at | GLRB | glycine receptor, beta | 0.38 |
| 211772_x_at | CHRNA3 | cholinergic receptor, nicotinic, alpha 3 | 0.36 |
| 229686_at | P2RY8 | purinergic receptor P2Y, G-protein coupled, 8 | 0.39 |
| 213845_at | GRIK2 | glutamate receptor, ionotropic, kainate 2 | 0.38 |
| 207307_at | HTR2C | 5-hydroxytryptamine (serotonin) receptor 2C | 0.38 |
KEGG pathways for each gene group are shown in italics. Note that although a functional class/pathway may be upregulated as a whole by KEGG analysis, some individual genes within a class may not display upregulation.
Fold change represents relative array transcript expression in MCPyV-negative Merkel cell carcinoma (MCC) relative to MCPyV-positive MCC. A central value for each probe-set was determined by averaging log-transformed data, and taking the anti-logarithm.
Merkel cell polyomavirus-positive tumors are enriched for peritumoral lymphoctyes
GO and KEGG analyses identified enrichment for a number of gene groups associated with immune response in the MCPyV-positive tumor cohort including CD3G, CD3D, ZAP70 and IGHM, suggesting increased presence of tumoral lymphocytes. Thus, we performed immunohistochemical studies to define the immune infiltrate associated with MCPyV-positive tumors. Relative to MCPyV-negative tumors, MCPyV-positive tumors were associated with significantly increased CD8+ cells (fold 14.0, p = 0.01) (Figure 4). There was also a trend toward increased CD3+ cells (fold 3.1, p = 0.10). CD4+ T-cells were scant in both MCPyV-positive and -negative tumors. CD20+ B-cells were variable, with no significant difference between groups (data not shown).
Figure 4. Merkel cell polyomavirus negativity is associated with relatively decreased immune response and loss of Retinoblastoma expression.
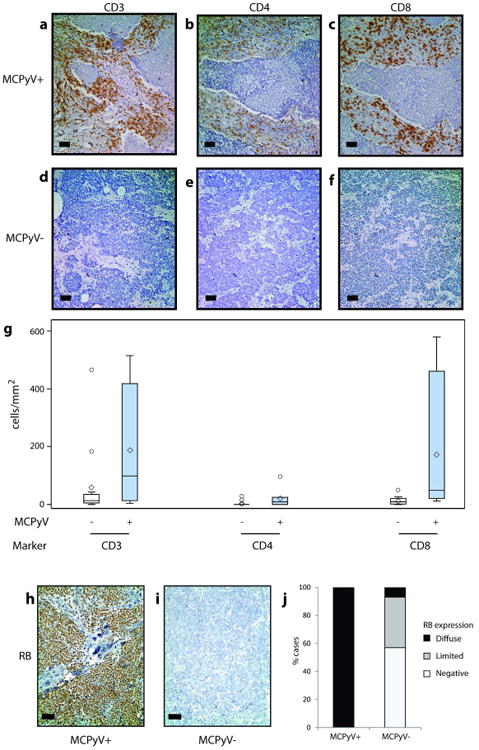
Relative to Merkel cell polyomavirus-negative tumors (a-c), Merkel cell polyomavirus-positive tumors (d-f) display a trend toward increased CD3+ peritumoral lymphocytes (a, d, g), low CD4+ T lymphocytes (b, e, g) and significantly increased CD8+ T lymphocytes (c, f, g) by immunohistochemistry. Merkel cell polyomavirus-positive tumors uniformly express RB (h, j), whereas the majority of Merkel cell polyomavirus-negative tumors display loss of RB expression by immunohistochemistry (i, j). Scale bar = 50 microns.
In our cohort, most lymphocytes were in the peritumoral stroma or associated with tumoral vessels, with only a small number of tumor-infiltrating lymphocytes (TILs). We observed a trend toward slightly increased CD8+ TILs in MCPyV-positive tumors, which did not reach statistical significance (fold 2.4, p = 0.06).
Retinoblastoma expression is decreased in MCPyV-negative MCC
Previous reports have described increased RB protein expression in MCPyV-positive tumors (Bhatia et al., 2010b; Sihto et al., 2011), although other reports found no association (Houben et al., 2010; Schrama et al., 2011). We observed a 2.4-fold upregulation of RB1 in MCPyV-positive tumors by microarray (Table 2). By immunohistochemistry analysis, 7/7 (100%) of MCPyV-positive tumors were diffusely positive (>50% of cells) for expression of RB protein (Figure 4). In contrast, only 1/14 (7%) of MCPyV-negative tumors showed diffuse RB expression, 5 (36%) cases displayed intermediate levels of expression (10-50% of cells), and 8 (57%) lacked significant expression.
Discussion
Transcriptome profiling by DNA microarray analysis is a powerful tool for identifying gene expression changes within tumors and tumor subgroups. Here, we report gene expression profiles of 30 MCCs, with direct comparison to 4 primary cutaneous SCCs and 2 BCCs, as well as in silico comparison to 64 normal skin samples. In support of the biological validity of our expression profiles, our screen identified upregulation of diagnostic markers for MCC, including CK20 and neuroendocrine markers, with respect to normal skin and SCC. We also identified increased expression of genes which may play protumorigenic roles in MCC, including FYN and FEV. Further expression and functional studies are needed to characterize the roles of these genes in MCC.
Uncertainty regarding the cell of origin for MCC contributes to difficulty in understanding mechanisms of MCC tumorigenesis. Historically, MCC was thought to arise from Merkel cells, which are mechanoreceptor cells in the basal epidermis that share immunohistochemical and ultrastructural features with MCC. However, this theory has been debated because MCC often spares the epidermis, whereas benign Merkel cells are intraepidermal (Plaza and Suster, 2006; Van Keymeulen et al., 2009). MCCs in our cohort displayed differential regulation of genes with proposed roles in mechanosensation and/or known expression in benign Merkel cells (Chalfie, 2009; Coste et al., 2010; Garrison et al., 2011; Haeberle et al., 2004). In addition, functional gene set analysis identified that MCC was enriched for gene clusters expressed in the inner ear, an organ with known developmental similarities to benign Merkel cells. These findings further demonstrate the similarity between MCC and benign Merkel cells.
The discovery and characterization of MCPyV has provided a mechanism by which benign Merkel cells or progenitor stem cells may undergo malignant transformation (Becker, 2010). Mechanisms of tumorigenesis in MCPyV-negative MCC are less clear. Evidence suggests that tumors with low/absent viral DNA and/or lack of LTAg expression are associated with loss of RB expression (Bhatia et al., 2010a, b; Sihto et al., 2011), increased c-KIT expression (Waltari et al., 2011), increased p53 expression (Bhatia et al., 2010b; Waltari et al., 2011), and TP53 mutations in a subset (Sihto et al., 2011). Although previous studies have performed gene expression microarray analysis of benign mouse Merkel cells, MCC cell lines, and MCC tumors (Haeberle et al., 2004; Paulson et al., 2011; Van Gele et al., 2004), these studies did not compare gene expression profiles of MCPyV-positive and MCPyV-negative tumors.
In MCPyV-positive MCC, viral LTAg has been shown to promote tumor growth by binding and inactivating the tumor suppressor protein RB (Houben et al., 2012; Shuda et al., 2008). The role of RB in MCPyV-negative MCC pathogenesis has been unclear, with some studies demonstrating decreased RB expression (Bhatia et al., 2010a; Sihto et al., 2011), while others finding no difference (Houben et al., 2010). Our study demonstrated 2.4-fold lower RB1 expression in MCPyV-negative tumors relative to MCPyV-positive tumors by gene expression microarray. Perhaps more significantly, the majority of MCPyV-negative MCC displayed absence of RB protein expression, whereas RB was diffusely expressed in all MCPyV-positive tumors. Thus, loss of RB activity may be integral to MCC pathogenesis, either through its inactivation by LTAg in MCPyV-positive tumors, or by loss of RB expression in MCPyV-negative tumors. Deletions at the RB locus have been described in MCC (Larramendy et al., 2004; Leonard and Hayard, 1997; Paulson et al., 2009; Van Gele et al., 1998). A subset of MCPyV-negative tumors retained RB expression, suggesting that an alternative mechanism of RB pathway dysregulation may occur in these tumors.
The relationship of MCPyV status with various clinical parameters is under active investigation. Age and stage at presentation were not significantly related to MCPyV status in our study. In agreement with previous reports (Paik et al., 2011; Sihto et al., 2011), we observed a significantly higher incidence of MCPyV-negative MCC tumors on the head and neck, whereas more MCPyV-positive MCC tumors were located on limbs. The incidence of MCPyV by PCR in our cohort was lower (46%) than the commonly reported 70-80% (Bhatia et al., 2011). Because the influence of factors such as immune status and geography on MCPyV incidence in MCC is incompletely understood, we cannot rule out the possibility that clinical/epidemiologic factors are affecting the rate of MCPyV positivity in our cohort.
Several lines of evidence suggest that both cellular and humoral responses occur in response to viral antigens expressed in MCPyV-positive MCC. Serum antibodies against MCPyV TAg are relatively specific for the presence of active MCC, whereas antibodies against viral capsid proteins are less specific (Carter et al., 2009; Faust et al., 2011; Pastrana et al., 2009; Paulson et al., 2009; Tolstov et al., 2009). MCPyV-reactive CD4+ and CD8+ T cells have been isolated from MCPyV-positive MCC tumors, but are absent from MCPyV-negative tumors (Iyer et al., 2011). Furthermore, one study found that MCPyV-positive tumors are associated with significantly increased CD3+ and CD8+ TILs as well as tumor-infiltrating monocytes, although another study did not corroborate these findings with respect to CD8+ T-cells (Paulson et al., 2011; Sihto et al., 2012). By gene ontology analysis, we observed increased expression of immune response genes in MCPyV-positive tumors, consistent with the presence of increased tumoral lymphocytes.
Immunohistochemistry revealed significantly increased CD8+ T cells in the peritumoral stroma of MCPyV-positive tumors. Together with previous studies, our results indicate that MCPyV-associated cellular immune response appears to consist predominantly of CD8+ lymphocytes (Iyer et al., 2011; Sihto et al., 2012), although we observed the immune response to consist of predominantly peritumoral lymphocytes rather than TILs.
In summary, we report a transcriptome-wide comparison of MCPyV-positive MCC with MCPyV-negative MCC. RB expression is lost in the majority of MCPyV-negative tumors, supporting the concept that RB deregulation is a key alteration in MCC. Our data are in keeping with the notion of two distinct classes of MCC based on viral status. Further studies evaluating the Notch pathway and receptor tyrosine kinases are underway to elucidate their role in the pathogenesis of MCC.
Materials and methods
Tumor procurement and cell lines
Studies were approved by the Institutional Review Board of the University of Michigan. For all tumors, MCC diagnosis was confirmed by morphology and immunohistochemistry at the time of diagnosis. All tumor tissue was procured from the University of Michigan Hospitals Cutaneous Surgery and Oncology Program. At time of collection, tumor tissue was flash-frozen in liquid nitrogen and stored at -80°C until RNA extraction. Formalin-fixed paraffin-embedded tissue for tissue microarray construction was obtained from archival tissue blocks. The adequacy of frozen section and paraffin-embedded tissue was confirmed by two pathologists (DF and PH).
RNA was prepared from normal skin and processed for microarray analysis as previously described (Gudjonsson et al., 2009).
Merkel cell carcinoma cell lines were established at the University of Michigan from tumor tissue procured as described above, with additional details on cell line establishment in Supplemental Materials and Methods.
RNA isolation
Areas with at least 70% tumor cellularity were targeted for RNA isolation, using hematoxylin and eosin stains obtained on frozen sections for each specimen. Representative 2 mm3 areas were removed from the tissue block and homogenized in the presence of Trizol reagent (Life Technologies, Gaithersburg, MD) and total cellular RNA was purified according to the manufacturer's standard protocol. RNA was then further purified using miRVANA (Ambion, Austin, TX) according to the manufacturer's protocol. After purification, RNA quality was assessed by Agilent Bioanalyzer.
cRNA synthesis and gene expression profiling
Human 133 Plus 2.0 microarrays (Affymetrix, Santa Clara, CA) were used, which consist of >54,000 probe-sets representing approximately 47,400 transcripts. Preparation of cRNA hybridization was performed according to manufacturer's protocols. GeneChips were scanned using the Affymetrix 3000 7G GeneChip Scanner with Autoloader and processed by the Affymetrix Gene Chip Command Console version 3.2. Samples were analyzed in two batches, with overlapping specimens included to control for batch effect. Due to lack of overlapping samples, batch effect could not be corrected for the in silico comparison between MCC and normal skin. Expression data has been made available in the GEO database (accession number GSE39612).
Statistical analysis
For DNA microarrays, log2 gene expression values were calculated using a robust multi-array average. Adjusted p-value was calculated using the Benjamini and Hochberg False Discovery Rate concept (Benjamini and Hochberg, 1995). For all analyses, a fold change of ≥ 2.0 or ≤ 0.5 with an adjusted p-value of ≤ 0.05 was considered statistically significant. Array quality was evaluated by standard error estimates for each gene standardized across all arrays after fitting a probe level model using the affyPLM package of Bioconductor (Bolstad et al., 2005). One sample was eliminated due to elevated standard errors. Age was described and tested between MCPyV-positive and negative groups using means, standard deviations and corresponding t-tests. Anatomical site was compared between MCPyV groups with Fisher's exact test. Further details on statistical analyses are provided in Supplemental Materials and Methods.
Characterization of MCPyV status in MCC tumors
PCR of isolated genomic tumor DNA was performed to detect the presence of MCPyV DNA in tumor samples. Because tumors that contain MCPyV DNA but lack LTAg expression are reported to be more similar to MCPyV-negative tumors with regard to clinical outcome (Sihto et al., 2011), we also characterized RNA expression of MCPyV large and small T antigens by RT-PCR. Tumor RNA was used to prepare cDNA according to standard protocols. Briefly, 0.25 µg RNA was utilized for first strand cDNA synthesis with SuperScript™ II Reverse Transcriptase (Invitrogen) as per manufacturer's directions. Detection of MCPyV sequence (based on GenBank NC_010277) was conducted by semi-quantitative PCR on tumor cDNA and/or genomic DNA using primers TA1, targeting the exon 1 coding region common to all T antigen transcripts (forward primer: nucleotides (nts) 226-245, reverse primer: nts 357-376), and TA2, targeting the exon 1 coding region specific to small T antigen only (forward primer: nts 354-373, reverse primer: nts 571-590). Results were further confirmed using the previously described primers for capsid viral protein (VP1)(Feng et al., 2008). Human beta-actin primers were used as a control. As a control for a gene expressed in Merkel cell carcinoma, primers were used for atonal homolog 1 (GenBank NP_005163; forward primer: nts 230-249, reverse primer: nts 444-463). All primers were designed using Primer3 (http://fokker.wi.mit.edu/primer3/input.htm). PCR products were separated by agarose gel and visualized by ethidium bromide. Three tumors were excluded due to insufficient tissue or degraded DNA. An additional tumor was excluded due to equivocal results for TAg mRNA expression. Of the remaining 26 tumors, twelve (46%) had both MCPyV DNA and mRNA, and fourteen (54%) lacked both MCPyV DNA and mRNA.
Immunohistochemistry
A tissue microarray (TMA) of profiled tumors was constructed, with each tumor represented by two 1.0 mm cores. Tumor content of each core was verified by H&E stain. Immunohistochemistry was performed using a DAKO automated stainer as previously described (Yu et al., 2010). Antibodies and dilutions are described in Supplemental Materials and Methods.
For RB, the percentage of tumor cells labeled was recorded as one of three categories: < 10% (negative), 10–50% (intermediate) and >50% (diffuse). All positive cases displayed a nuclear pattern of staining. RB staining was compared between MCPyV groups with Fisher's exact test.
For CD20, CD3, CD4, and CD8, peritumoral and tumor-infiltrating lymphocytes were counted across two 1 mm tissue microarray cores for each tumor. Wilcoxon rank test was used to test differences in CD20+, CD3+, CD4+, and CD8+ peritumoral and tumor-infiltrating lymphocytes measures between MCPyV groups.
Supplementary Material
Supplemental figure S1. Genes with greatest differential expression between Merkel cell and cutaneous squamous cell carcinoma. All genes shown have adjusted p-value ≤ 0.05. Fold values are in log2. SCC: cutaneous squamous cell carcinoma. MCC: Merkel cell carcinoma. CL: Merkel cell carcinoma cell lines.
Supplemental figure S2. Gene groups differentially regulated in Merkel cell carcinoma relative to squamous cell carcinoma by parametric gene set enrichment analysis. (a) Analysis of genes upregulated in Merkel cell carcinoma reveals similarities to tumors including neuroblastoma. (b) Genes downregulated in MCC relative to SCC.
Supplemental figure S3. Principal component analysis of Merkel cell carcinoma transcriptional profiles relative to normal skin. Merkel cell carcinomas have a distinct expression profile compared to normal skin. Solid circles indicate normal skin. Open squares indicate Merkel cell carcinoma (MCC). PC1: principal component 1. PC2: principal component 2.
Supplemental figure S4. RT-PCR detection of Merkel cell polyomavirus T antigen and VP1 expression in Merkel cell carcinoma. Viral gene expression in cDNA prepared from tumor tissue was analyzed using primers targeting Merkel cell polyomavirus large T antigen and small T antigen (LTAg+STAg, primer pair TA1), small T antigen only (STAg, primer pair TA2), or viral capsid protein 1 (VP1). Atonal homolog 1 (ATOH1) is included as a control gene expressed in Merkel cell carcinoma. Beta-actin is included as a loading control. Patient and case numbers are as shown in Table 1.
Table S1. RNA expression of selected genes in Merkel cell carcinoma relative to squamous cell carcinoma. 1A central value for each probe-set was determined by averaging log-transformed data, and taking the anti-logarithm. A fold difference of ≥ 2.0 with adjusted p-value ≤ 0.05 was considered statistically significant.
Table S2. Selected functional classes, by gene ontology, for genes with significantly higher RNA expression in Merkel cell carcinoma relative to squamous cell carcinoma. 1MCC: Merkel cell carcinoma. 2SCC: squamous cell carcinoma.
Table S3. RNA expression of selected genes in Merkel cell carcinoma relative to basal cell carcinoma. 1A central value for each probe-set was determined by averaging log-transformed data, and taking the anti-logarithm. A fold difference of ≥ 2.0 with adjusted p-value ≤ 0.05 was considered statistically significant. Fold changes shown represent expression in Merkel cell carcinomas relative to basal cell carcinomas.
Table S4. RNA expression of selected genes in Merkel cell carcinoma relative to normal skin. 1A central value for each probe-set was determined by averaging log-transformed data, and taking the anti-logarithm. A fold difference of ≥ 2.0 with adjusted p-value ≤ 0.05 was considered statistically significant. Fold changes shown represent expression in Merkel cell carcinomas relative to normal skin.
Acknowledgments
This work was supported by the Anatomic Pathology Project Fund of the University of Michigan Department of Pathology, a Research Career Development Award from the Dermatology Foundation (M.E.V.), a Training Grant in Cell and Molecular Dermatology (T32AR007197) (K.T.N.), and NIH grant R01CA087837 (A.A.D.).
Abbreviations used
- BCC
basal cell carcinoma
- KEGG
Kyoto Encyclopedia of Genes and Genomes
- LTAg
large T-antigen
- MCC
Merkel cell carcinoma
- MCPyv
Merkel cell polyomavirus
- RB
Retinoblastoma
- SCC
squamous cell carcinoma
- STAg
small T-antigen
Footnotes
Conflict of Interest, The authors state no conflict of interest
References
- Ames HM, Bichakjian CK, Liu GY, Oravecz-Wilson KI, Fullen DR, Verhaegen ME, et al. Huntingtin-interacting protein 1: a Merkel cell carcinoma marker that interacts with c-Kit. J Invest Dermatol. 2011;131:2113–20. doi: 10.1038/jid.2011.171. [DOI] [PMC free article] [PubMed] [Google Scholar]
- Becker JC. Merkel cell carcinoma. Ann Oncol. 2010;21(7):vii81–5. doi: 10.1093/annonc/mdq366. [DOI] [PubMed] [Google Scholar]
- Becker JC, Houben R, Ugurel S, Trefzer U, Pfohler C, Schrama D. MC polyomavirus is frequently present in Merkel cell carcinoma of European patients. J Invest Dermatol. 2009;129:248–50. doi: 10.1038/jid.2008.198. [DOI] [PubMed] [Google Scholar]
- Ben-Arie N, Hassan BA, Bermingham NA, Malicki DM, Armstrong D, Matzuk M, et al. Functional conservation of atonal and Math1 in the CNS and PNS. Development. 2000;127:1039–48. doi: 10.1242/dev.127.5.1039. [DOI] [PubMed] [Google Scholar]
- Benjamini Y, Hochberg Y. Controlling the false discovery rate: a practical and powerful approach to multiple testing. J R Stat Soc Ser B Stat Methodol. 1995;57:289–300. [Google Scholar]
- Bhatia K, Goedert JJ, Modali R, Preiss L, Ayers LW. Immunological detection of viral large T antigen identifies a subset of Merkel cell carcinoma tumors with higher viral abundance and better clinical outcome. Int J Cancer. 2010a;127:1493–6. doi: 10.1002/ijc.25136. [DOI] [PMC free article] [PubMed] [Google Scholar]
- Bhatia K, Goedert JJ, Modali R, Preiss L, Ayers LW. Merkel cell carcinoma subgroups by Merkel cell polyomavirus DNA relative abundance and oncogene expression. Int J Cancer. 2010b;126:2240–6. doi: 10.1002/ijc.24676. [DOI] [PMC free article] [PubMed] [Google Scholar]
- Bhatia S, Afanasiev O, Nghiem P. Immunobiology of Merkel cell carcinoma: implications for immunotherapy of a polyomavirus-associated cancer. Curr Oncol Rep. 2011;13:488–97. doi: 10.1007/s11912-011-0197-5. [DOI] [PMC free article] [PubMed] [Google Scholar]
- Bichakjian CK, Lowe L, Lao CD, Sandler HM, Bradford CR, Johnson TM, et al. Merkel cell carcinoma: critical review with guidelines for multidisciplinary management. Cancer. 2007;110:1–12. doi: 10.1002/cncr.22765. [DOI] [PubMed] [Google Scholar]
- Bolstad B, Collin F, Brettschneider J, Simpson K, Cope L, Irizarry R, et al. Quality Assessment of Affymetrix GeneChip Data. In: Gentleman R, Carey V, Huber W, Irizarry R, Dudoit S, editors. Bioinformatics and Computational Biology Solutions Using R and Bioconductor. New York:: Springer; 2005. pp. 183–326. [Google Scholar]
- Brewer JD, Shanafelt TD, Otley CC, Roenigk RK, Cerhan JR, Kay NE, et al. Chronic lymphocytic leukemia is associated with decreased survival of patients with malignant melanoma and Merkel cell carcinoma in a SEER population-based study. J Clin Oncol. 2012;30:843–9. doi: 10.1200/JCO.2011.34.9605. [DOI] [PubMed] [Google Scholar]
- Brunner M, Thurnher D, Pammer J, Geleff S, Heiduschka G, Reinisch CM, et al. Expression of VEGF-A/C, VEGF-R2, PDGF-alpha/beta, c-kit, EGFR, Her-2/Neu, Mcl-1 and Bmi-1 in Merkel cell carcinoma. Mod Pathol. 2008;21:876–84. doi: 10.1038/modpathol.2008.63. [DOI] [PubMed] [Google Scholar]
- Carter JJ, Paulson KG, Wipf GC, Miranda D, Madeleine MM, Johnson LG, et al. Association of Merkel cell polyomavirus-specific antibodies with Merkel cell carcinoma. J Natl Cancer Inst. 2009;101:1510–22. doi: 10.1093/jnci/djp332. [DOI] [PMC free article] [PubMed] [Google Scholar]
- Chalfie M. Neurosensory mechanotransduction. Nat Rev Mol Cell Biol. 2009;10:44–52. doi: 10.1038/nrm2595. [DOI] [PubMed] [Google Scholar]
- Coste B, Mathur J, Schmidt M, Earley TJ, Ranade S, Petrus MJ, et al. Piezo1 and Piezo2 are essential components of distinct mechanically activated cation channels. Science. 2010;330:55–60. doi: 10.1126/science.1193270. [DOI] [PMC free article] [PubMed] [Google Scholar]
- Cui C, Elsam T, Tian Q, Seykora JT, Grachtchouk M, Dlugosz A, et al. Gli proteins up-regulate the expression of basonuclin in Basal cell carcinoma. Cancer Res. 2004;64:5651–8. doi: 10.1158/0008-5472.CAN-04-0801. [DOI] [PubMed] [Google Scholar]
- Engels EA, Frisch M, Goedert JJ, Biggar RJ, Miller RW. Merkel cell carcinoma and HIV infection. Lancet. 2002;359:497–8. doi: 10.1016/S0140-6736(02)07668-7. [DOI] [PubMed] [Google Scholar]
- Faust H, Pastrana DV, Buck CB, Dillner J, Ekstrom J. Antibodies to Merkel cell polyomavirus correlate to presence of viral DNA in the skin. J Infect Dis. 2011;203:1096–100. doi: 10.1093/infdis/jiq173. [DOI] [PubMed] [Google Scholar]
- Feng H, Shuda M, Chang Y, Moore PS. Clonal integration of a polyomavirus in human Merkel cell carcinoma. Science. 2008;319:1096–100. doi: 10.1126/science.1152586. [DOI] [PMC free article] [PubMed] [Google Scholar]
- Fernandez-Figueras MT, Puig L, Musulen E, Gilaberte M, Lerma E, Serrano S, et al. Expression profiles associated with aggressive behavior in Merkel cell carcinoma. Mod Pathol. 2007;20:90–101. doi: 10.1038/modpathol.3800717. [DOI] [PubMed] [Google Scholar]
- Foulongne V, Kluger N, Dereure O, Brieu N, Guillot B, Segondy M. Merkel cell polyomavirus and Merkel cell carcinoma, France. Emerg Infect Dis. 2008;14:1491–3. doi: 10.3201/eid1409.080651. [DOI] [PMC free article] [PubMed] [Google Scholar]
- Garneski KM, Warcola AH, Feng Q, Kiviat NB, Leonard JH, Nghiem P. Merkel cell polyomavirus is more frequently present in North American than Australian Merkel cell carcinoma tumors. J Invest Dermatol. 2009;129:246–8. doi: 10.1038/jid.2008.229. [DOI] [PMC free article] [PubMed] [Google Scholar]
- Garrison SR, Dietrich A, Stucky CL. TRPC1 contributes to light-touch sensation and mechanical responses in low-threshold cutaneous sensory neurons. J Neurophysiol. 2011 doi: 10.1152/jn.00658.2011. [DOI] [PMC free article] [PubMed] [Google Scholar]
- Gudjonsson JE, Ding J, Li X, Nair RP, Tejasvi T, Qin ZS, et al. Global gene expression analysis reveals evidence for decreased lipid biosynthesis and increased innate immunity in uninvolved psoriatic skin. J Invest Dermatol. 2009;129:2795–804. doi: 10.1038/jid.2009.173. [DOI] [PMC free article] [PubMed] [Google Scholar]
- Haeberle H, Fujiwara M, Chuang J, Medina MM, Panditrao MV, Bechstedt S, et al. Molecular profiling reveals synaptic release machinery in Merkel cells. Proc Natl Acad Sci U S A. 2004;101:14503–8. doi: 10.1073/pnas.0406308101. [DOI] [PMC free article] [PubMed] [Google Scholar]
- He H, Fang W, Liu X, Weiss LM, Chu PG. Frequent expression of glypican-3 in Merkel cell carcinoma: an immunohistochemical study of 55 cases. Appl Immunohistochem Mol Morphol. 2009;17:40–6. doi: 10.1097/PAI.0b013e31817b67d1. [DOI] [PubMed] [Google Scholar]
- Hers I, Vincent EE, Tavare JM. Akt signalling in health and disease. Cell Signal. 2011;23:1515–27. doi: 10.1016/j.cellsig.2011.05.004. [DOI] [PubMed] [Google Scholar]
- Houben R, Adam C, Baeurle A, Hesbacher S, Grimm J, Angermeyer S, et al. An intact retinoblastoma protein-binding site in Merkel cell polyomavirus large T antigen is required for promoting growth of Merkel cell carcinoma cells. Int J Cancer. 2012;130:847–56. doi: 10.1002/ijc.26076. [DOI] [PubMed] [Google Scholar]
- Houben R, Schrama D, Alb M, Pfohler C, Trefzer U, Ugurel S, et al. Comparable expression and phosphorylation of the retinoblastoma protein in Merkel cell polyoma virus-positive and negative Merkel cell carcinoma. Int J Cancer. 2010;126:796–8. doi: 10.1002/ijc.24790. [DOI] [PubMed] [Google Scholar]
- Iyer JG, Afanasiev OK, McClurkan C, Paulson K, Nagase K, Jing L, et al. Merkel Cell Polyomavirus-Specific CD8+ and CD4+ T-cell Responses Identified in Merkel Cell Carcinomas and Blood. Clin Cancer Res. 2011;17:6671–80. doi: 10.1158/1078-0432.CCR-11-1513. [DOI] [PMC free article] [PubMed] [Google Scholar]
- Kasper M, Jaks V, Hohl D, Toftgard R. Basal cell carcinoma - molecular biology and potential new therapies. J Clin Invest. 2012;122:455–63. doi: 10.1172/JCI58779. [DOI] [PMC free article] [PubMed] [Google Scholar]
- Kassem A, Schopflin A, Diaz C, Weyers W, Stickeler E, Werner M, et al. Frequent detection of Merkel cell polyomavirus in human Merkel cell carcinomas and identification of a unique deletion in the VP1 gene. Cancer Res. 2008;68:5009–13. doi: 10.1158/0008-5472.CAN-08-0949. [DOI] [PubMed] [Google Scholar]
- Katano H, Ito H, Suzuki Y, Nakamura T, Sato Y, Tsuji T, et al. Detection of Merkel cell polyomavirus in Merkel cell carcinoma and Kaposi's sarcoma. J Med Virol. 2009;81:1951–8. doi: 10.1002/jmv.21608. [DOI] [PubMed] [Google Scholar]
- Kennedy MM, Blessing K, King G, Kerr KM. Expression of bcl-2 and p53 in Merkel cell carcinoma. An immunohistochemical study. Am J Dermatopathol. 1996;18:273–7. doi: 10.1097/00000372-199606000-00006. [DOI] [PubMed] [Google Scholar]
- Kuhajda FP, Olson JL, Mann RB. Merkel cell (small cell) carcinoma of the skin: immunohistochemical and ultrastructural demonstration of distinctive perinuclear cytokeratin aggregates and a possible association with B cell neoplasms. Histochem J. 1986;18:239–44. doi: 10.1007/BF01676233. [DOI] [PubMed] [Google Scholar]
- Laga AC, Lai CY, Zhan Q, Huang SJ, Velazquez EF, Yang Q, et al. Expression of the embryonic stem cell transcription factor SOX2 in human skin: relevance to melanocyte and merkel cell biology. Am J Pathol. 2010;176:903–13. doi: 10.2353/ajpath.2010.090495. [DOI] [PMC free article] [PubMed] [Google Scholar]
- Larramendy ML, Koljonen V, Bohling T, Tukiainen E, Knuutila S. Recurrent DNA copy number changes revealed by comparative genomic hybridization in primary Merkel cell carcinomas. Mod Pathol. 2004;17:561–7. doi: 10.1038/modpathol.3800091. [DOI] [PubMed] [Google Scholar]
- Leonard JH, Cook AL, Van Gele M, Boyle GM, Inglis KJ, Speleman F, et al. Proneural and proneuroendocrine transcription factor expression in cutaneous mechanoreceptor (Merkel) cells and Merkel cell carcinoma. Int J Cancer. 2002;101:103–10. doi: 10.1002/ijc.10554. [DOI] [PubMed] [Google Scholar]
- Leonard JH, Hayard N. Loss of heterozygosity of chromosome 13 in Merkel cell carcinoma. Genes Chromosomes Cancer. 1997;20:93–7. doi: 10.1002/(sici)1098-2264(199709)20:1<93::aid-gcc14>3.0.co;2-g. [DOI] [PubMed] [Google Scholar]
- Moll I, Gillardon F, Waltering S, Schmelz M, Moll R. Differences of bcl-2 protein expression between Merkel cells and Merkel cell carcinomas. J Cutan Pathol. 1996;23:109–17. doi: 10.1111/j.1600-0560.1996.tb01283.x. [DOI] [PubMed] [Google Scholar]
- Nakayama T, Higuchi T, Oiso N, Kawada A, Yoshie O. Expression and function of FRA2/JUND in cutaneous T-cell lymphomas. Anticancer Res. 2012;32:1367–73. [PubMed] [Google Scholar]
- Paik JY, Hall G, Clarkson A, Lee L, Toon C, Colebatch A, et al. Immunohistochemistry for Merkel cell polyomavirus is highly specific but not sensitive for the diagnosis of Merkel cell carcinoma in the Australian population. Hum Pathol. 2011;42:1385–90. doi: 10.1016/j.humpath.2010.12.013. [DOI] [PubMed] [Google Scholar]
- Pastrana DV, Tolstov YL, Becker JC, Moore PS, Chang Y, Buck CB. Quantitation of human seroresponsiveness to Merkel cell polyomavirus. PLoS Pathog. 2009;5:e1000578. doi: 10.1371/journal.ppat.1000578. [DOI] [PMC free article] [PubMed] [Google Scholar]
- Paulson KG, Iyer JG, Tegeder AR, Thibodeau R, Schelter J, Koba S, et al. Transcriptome-wide studies of merkel cell carcinoma and validation of intratumoral CD8+ lymphocyte invasion as an independent predictor of survival. J Clin Oncol. 2011;29:1539–46. doi: 10.1200/JCO.2010.30.6308. [DOI] [PMC free article] [PubMed] [Google Scholar]
- Paulson KG, Lemos BD, Feng B, Jaimes N, Penas PF, Bi X, et al. Array-CGH reveals recurrent genomic changes in Merkel cell carcinoma including amplification of L-Myc. J Invest Dermatol. 2009;129:1547–55. doi: 10.1038/jid.2008.365. [DOI] [PMC free article] [PubMed] [Google Scholar]
- Penn I, First MR. Merkel's cell carcinoma in organ recipients: report of 41 cases. Transplantation. 1999;68:1717–21. doi: 10.1097/00007890-199912150-00015. [DOI] [PubMed] [Google Scholar]
- Peter M, Couturier J, Pacquement H, Michon J, Thomas G, Magdelenat H, et al. A new member of the ETS family fused to EWS in Ewing tumors. Oncogene. 1997;14:1159–64. doi: 10.1038/sj.onc.1200933. [DOI] [PubMed] [Google Scholar]
- Plaza JA, Suster S. The Toker tumor: spectrum of morphologic features in primary neuroendocrine carcinomas of the skin (Merkel cell carcinoma) Ann Diagn Pathol. 2006;10:376–85. doi: 10.1016/j.anndiagpath.2006.10.001. [DOI] [PubMed] [Google Scholar]
- Plettenberg A, Pammer J, Tschachler E. Merkel cells and Merkel cell carcinoma express the BCL-2 proto-oncogene. Exp Dermatol. 1996;5:183–8. doi: 10.1111/j.1600-0625.1996.tb00114.x. [DOI] [PubMed] [Google Scholar]
- Ramsay RG, Gonda TJ. MYB function in normal and cancer cells. Nat Rev Cancer. 2008;8:523–34. doi: 10.1038/nrc2439. [DOI] [PubMed] [Google Scholar]
- Saito YD, Jensen AR, Salgia R, Posadas EM. Fyn: a novel molecular target in cancer. Cancer. 2010;116:1629–37. doi: 10.1002/cncr.24879. [DOI] [PMC free article] [PubMed] [Google Scholar]
- Shuda M, Feng H, Kwun HJ, Rosen ST, Gjoerup O, Moore PS, et al. T antigen mutations are a human tumor-specific signature for Merkel cell polyomavirus. Proc Natl Acad Sci U S A. 2008;105:16272–7. doi: 10.1073/pnas.0806526105. [DOI] [PMC free article] [PubMed] [Google Scholar]
- Shuda M, Kwun HJ, Feng H, Chang Y, Moore PS. Human Merkel cell polyomavirus small T antigen is an oncoprotein targeting the 4E-BP1 translation regulator. J Clin Invest. 2011;121:3623–34. doi: 10.1172/JCI46323. [DOI] [PMC free article] [PubMed] [Google Scholar]
- Sihto H, Bohling T, Kavola H, Koljonen V, Salmi M, Jalkanen S, et al. Tumor Infiltrating Immune Cells And Outcome of Merkel Cell Carcinoma: A Population-based Study. Clin Cancer Res. 2012 doi: 10.1158/1078-0432.CCR-11-3020. [DOI] [PubMed] [Google Scholar]
- Sihto H, Kukko H, Koljonen V, Sankila R, Bohling T, Joensuu H. Merkel cell polyomavirus infection, large T antigen, retinoblastoma protein and outcome in Merkel cell carcinoma. Clin Cancer Res. 2011;17:4806–13. doi: 10.1158/1078-0432.CCR-10-3363. [DOI] [PubMed] [Google Scholar]
- Su LD, Fullen DR, Lowe L, Uherova P, Schnitzer B, Valdez R. CD117 (KIT receptor) expression in Merkel cell carcinoma. Am J Dermatopathol. 2002;24:289–93. doi: 10.1097/00000372-200208000-00001. [DOI] [PubMed] [Google Scholar]
- Tan PY, Chang CW, Chng KR, Wansa KD, Sung WK, Cheung E. Integration of regulatory networks by NKX3-1 promotes androgen-dependent prostate cancer survival. Mol Cell Biol. 2012;32:399–414. doi: 10.1128/MCB.05958-11. [DOI] [PMC free article] [PubMed] [Google Scholar]
- Tolstov YL, Pastrana DV, Feng H, Becker JC, Jenkins FJ, Moschos S, et al. Human Merkel cell polyomavirus infection II. MCV is a common human infection that can be detected by conformational capsid epitope immunoassays. Int J Cancer. 2009;125:1250–6. doi: 10.1002/ijc.24509. [DOI] [PMC free article] [PubMed] [Google Scholar]
- Van Gele M, Speleman F, Vandesompele J, Van Roy N, Leonard JH. Characteristic pattern of chromosomal gains and losses in Merkel cell carcinoma detected by comparative genomic hybridization. Cancer Res. 1998;58:1503–8. [PubMed] [Google Scholar]
- Van Keymeulen A, Mascre G, Youseff KK, Harel I, Michaux C, De Geest N, et al. Epidermal progenitors give rise to Merkel cells during embryonic development and adult homeostasis. J Cell Biol. 2009;187:91–100. doi: 10.1083/jcb.200907080. [DOI] [PMC free article] [PubMed] [Google Scholar]
- Waltari M, Sihto H, Kukko H, Koljonen V, Sankila R, Bohling T, et al. Association of Merkel cell polyomavirus infection with tumor p53, KIT, stem cell factor, PDGFR-alpha and survival in Merkel cell carcinoma. Int J Cancer. 2011;129:619–28. doi: 10.1002/ijc.25720. [DOI] [PubMed] [Google Scholar]
- Yu L, Harms PW, Pouryazdanparast P, Kim DS, Ma L, Fullen DR. Expression of the embryonic morphogen Nodal in cutaneous melanocytic lesions. Mod Pathol. 2010;23:1209–14. doi: 10.1038/modpathol.2010.101. [DOI] [PubMed] [Google Scholar]
Associated Data
This section collects any data citations, data availability statements, or supplementary materials included in this article.
Supplementary Materials
Supplemental figure S1. Genes with greatest differential expression between Merkel cell and cutaneous squamous cell carcinoma. All genes shown have adjusted p-value ≤ 0.05. Fold values are in log2. SCC: cutaneous squamous cell carcinoma. MCC: Merkel cell carcinoma. CL: Merkel cell carcinoma cell lines.
Supplemental figure S2. Gene groups differentially regulated in Merkel cell carcinoma relative to squamous cell carcinoma by parametric gene set enrichment analysis. (a) Analysis of genes upregulated in Merkel cell carcinoma reveals similarities to tumors including neuroblastoma. (b) Genes downregulated in MCC relative to SCC.
Supplemental figure S3. Principal component analysis of Merkel cell carcinoma transcriptional profiles relative to normal skin. Merkel cell carcinomas have a distinct expression profile compared to normal skin. Solid circles indicate normal skin. Open squares indicate Merkel cell carcinoma (MCC). PC1: principal component 1. PC2: principal component 2.
Supplemental figure S4. RT-PCR detection of Merkel cell polyomavirus T antigen and VP1 expression in Merkel cell carcinoma. Viral gene expression in cDNA prepared from tumor tissue was analyzed using primers targeting Merkel cell polyomavirus large T antigen and small T antigen (LTAg+STAg, primer pair TA1), small T antigen only (STAg, primer pair TA2), or viral capsid protein 1 (VP1). Atonal homolog 1 (ATOH1) is included as a control gene expressed in Merkel cell carcinoma. Beta-actin is included as a loading control. Patient and case numbers are as shown in Table 1.
Table S1. RNA expression of selected genes in Merkel cell carcinoma relative to squamous cell carcinoma. 1A central value for each probe-set was determined by averaging log-transformed data, and taking the anti-logarithm. A fold difference of ≥ 2.0 with adjusted p-value ≤ 0.05 was considered statistically significant.
Table S2. Selected functional classes, by gene ontology, for genes with significantly higher RNA expression in Merkel cell carcinoma relative to squamous cell carcinoma. 1MCC: Merkel cell carcinoma. 2SCC: squamous cell carcinoma.
Table S3. RNA expression of selected genes in Merkel cell carcinoma relative to basal cell carcinoma. 1A central value for each probe-set was determined by averaging log-transformed data, and taking the anti-logarithm. A fold difference of ≥ 2.0 with adjusted p-value ≤ 0.05 was considered statistically significant. Fold changes shown represent expression in Merkel cell carcinomas relative to basal cell carcinomas.
Table S4. RNA expression of selected genes in Merkel cell carcinoma relative to normal skin. 1A central value for each probe-set was determined by averaging log-transformed data, and taking the anti-logarithm. A fold difference of ≥ 2.0 with adjusted p-value ≤ 0.05 was considered statistically significant. Fold changes shown represent expression in Merkel cell carcinomas relative to normal skin.