

DHA-enriched fish oil enhances ex vivo B cell response to stimulation, and skews the host toward a systemic Th2 response.
Keywords: SMAD3, cytokines, IgA, inflammation
Abstract
DHA is a n-3 LCPUFA in fish oil that generally suppresses T lymphocyte function. However, the effect of fish oil on B cell function remains relatively understudied. Given the important role of B cells in gut immunity and increasing human fish oil supplementation, we sought to determine whether DFO leads to enhanced B cell activation in the SMAD−/− colitis-prone mouse model, similar to that observed with C57BL/6 mice. This study tested the hypothesis that DHA from fish oil is incorporated into the B cell membrane to alter lipid microdomain clustering and enhance B cell function. Purified, splenic B cells from DFO-fed mice displayed increased DHA levels and diminished GM1 microdomain clustering. DFO enhanced LPS-induced B cell secretion of IL-6 and TNF-α and increased CD40 expression ex vivo compared with CON. Despite increased MHCII expression in the unstimulated ex vivo B cells from DFO-fed mice, we observed no difference in ex vivo OVA-FITC uptake in B cells from DFO or CON mice. In vivo, DFO increased lymphoid tissue B cell populations and surface markers of activation compared with CON. Finally, we investigated whether these ex vivo and in vivo observations were consistent with systemic changes. Indeed, DFO-fed mice had significantly higher plasma IL-5, IL-13, and IL-9 (Th2-biasing cytokines) and cecal IgA compared with CON. These results support the hypothesis and an emerging concept that fish oil enhances B cell function in vivo.
Introduction
The n-3 LCPUFAs, found in fish oil, EPA, and DHA, are widely recognized as being significant regulators of inflammation with notable health benefits. Epidemiological studies provide evidence for the nutritional benefit of EPA and DHA in inflammation-associated pathologies, such as cardiovascular disease and rheumatoid arthritis [1]. Despite abundant in vitro research on the effects of n-3 LCPUFAs and inflammation, our understanding of dietary n-3 LCPUFAs on in vivo immunological outcomes is limited. Furthermore, there is a current gap in the literature about the effects of dietary n-3 LCPUFAs on B cell function.
B cells serve as a vital component of the immune system, and the absence of B cells in the immune system results in recurrent infection from childhood on, commonly in the respiratory and gastrointestinal tracts [2]. Whereas secretion of antibodies is a defining hallmark of B cell function, there is a growing appreciation for their contribution to inflammation via innate cytokine production [3–5]. It is increasingly apparent that B cell dysfunction can significantly contribute to the inflammatory milieu and perpetuate disease. Indeed, Rituximab treatment is clinically used to deplete B cells in chronic inflammatory diseases, showing potentially beneficial outcomes in nonautoantibody inflammatory pathologies, such as rheumatoid arthritis [6], multiple sclerosis [7], and Sjögren's syndrome [7]. Identification of antibody-independent mechanisms through which B cells contribute to inflammatory pathogenesis remains understudied. However, patients with ulcerative colitis and Crohn's disease have aberrant, increased expression of receptors on B cells, such as CD40 and B7, triggering inflammatory pathways [8], highlighting a putative pathway for B cell contribution to inflammatory pathogenesis.
Several proposed mechanisms of n-3 LCPUFAs include eicosanoid production, generation of proresolving mediators such as resolvins, altered gene expression, and influencing plasma membrane organization [9, 10]. Altered organization of the lipid membrane is an emerging and complex mechanism by which n-3 LCPUFAs impact immune cell function [11, 12]. Dietary fatty acid intake influences the fatty acid composition of the plasma membrane and can therefore modify lymphocyte function, in part, through the formation of sphingolipid/cholesterol-enriched lipid microdomains [13, 14]. Membrane organization may be of particular importance for signaling, as observed in the immunological synapse [15]. Recent studies have demonstrated that changes in lipid microdomain organization as a result of fish oil exposure were observed in parallel to altered immunological outcomes with B cells [16]. In contrast to an immunosuppressive phenotype observed in multiple in vitro experiments, the ex vivo changes in lipid microdomains were associated with an increase in TNF-α, IL-6, and IFN-γ production by B cells when stimulated with LPS [17]. These findings highlight the need to investigate in vivo immunological consequences of dietary fish oil consumption on B lymphocytes in several animal model systems.
Given the important role of B cells in gut immunology and increasing human supplementation and consumption of fish oil, we investigated the effect of dietary fish oil on B cells in a colitis-prone model. The natural progression of our work with the SMAD−/− mouse model has led us to investigate if previous observations with dietary fish oil on B cell function in C57BL/6 mice [17] remain consistent in the SMAD−/− mouse model. We first determined if dietary fish oil altered lipid microdomain clustering in the SMAD−/− mouse. Then, we tested the hypothesis that dietary DFO targets, ex vivo and in vivo, B cell function in SMAD−/− mice.
MATERIALS AND METHODS
Materials and chemicals
ACK lysing buffer was purchased from Invitrogen (Carlsbad, CA, USA), RPMI-medium 1640 was purchased from Sigma-Aldrich (St. Louis, MO, USA), and FBS was purchased from Gibco (Gaithersburg, MD, USA). Boron trifluoride-methanol for fatty acid methylation was purchased from Sigma-Aldrich. Standards and the RT-2560 column for gas chromatography were purchased from Restek (Bellefonte, PA, USA). The following fluorescent antibodies (clone) were purchased from eBioscience (San Diego, CA, USA): B220 (RA3-6B2), MHCII (M5/114.15.2), and CD40 (1C10). Purified CD16/CD32 (2.4G2) and the following fluorescent antibodies (clone) were purchased from BD Biosciences (San Diego, CA, USA): CD11c (HL3), MHCII (2G9), CD8a (53–6.7), CD11b (M1/70), Gr1 (RB6-8C5), CD80 (16-10A1), and CD86 (GL1). Chicken OVA conjugated to fluorescein (OVA-FITC) used for the antigen uptake assay was purchased from Molecular Probes (Eugene, OR, USA). CTxB conjugated to fluorescein and anti-CTxB used for lipid microdomain staining were purchased from Life Technologies (Carlsbad, CA, USA). LPS for the stimulation assay was purchased from Sigma-Aldrich.
Murine model
Smad3+/− and SMAD−/− breeder pairs (129-Smad3tm1Par/J) were generated in-house. Homozygous males and heterozygous females were mated to obtain SMAD−/− pups. Genotypes were confirmed by PCR. Mice were housed under SPF conditions in 152.4 cm2 plastic cages (maximum of five adult mice/cage) with microisolator lids in an Association for Assessment and Accreditation of Laboratory Animal Care-approved facility at Michigan State University (East Lansing, MI, USA). SPF conditions were assured through quarterly serology testing by Charles River Laboratories International (Wilmington, MA, USA) and in-house testing for ectoparasites, endoparasites, and fecal Helicobacter species (PCR). Full necropsies (including culture and sensitivity) were performed at least yearly on rodent-breeding colonies. Animal rooms were maintained at 23.3 ± 2.2°C with a 12-h light-dark cycle. Mice were fed nonpurified diets and sterile water ad libitum. Animal protocols were approved by the Michigan State University Institutional Animal Care and Use Committee.
Experimental design and diet composition
Thirty-eight SMAD−/− mice (age 4–6 weeks) were fed an AIN-93G-based (CON) standard chow (n=18) or a DFO diet (n=20) of similar composition to that described previously [18]. Briefly, the AIN-93G-based standard chow (TD.94045) was purchased from Harlan Teklad (Haslett, MI, USA). The AIN-93G-based premix diet without fat was purchased from Dyets (Bethlehem, PA, USA). The DHA-enriched fish oil (DHA4E1400 MEG-3 fish oil) used in the treatment diet was generously donated by Ocean Nutrition Canada (Dartmouth, Nova Scotia, Canada). Differing only in fat composition, both diets contained 7% fat by weight, providing 17% kcal from fat (0.637 kcal/g). The CON diet contains 7% (wt) soybean oil, and the DFO diet contains 1% (wt) corn oil (0.091 kcal/g) and 6% (wt) DHA-enriched fish oil (0.546 kcal/g). The DFO added to the treatment diet consisted of 54% DHA and 20% EPA, contributing 3.2% from DHA (0.294 kcal/g) and 1.2% from EPA (0.109 kcal/g) to the total 7% fat diet. Furthermore, the certificate of analysis also indicates that this food-grade fish oil is free of contaminants and oxidation. Supplemental Table 1 shows the fatty analysis of the prepared diets, which was analyzed with gas chromatography as described below. Animals were fed the experimental diets ad libitum for 5 weeks. At the end of the experiment, mice were asphyxiated with CO2 and exsanguinated through cardiac puncture using a heparin-coated syringe. Blood was collected on ice and centrifuged to obtain a red blood cell fraction and a plasma fraction to assess plasma cytokines.
B cell purification
Spleens were harvested from SMAD−/− mice, fed the CON or DFO diet and immediately placed in ice-cold RPMI supplemented with 10% FBS. The spleen was processed using a dounce homogenizer, pelleted, and washed in RPMI, as described previously [18]. Cells were briefly resuspended in ACK lysing buffer for red blood cell lysis, washed twice in RPMI, and passed through 70 μm filters. Cell counts were performed with a hemacytometer using trypan blue exclusion and resuspended to a concentration of 2 × 10⁷ cells/mL media. Negative selection was used to isolate a purified B cell population using BD IMag cell separation, per the manufacturer's protocol for their B Lymphocyte Enrichment Set system (BD Biosciences). Briefly, biotinylated antibodies against Ter-119, CD4, and CD43 were used to label unwanted cells (non-B cell populations), followed by subsequent incubation with streptavidin-magnetic beads. Lastly, incubation with the supplier's magnet separated the unwanted cells and permitted collection of the remaining B cells. Cells were counted using Trypan blue exclusion on a hemacytometer, resuspended at 1 × 10⁶ cells/mL, and stored on ice. The enriched population of cells was >90% B220-positive, confirming the B cell purification (Supplemental Fig. 1).
B cell fatty acid analysis
Lipid composition of purified B-lymphocytes was determined using gas chromatography. Total lipids were extracted from a minimum of 4 × 10⁶-purified B-lymphocytes using the Folch method [19]. Fatty acids were first methylated using boron trifluoride-methanol for 90 min at 100°C, followed by extraction of the FAMEs into hexane and separated by a 2010 Shimadzu capillary gas chromatographer (Shimadzu Scientific Instruments, Columbia, MD, USA) with a Restek RT-2560 column. The retention times of standards were used to identify FAME peaks. The areas under the FAME peaks were summed, and individual peak areas were expressed as a percentage of total peak area for a given treatment. All experiments were conducted with HPLC-grade organic solvents using stringent precautions to avoid oxidation as described previously [17].
B cell lipid microdomain staining
B cell lipid microdomain cross-linking was performed as previously described [20]. CTxB conjugated to FITC (CTxB-FITC) was diluted, per the manufacturer's protocol. An aliquot of 1 × 10⁶-purified B cells from each sample was stained with CTxB-FITC for 10 min, washed in PBS, and subsequently stained with anti-CTxB for 15 min to induce cross-linking of GM1 molecules. Samples were washed in PBS prior to fixation for 24 h in 4% formaldehyde. The samples were loaded into VitroTubes (VitroCom, Mountain Lakes, NJ, USA) and mounted onto microscope slides for visualization. With the use of an Olympus IX81 inverted microscope and a 100× objective, fluorescent images were obtained for 10 cells/animal (n=10 animals/group). Laser settings, detector, and image acquisition settings were saved and kept constant among samples. All analyses of lipid microdomains were conducted with blinded samples.
LPS stimulation of purified B cells
Purified B cells (2×10⁶)/sample were stimulated in 2 mL LPS-containing media overnight. Media for overnight cultures was RPMI 1640, supplemented with 5% FBS, 1% penicillin/streptomycin, 2 mM L-glutamine, 500 nM β-ME, and 1 μg/mL LPS. Cells were cultured at 37°C and 5% CO2 in a sterile incubator for 24 h. Cells were then placed on ice and centrifuged at 300 g and 4°C for 5 min, and supernatants were divided into aliquots and frozen at −80°C.
LPS-stimulated B cells were washed and resuspended in FACS buffer, followed by blocking with anti-FcRγII/II for 10 min on ice. The stimulated cells were subsequently stained for B220, MHCII, CD40, CD80, and CD86. All flow cytometric analyses were performed on a FACSCanto II (BD Biosciences) and analyzed using FlowJo (TreeStar, Ashland, OR, USA).
Supernatant cytokine production of IL-6, IFN-γ, and TNF-α was determined using MILLIPLEX MAG mouse cytokine/chemokine panel (Millipore, Billerica, MA, USA), per the manufacturer's protocol. Briefly, 25 μl standards, quality controls, and supernatant samples were loaded onto 96-well plates, followed by addition of 25 μl antibody-bound beads and 25 μl assay diluent and incubated at 4°C overnight on an orbital shaker. The next day, plates were washed and incubated with 25 μl detection antibody for 1 h at room temperature. Afterward, plates were washed and incubated with streptavidin-PE for 30 min at room temperature. Lastly, plates were washed and beads resuspended in sheath fluid and read on a Luminex 200 system.
Antigen uptake assay
Antigen uptake was measured in B cells isolated from the spleen, as described previously [21]. FITC-labeled OVA (OVA-FITC) was used as the model antigen. Briefly, 1 × 10⁶ B cells were incubated in polystyrene tubes containing 100 μl 50 μg/mL OVA-FITC in RPMI 1640, supplemented with 10% FBS. At the end of the incubation period, cells were placed on ice and diluted with 2 mL FACS buffer to suspend metabolic processes, including uptake. Cells were washed and resuspended in FACS buffer for further staining. All samples were stained for B220 to confirm purity. All flow cytometric analyses were performed as described above.
In vivo B cell analysis
For in vivo lymphocyte analysis, spleens, MsLNs, and PPs were removed and placed in ice-cold RPMI at the time of necropsy. Tissues were processed with a dounce homogenizer, pelleted, and washed in RPMI, as described previously [18]. Cells were resuspended briefly in ACK lysing buffer, washed twice in RPMI, and passed through 70-μm filters. Cell counts were performed with a hemacytometer using trypan blue exclusion and resuspended to a concentration of 2 × 10⁷ cells/mL media. Afterward, aliquots of the cells were washed and resuspended in FACS buffer, 0.1% sodium azide, and 1.0% FBS in PBS and blocked with anti-FcRγII/II for 10 min on ice. Cells were subsequently stained for B220, CD11b, CD11c, GR1, CD8a, and MHCII and analyzed with flow cytometry.
Plasma cytokine analysis
Plasma was used to assess systemic cytokine concentrations. Plasma concentrations of IL-5, IL-13, and IL-9 were determined using MILLIPLEX MAP mouse cytokine/chemokine panel (Millipore), per the manufacturer's protocol and described above.
Fecal IgA ELISA
Prior to protein extraction, the contents of the cecum from mice fed the CON or DFO diets were snap-frozen on dry ice and stored at −80°C. The cecal contents were thawed and placed immediately in PBS containing protease inhibitors (cOmplete mini protease inhibitor cocktail tablets, Roche Applied Science, Indianapolis, IN, USA) at a concentration of 25% w/v. Samples were vortexed vigorously for 10 min or until cecal contents were resuspended completely before being spun at 16,000 g for 10 min. The supernatants were collected in separate tubes, centrifuged a second time, and the final supernatant collected. Mouse IgA ELISA quantitation set (Bethyl Laboratories, Montgomery, TX, USA) was used to analyze the cecal content protein for IgA. Standards were prepared, per the manufacturer's protocol, samples were diluted 1:750 in sample diluent, and the plate was read at 450 nm on a Synergy HT Multi-Mode microplate reader (BioTek, Winooski, VT, USA).
Statistical analysis
Flow cytometric analyses were reported as percentage of total lymphocytes when comparing populations or as MFI when comparing cell surface marker expression. With the use of NIH ImageJ software, measurements of lipid microdomain size were obtained with blinded samples as described previously [20]. Briefly, NIH ImageJ was used to analyze particles ≥0.1 μm2; smaller sizes could not be measured accurately. The Feret's diameter was calculated for each particle, and all particles of a given cell were averaged. Subsequently, individual cell averages were then averaged for a given animal (n=10 cells/animal, and n=10 animals/group).
All reported values are means ± sem. Statistical significance was set at P < 0.05. Normally distributed data (i.e., data that were assumed Gaussian and passed the Kolmogorov-Smirnov test) were statistically analyzed using a Student's t-test for significant differences in cell phenotyping, fatty acid analysis, lipid microdomain staining, and cecal IgA quantification between CON- and DFO-fed mice. A two-way, repeated measures ANOVA was used to assess the differences in antigen uptake between CON and DFO mice over time. As a result of non-normal distributions of the data obtained from the cytokine assay, Mann-Whitney U tests were used to test for significant differences in the plasma cytokines and supernatant cytokines of LPS-stimulated B cells between CON- and DFO-fed mice. All statistical analyses were performed using GraphPad Prism (GraphPad Software, La Jolla, CA, USA).
RESULTS
DFO diet alters B cell lipid composition
The aim of this study was to investigate the effect of fish oil on B cell membrane organization, function, and phenotypic outcomes. We first sought to demonstrate that DFO feeding resulted in alterations in the lipid membrane of B cells prior to demonstration of altered membrane organization. Total lipids were extracted from purified B cells to confirm incorporation of dietary n-3 LCPUFAs into B cells. After a 5-week diet regimen, total lipids from purified B cells of DFO-fed mice contained significantly less 18:0 (CON: 20.0%; DFO: 17.0%) and 20:4 (n-6; CON: 18.2%; DFO: 6.8%) but significantly more 20:5 (n-3; CON: 0.2%; DFO: 5.5%), 22:5 (n-3; CON: 1.1%; DFO: 2.6%), and 22:6 (n-3; CON: 3.7%; DFO: 10.2%) compared with the CON-fed mice. These changes resulted in an overall significant decrease of total SFAs (CON: 41.8%; DFO: 40.4%) and total n-6 PUFAs (CON: 33.3%; DFO: 21.1%) and a significant increase of total n-3 PUFAs (CON: 6.2%; DFO: 19.6%) in DFO-fed mice compared with the CON-fed mice (Table 1).
Table 1. Dietary DFO Alters the Acyl Chain Composition of B Cells.
| Fatty acid | CON | DFO |
|---|---|---|
| 14:0 | 0.1 ± 0.0 | 0.2 ± 0.1 |
| 16:0 | 21.7 ± 0.5 | 23.2 ± 0.4 |
| 18:0 | 20.0 ± 0.2 | 17.0 ± 0.1*** |
| 18:1 trans | 0.1 ± 0.0 | 0.1 ± 0.0 |
| 18:1 cis | 17.3 ± 0.2 | 16.7 ± 0.5 |
| 18:2 (n-6) | 15.0 ± 0.2 | 14.4 ± 0.3 |
| 18:3 (n-6) | 0.0 ± 0.0 | 0.1 ± 0.0 |
| 18:3 (n-3) | 1.2 ± 0.0 | 1.2 ± 0.1 |
| 20:4 (n-6) | 18.2 ± 0.3 | 6.8 ± 0.1*** |
| 20:5 (n-3) | 0.2 ± 0.0 | 5.5 ± 0.2*** |
| 22:5 (n-3) | 1.1 ± 0.0 | 2.6 ± 0.1*** |
| 22:6 (n-3) | 3.7 ± 0.1 | 10.2 ± 0.4*** |
| ∑SFA | 41.8 ± 0.4 | 40.4 ± 0.4* |
| ∑MUFA | 18.7 ± 0.2 | 18.7 ± 0.5 |
| ∑PUFA (n-3) | 6.2 ± 0.1 | 19.6 ± 0.7*** |
| ∑PUFA (n-6) | 33.3 ± 0.4 | 21.1 ± 0.2*** |
Data are mean ± sem reported as percent total, n = 5. A Student's t-test was used to compare differences between CON and DFO B cell fatty acid composition. MUFA, Monounsaturated fatty acid. Significant differences: ***P < 0.001; *P < 0.05.
DFO diminishes lipid microdomain clustering
Previous studies have shown that exposure of B cells to dietary menhaden fish oil or exposure of T-lymphomas to DHA in vitro diminishes lipid microdomain clustering, which makes the domains appear larger in size on a micron scale [17, 20]. With the use of DFO (>50% DHA/wt), we sought to confirm that dietary exposure to DHA (primarily) targeted lipid microdomain size ex vivo concomitantly with altered lipid composition in the 129 background SMAD−/− mice. We measured changes in lipid microdomain size with the DFO diet relative to the CON diet using confocal microscopy. Figure 1A shows representative fluorescent images of clusters on B cells isolated from CON (left)- or DFO (right)-fed mice. The DFO diet clearly diminishes microdomain clustering. The clusters on B cells from mice fed the DFO diet were, on average, 0.275 μm larger (22% larger) compared with CON-fed mice (Fig. 1B).
Figure 1. Lipid microdomain organization in B cells from SMAD−/− mice.

(A) Representative fluorescent images of lipid microdomains on purified B cells from SMAD−/− mice fed the CON (left) or DFO (right) diet. Cells were stained with CTxB conjugated to FITC for visualization of clustered GM1 molecules. (B) Lipid microdomain size on a micron scale, measured with the feret's diameter, of purified B cells from SMAD−/− fed the CON (open bar) or DFO (solid bar) diet. Data are represented as mean ± sem; n = 10. Data indicate significant differences between the DFO diet and the CON diet: ***P < 0.001.
DFO alters B cell activation but not antigen uptake
Increased lipid microdomain size was previously observed concomitantly with an enhanced ex vivo B cell response to stimulation. To test this in our model, LPS, a TLR4 agonist and a T-independent antigen, was used to stimulate B cells from DFO-fed mice. After 24 h stimulation with 1 μg/mL LPS, we stained for cell surface markers of activation (CD40, CD80, CD86, and MHCII). LPS-stimulated, purified B cells from DFO-fed mice had significantly increased CD40 expression (16%), but there was no change in CD80, CD86, and MHCII expression (Fig. 2A). All stimulations resulted in increased MFIs compared with the unstimulated baseline; however, only MHCII was significantly different at baseline (P<0.05; data not shown).
Figure 2. Expression of surface markers associated with cell signaling and cytokine production in LPS-stimulated, purified B cells from SMAD−/− mice.

Aliquots of splenic B cells, purified using negative selection and identified above as B220+, were cultured for 24 h in media containing 1 μg/mL LPS. (A) Cell surface marker expression of LPS-stimulated B cells in SMAD−/− mice fed the CON (open bars) or DFO (solid bars) diet. (B) Cytokine production in the supernatants of LPS-stimulated B cells from SMAD−/− mice fed the CON or DFO diet was assayed. Data are represented as mean ± sem; n = 8–10. Data indicate significant differences between the DFO diet and the CON diet: *P < 0.05; **P < 0.01.
Furthermore, we assayed the supernatants from the LPS-stimulated B cells to determine if there were differences in cytokine production. There was a significant increase in IL-6 (50%) and a nonsignificant (P=0.052) increase in TNF-α production (40%) in DFO-fed mice compared with CON-fed mice. We were unable to detect IFN-γ production (Fig. 2B).
Antigen uptake is the initial step required by an APC to further initiate immunological outcomes via cell signaling. To determine whether a DFO diet alters this capacity in B cells, we incubated purified B cells with OVA-FITC. Despite overall increases of OVA-FITC uptake over time, no significant differences in OVA-FITC uptake between B cells from DFO-fed mice and B cells from CON-fed mice were detected (Fig. 3).
Figure 3. Uptake of OVA as a model antigen in purified B cells from SMAD−/− mice.
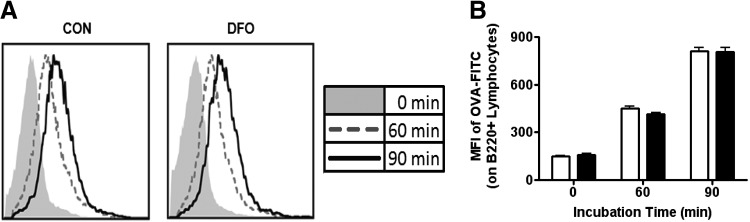
Aliquots of B cells were resuspended with 50 μg/mL OVA conjugated to FITC (OVA-FITC) at 37°C for 0, 60, and 90 min before being placed on ice. Purified B cells were negatively selected from the spleens of SMAD−/− fed the CON (open bars) diet or the DFO (solid bars) diet. (A) Representative histograms displaying the change in fluorescence over time after incubation with OVA-FITC in CON (left)- and DFO (right)-fed SMAD−/− mice B cells. (B) Change in MFI of OVA-FITC on purified B cells over time. Data are represented as mean ± sem; n = 10.
DFO increases B cell populations and surface markers of activation
The next set of experiments investigated the effect DFO feeding has on in vivo systemic immunological outcomes. We examined in vivo the percent of B cells in multiple lymphatic tissues and expression of functional surface markers. Use of B220 as a pan-B cell marker revealed significant in vivo B cell differences in DFO-fed mice compared with CON-fed mice. There was a significant increase in B220+ MHCII+ lymphocytes in the MsLNs (2.0-fold change) and the PPs (1.18-fold change) of DFO-fed mice compared with CON-fed mice (Fig. 4).
Figure 4. In vivo distribution of B220+ MHCII+ lymphocytes in varying tissues of SMAD−/− mice.
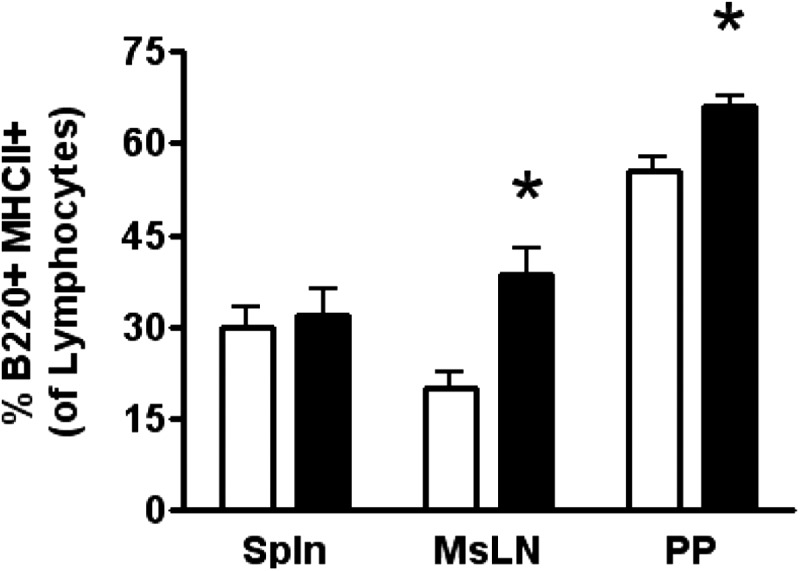
Flow cytometry was performed on the spleen (Spln), MsLN, and PP of SMAD−/− mice fed the CON (open bars) diet or the DFO (solid bars) diet. Represented as a percentage of total lymphocytes, B220+ MHCII+ lymphocytes of dounce-homogenized tissues were identified. Data are represented as mean ± sem; n = 3–5. Data indicate significant differences: *P < 0.05.
To further refine B cell populations, we gated on Gr1− CD8a− B220+ MHCII+ lymphocytes leading to two distinct phenotypes, denoted B220hi and B220lo B cells. The MFI of MHCII on B220hi B cells was 45% higher in the spleen of DFO-fed mice compared with CON-fed mice (Fig. 5A). The MFI of MHCII on B220lo B cells was 41% higher in the spleen and 50% higher in the MsLNs of DFO-fed mice compared with CON-fed mice (Fig. 5B). The MFI of CD11c on B220hi B cells was 37% higher in the spleen, 56% higher in the MsLNs, and 88% higher in the PPs of DFO-fed mice compared with CON-fed mice (Fig. 5C). The MFI of CD11c on B220lo B cells was 33% higher in the spleen, 66% higher in the MsLNs, and 60% higher in the PPs of DFO-fed mice compared with CON-fed mice (Fig. 5D).
Figure 5. Surface marker expression on B cells from SMAD−/− mice.

An in vivo characterization was performed on the spleen, MsLNs, and PPs of SMAD−/− mice fed the CON (open bars) diet or the DFO (solid bars) diet. The MFI of MHCII and CD11c was determined on B cells, identified as CD8a− Gr1− B220+ MHCII+ lymphocytes. (A) Staining for MHCII on B220hi B cells. (B) Staining for MHCII on B220lo B cells. (C) Staining for CD11c on B220hi B cells. (D) Staining for CD11c on B220lo B cells. Data are represented as mean ± sem; n = 3–5. Data indicate significant differences: *P < 0.05; **P < 0.01; ***P < 0.001.
DFO increases plasma cytokines and fecal IgA
The increase in B cells in the lymphoid tissues and the increased expression of MHCII and CD11c prompted further investigation of in vivo immunological outcomes. Plasma cytokines were assayed specifically for Th2-biasing cytokines as a result of their propensity for B cell growth and proliferation [22]. Indeed, the plasma of DFO-fed mice had significantly higher levels of IL-5 (237.5%) and IL-13 (273%). IL-9 was only detectable in the plasma of DFO- but not CON-fed mice (Fig. 6A). Plasma IL-1β, IL-2, IFN-γ, and TNF-α were not detectable; IL-6 did not differ between groups (data not shown).
Figure 6. Systemic immunological outcomes of SMAD−/− mice fed CON or DFO diets.

(A) Th2-associated cytokines from the plasma of SMAD3−/− mice fed the CON (open bars) or DFO (solid bars) diet. Plasma samples were assayed using a MILLIPLEX MAP mouse cytokine/chemokine assay. (B) Secretory IgA in the cecal contents of SMAD−/− mice fed the CON (open bar) diet or the DFO (solid bar) diet. Cecal contents were homogenized with protease inhibitors and spun twice at 16,000 g to remove debris. Supernatants were analyzed using ELISA. Data are represented as mean ± sem, (A) n = 7–8; (B) n = 4–5. Data indicate significant differences between the DFO diet and the CON diet: *P < 0.05.
The apparent skewing toward a Th2 response encouraged the investigation of systemic, functional endpoints of in vivo B cell function. Furthermore, the increased B cell populations and increased surface marker expression in the MsLNs and PPs indicate that secretory IgA levels, the predominant gut Ig, might be altered by DFO feeding. Cecal IgA was significantly higher in DFO-fed mice (343%) compared with CON mice after 5 weeks of feeding (Fig. 6B).
DISCUSSION
The purpose of this study was to investigate the changes that DFO feeding elicits on B cells, an understudied yet important cell population with respect to inflammatory pathologies. The rationale of the present study was to investigate the generalizability of previous observations, suggesting that DHA/fish oil enhance B cell function in C57BL/6 mice, while progressing our laboratory's research on dietary fish oil exposure in SMAD−/− mice. Our data suggest an overall increase in the activation of B cells in varying lymphoid tissues when exposed to DFO. Consistent with previous studies, splenic B cells from the fish oil-fed mice revealed that n-3 LCPUFAs targeted B cell lipid microdomain clustering/size, leading to putative changes in membrane order and cell signaling [17, 20]. Ex vivo stimulation of B cells from DFO-fed mice increased cell surface markers for cell signaling and increased cytokine secretion, despite no change in antigen uptake. In vivo characterization of B cells from lymphoid tissues showed altered population phenotype and up-regulation of select functionally associated molecules. These population-specific changes were observed in parallel with systemic alterations in the cytokine profile and humoral immunity.
DFO and the membrane
Lipid-protein organization is emerging as a mechanism through which n-3 LCPUFAs exert their pleiotropic effects. We observed changes in the lipid composition of B cells by feeding DFO to SMAD−/− mice (Table 1) and a change in the distribution of microdomains (Fig. 1). These data are consistent with recent publications, where DHA targeted lipid microdomain clustering in EL4 T lymphomas when treated with DHA in vitro [20], and of purified B cells from mice fed a diet containing menhaden fish oil [17]. Furthermore, a recent study showed that DHA was more effective than EPA in increasing lipid microdomain size [23]. These data suggest a commonality in the mechanism by which fish oil targets lymphocytes across different murine models, however the immunological outcomes of fish oil on these lymphocytes, specifically B cells, are not yet completely understood. Mechanistically, it is unclear how the change in lipid microdomain clustering promotes B cell activation. We are currently pursuing the underlying mechanisms using a combination of techniques. One possibility is that DHA may be diminishing microdomain clustering by promoting changes in cholesterol lateral distribution and subsequently affecting protein clustering and downstream signaling [24].
Ex vivo studies
Earlier investigations examining the effect of in vitro fish oil exposure on Raji B cells demonstrate decreased cytokine production and inflammatory gene expression [25, 26]. More recently, studies using other B cell lines have also demonstrated decreased cytokine production [16] and decreased proinflammatory gene expression through inhibition of TLR4 signaling [27] after in vitro DHA exposure. Whereas fish oil is generally considered immunosuppressive, an observation by Rockett et al. [16] highlighted differential outcomes between B cells exposed in vitro to n-3 PUFAs and dietary fish oil exposure in vivo. Thus, the differences between our study and previous work may be a result of use of in vitro versus in vivo exposure to n-3 fatty acids.
B cells from mice fed DFO, stimulated with LPS, had increased CD40 expression compared with the CON (Fig. 2A). Whereas we observed no change in MHCII, CD80, or CD86 expression between groups, this is consistent with a recent study with C57BL/6 mice [16]. CD40 is a protein that is expressed on APCs, and its ligation by CD40 ligand plays a significant role in B cell activation and antibody production. Rockett et al. [16] had observed an increase in B cell CD69 expression with fish oil in response to LPS. Although it is unclear whether the increased expression of CD40 and CD69 is congruent between models, it is interesting that these molecules are both associated with activation and downstream cell signaling.
Our observations of increased IL-6 and TNF-α (P=0.052) also remain consistent with the study by Rockett et al. [16] (Fig. 2B); however, we were unable to detect IFN-γ in the supernatants from the LPS-stimulated B cells. Taken together with the increased surface marker expression of CD40, it is reasonable to assume that the B cells from the DFO-fed mice are more activated and may suggest increased potential immunogenicity.
Despite no difference in MHCII expression after LPS stimulation between groups, there was a significant increase of MHCII expression on unstimulated B cells from DFO-fed mice (data not shown; P<0.05). B cells are capable of receptor-mediated pinocytosis/endocytosis, allowing for uptake of soluble proteins [28]. Evidence for B cells to perform phagocytosis is beginning to emerge [28, 29]. We observed no difference in antigen uptake between the B cells from CON- or DFO-fed mice (Fig. 3). This appears consistent with literature suggesting no change in splenic neutrophil and monocytes phagocytosis after DHA supplementation [30] but is inconsistent with previous assertions that changes in the plasma membrane alter phagocytic capacity [31]. Additional work is needed to determine whether antigen processing is altered in B cells of DFO-fed mice and what the functional significance of increased MHCII expression entails.
In vivo studies
The activated B cell phenotype, ex vivo in response to DFO feeding, led us to determine if in vivo changes also reflect an activated phenotype. The data revealed significantly increased B220+ MHCII+ cells in the MsLNs and PPs of DFO-fed SMAD−/− mice (Fig. 4). Previous work with dietary fish-oil feeding shows a decrease in expression of functionally associated proteins in unstimulated mice peritoneum cells [32], human monocytes [33], and rat DCs [34]. Our in vivo analyses of the B cells from SMAD−/− mice fed DFO show increases in expression of MHCII (consistent with our ex vivo observations) and CD11c on varying lymphoid tissues (Fig. 5). The contrast to previous literature may be a result of the different type of fish oil used in the present study. This finding appears in agreement with data about MHC class I expression on EL4 cells treated with DHA in vitro [20]. These observations may suggest that DHA specifically increases expression of MHC molecules on lymphocytes.
Further investigation at the systemic level revealed that mice fed DFO had increased (IL-5 and IL-13) or detectable (IL-9) Th2 cytokines circulating in the plasma prior to any challenge compared with CON mice (Fig. 6A). Despite the functional redundancy among Th2 cytokines [22], these cytokines play a significant role in effector function during a Th2 response with specific respect to B cell function. For example, IL-5 is a required cytokine for certain B cells to elicit maximal Th cell-dependent responses [35], as well as promotion of IgA secretion [36]. IL-9 can increase innate-like B cell growth [37] and potentiate IgE and IgG1 release from B cells [38]. IL-13 can elicit stimulated cells to increase production of IgM, IgG1, IgG2a, IgG2b, and IgG3 [39], while inducing IgE production and increasing MHCII expression [40].
Consistent with increased B cell numbers in gut-associated lymphoid tissues and the stimulatory effect of IL-5 on B cell function, we observed a significant increase of secretory IgA in the feces of DFO-fed mice (Fig. 6B). The data on antibody production remain inconsistent; a previous study had observed no change in IgG2a or IgA after feeding DFO and challenge with an enteric infection [41], whereas Ramon and colleagues [42] very recently reported that administration of DHA-derived proresolving mediators of inflammation increased B cell antibody production, specifically IgG and IgM production.
Implications
The work presented here, in collaboration with our previous work [16, 17], suggests a novel role for fish oil in targeting humoral immunity. Enhanced humoral immunity could have beneficial and deleterious implications, depending on the population that is consuming the fish oil. Elucidating the functional and mechanistic effects of fish oil on B cells is critical, given that immunocompromised populations may benefit, whereas others may not. Our data are of significance, as they show that results recently reported for C57BL/6 mice are reproducible in a different genetic background. It is increasingly accepted that these EPA/DHA-derived mediators have an impact on enhancing the recruitment of monocytes to sites of inflammation and even increasing their phagocytic activity [43]. Thus, fish oil-enhanced B cell activation may aid immune responses associated with pathogen clearance, likely up-regulating the resolution phase of inflammation and dampening the totality of the inflammatory response. The current study suggests that dietary DFO increases B cell activation, likely benefiting situations where the host is challenged and a humoral response is required, such as a parasitic infection, revealing potential clinical utility of dietary DFO. It would be appropriate to further study the systemic Ig changes of DFO feeding to confirm the putative changes that the Th2 cytokine profile elicits. These findings highlight the need for additional in vivo n-3 LCPUFA research to fully understand the phenotypic, functional, and mechanistic basis for n-3 LCPUFA B cell immunomodulation.
ACKNOWLEDGMENTS
Financial support for this research was provided by the U.S. National Institutes of Health grants R03CA162427 (to J.I.F.) and R15AT006122 (to S.R.S.).
SEE CORRESPONDING EDITORIAL ON PAGE 457
The online version of this paper, found at www.jleukbio.org, includes supplemental information.
- −/−
- deficient
- ACK
- ammonium-chloride-potassium
- CON
- control
- CTxB
- cholera toxin subunit B
- DFO
- docosahexaenoic acid-enriched fish oil
- DHA
- docosahexaenoic acid
- EPA
- eicosapentaenoic acid
- FAME
- fatty acid methyl ester
- LCPUFA
- long-chain polyunsaturated fatty acid
- MFI
- mean fluorescence intensity
- MsLN
- mesenteric LN
- n-3/6
- omega-3/6
- PP
- Peyer's patches
- PUFA
- polyunsaturated fatty acid
- SFA
- saturated fatty acid
- Smad3
- mothers against decapentaplegic homolog-3
- SPF
- specific pathogen-free
AUTHORSHIP
J.I.F., S.R.S., and E.A.G. designed the research, interpreted results, and wrote the paper. E.A.G. and J.C. performed B cell purification and ex vivo experiments. E.A.G. provided flow cytometry analyses and confocal image acquisition. M.H. performed fatty acid analysis. H.T. performed image analysis. All authors reviewed and provided input toward the final paper. J.I.F. was responsible for the final content.
REFERENCES
- 1. Harris W. S., Mozaffarian D., Lefevre M., Toner C. D., Colombo J., Cunnane S. C., Holden J. M., Klurfeld D. M., Morris M. C., Whelan J. (2009) Towards establishing dietary reference intakes for eicosapentaenoic and docosahexaenoic acids. J. Nutr. 139, 804S–819S [DOI] [PMC free article] [PubMed] [Google Scholar]
- 2. Hermaszewski R. A., Webster A. D. B. (1993) Primary hypogammaglobulinemia—a survey of clinical manifestations and complications. Q. J. Med. 86, 31–42 [PubMed] [Google Scholar]
- 3. Lund F. E. (2008) Cytokine-producing B lymphocytes—key regulators of immunity. Curr. Opin. Immunol. 20, 332–338 [DOI] [PMC free article] [PubMed] [Google Scholar]
- 4. Barr T. A., Brown S., Ryan G., Zhao J., Gray D. (2007) TLR-mediated stimulation of APC: distinct cytokine responses of B cells and dendritic cells. Eur. J. Immunol. 37, 3040–3053 [DOI] [PMC free article] [PubMed] [Google Scholar]
- 5. Harris D. P., Haynes L., Sayles P. C., Duso D. K., Eaton S. M., Lepak N. M., Johnson L. L., Swain S. L., Lund F. E. (2000) Reciprocal regulation of polarized cytokine production by effector B and T cells. Nat. Immunol. 1, 475–482 [DOI] [PubMed] [Google Scholar]
- 6. Edwards J. C. W., Szczepanski L., Szechinski J., Filipowicz-Sosnowska A., Emery P., Close D. R., Stevens R. M., Shaw T. (2004) Efficacy of B-cell-targeted therapy with rituximab in patients with rheumatoid arthritis. N. Engl. J. Med. 350, 2572–2581 [DOI] [PubMed] [Google Scholar]
- 7. Gurcan H. M., Keskin D. B., Stern J. N. H., Nitzberg M. A., Shekhani H., Ahmed A. R. (2009) A review of the current use of rituximab in autoimmune diseases. Int. Immunopharmacol. 9, 10–25 [DOI] [PubMed] [Google Scholar]
- 8. Polese L., Angriman I., Scarpa M., Norberto L., Sturniolo G. C., Cecchetto A., Ruffolo C., D'Amico D. F. (2003) Role of CD40 and B7 costimulators in inflammatory bowel diseases. Acta Biomed. 74 (Suppl. 2), 65–70 [PubMed] [Google Scholar]
- 9. Stulnig T. M. (2003) Immunomodulation by polyunsaturated fatty acids: mechanisms and effects. Int. Arch. Allergy Immunol. 132, 310–321 [DOI] [PubMed] [Google Scholar]
- 10. Serhan C. N., Chiang N., Van Dyke T. E. (2008) Resolving inflammation: dual anti-inflammatory and pro-resolution lipid mediators. Nat. Rev. Immunol. 8, 349–361 [DOI] [PMC free article] [PubMed] [Google Scholar]
- 11. Yaqoob P. (2009) The nutritional significance of lipid rafts. Annu. Rev. Nutr. 29, 257–282 [DOI] [PubMed] [Google Scholar]
- 12. Assarsson E., Kambayashi T., Persson C. M., Ljunggren H. G., Chambers B. J. (2005) 2B4 co-stimulation: NK cells and their control of adaptive immune responses. Mol. Immunol. 42, 419–423 [DOI] [PubMed] [Google Scholar]
- 13. Stillwell W., Shaikh S. R., Zerouga M., Siddiqui R., Wassall S. R. (2005) Docosahexaenoic acid affects cell signaling by altering lipid rafts. Reprod. Nutr. Dev. 45, 559–579 [DOI] [PubMed] [Google Scholar]
- 14. Stillwell W., Wassall S. R. (2003) Docosahexaenoic acid: membrane properties of a unique fatty acid. Chem. Phys. Lipids 126, 1–27 [DOI] [PubMed] [Google Scholar]
- 15. Kim W., Fan Y. Y., Barhoumi R., Smith R., McMurray D. N., Chapkin R. S. (2008) n-3 polyunsaturated fatty acids suppress the localization and activation of signaling proteins at the immunological synapse in murine CD4+ T cells by affecting lipid raft formation. J. Immunol. 181, 6236–6243 [DOI] [PMC free article] [PubMed] [Google Scholar]
- 16. Rockett B. D., Salameh M., Carraway K., Morrison K., Shaikh S. R. (2010) n-3 PUFA improves fatty acid composition, prevents palmitate-induced apoptosis, and differentially modifies B cell cytokine secretion in vitro and ex vivo. J. Lipid Res. 51, 1284–1297 [DOI] [PMC free article] [PubMed] [Google Scholar]
- 17. Rockett B. D., Teague H., Harris M., Melton M., Williams J., Wassall S. R., Shaikh S. R. (2012) Fish oil increases raft size and membrane order of B cells accompanied by differential effects on function. J. Lipid Res. 53, 674–685 [DOI] [PMC free article] [PubMed] [Google Scholar]
- 18. Woodworth H. L., McCaskey S. J., Duriancik D. M., Clinthorne J. F., Langohr I. M., Gardner E. M., Fenton J. I. (2010) Dietary fish oil alters T lymphocyte cell populations and exacerbates disease in a mouse model of inflammatory colitis. Cancer Res. 70, 7960–7969 [DOI] [PubMed] [Google Scholar]
- 19. Folch J., Lees M., Sloane Stanley G. H. (1957) A simple method for the isolation and purification of total lipides from animal tissues. J. Biol. Chem. 226, 497–509 [PubMed] [Google Scholar]
- 20. Shaikh S. R., Rockett B. D., Salameh M., Carraway K. (2009) Docosahexaenoic acid modifies the clustering and size of lipid rafts and the lateral organization and surface expression of MHC class I of EL4 cells. J. Nutr. 139, 1632–1639 [DOI] [PubMed] [Google Scholar]
- 21. West M. A., Wallin R. P., Matthews S. P., Svensson H. G., Zaru R., Ljunggren H. G., Prescott A. R., Watts C. (2004) Enhanced dendritic cell antigen capture via Toll-like receptor-induced actin remodeling. Science 305, 1153–1157 [DOI] [PubMed] [Google Scholar]
- 22. Fallon P. G., Jolin H. E., Smith P., Emson C. L., Townsend M. J., Fallon R., Smith P., McKenzie A. N. J. (2002) IL-4 induces characteristic Th2 responses even in the combined absence of IL-5, IL-9, and IL-13. Immunity 17, 7–17 [DOI] [PubMed] [Google Scholar]
- 23. Williams J. A., Batten S. E., Harris M., Rockett B. D., Shaikh S. R., Stillwell W., Wassall S. R. (2012) Docosahexaenoic and eicosapentaenoic acids segregate differently between raft and nonraft domains. Biophys. J. 103, 228–237 [DOI] [PMC free article] [PubMed] [Google Scholar]
- 24. Shaikh S. R. (2012) Biophysical and biochemical mechanisms by which dietary N-3 polyunsaturated fatty acids from fish oil disrupt membrane lipid rafts. J. Nutr. Biochem. 23, 101–105 [DOI] [PMC free article] [PubMed] [Google Scholar]
- 25. Verlengia R., Gorjao R., Kanunfre C. C., Bordin S., de Lima T. M., Martins E. F., Newsholme P., Curi R. (2004) Effects of EPA and DHA on proliferation, cytokine production, and gene expression in Raji cells. Lipids 39, 857–864 [DOI] [PubMed] [Google Scholar]
- 26. Verlengia R., Gorjao R., Kanunfre C. C., Bordin S., Martins De Lima T., Martins E. F., Curi R. (2004) Comparative effects of eicosapentaenoic acid and docosahexaenoic acid on proliferation, cytokine production, and pleiotropic gene expression in Jurkat cells. J. Nutr. Biochem. 15, 657–665 [DOI] [PubMed] [Google Scholar]
- 27. Wong S. W., Kwon M-J., Choi A. M. K., Kim H-P., Nakahira K., Hwang D. H. (2009) Fatty acids modulate Toll-like receptor 4 activation through regulation of receptor dimerization and recruitment into lipid rafts in a reactive oxygen species-dependent manner. J. Biol. Chem. 284, 27384–27392 [DOI] [PMC free article] [PubMed] [Google Scholar]
- 28. Nakashima M., Kinoshita M., Nakashima H., Habu Y., Miyazaki H., Shono S., Hiroi S., Shinomiya N., Nakanishi K., Seki S. (2012) Pivotal Advance: Characterization of mouse liver phagocytic B cells in innate immunity. J. Leukoc. Biol. 91, 537–546 [DOI] [PubMed] [Google Scholar]
- 29. Parra D., Rieger A. M., Li J., Zhang Y. A., Randall L. M., Hunter C. A., Barreda D. R., Sunyer J. O. (2012) Pivotal Advance: Peritoneal cavity B-1 B cells have phagocytic and microbicidal capacities and present phagocytosed antigen to CD4(+) T cells. J. Leukoc. Biol. 91, 525–536 [DOI] [PMC free article] [PubMed] [Google Scholar]
- 30. Kew S., Gibbons E. S., Thies F., McNeill G. P., Quinlan P. T., Calder P. C. (2003) The effect of feeding structured triacylglycerols enriched in eicosapentaenoic or docosahexaenoic acids on murine splenocyte fatty acid composition and leucocyte phagocytosis. Br. J. Nutr. 90, 1071–1080 [DOI] [PubMed] [Google Scholar]
- 31. Kew S., Banerjee T., Minihane A. M., Finnegan Y. E., Williams C. M., Calder P. C. (2003) Relation between the fatty acid composition of peripheral blood mononuclear cells and measures of immune cell function in health free-living subjects aged 25–72 y. Am. J. Clin. Nutr. 77, 1278–1286 [DOI] [PubMed] [Google Scholar]
- 32. Huang S. C., Misfeldt M. L., Fritsche K. L. (1992) Dietary fat influences Ia antigen expression and immune cell populations in the murine peritoneum and spleen. J. Nutr. 122, 1219–1231 [DOI] [PubMed] [Google Scholar]
- 33. Hughes D. A., Pinder A. C., Piper Z., Johnson I. T., Lund E. K. (1996) Fish oil supplementation inhibits the expression of major histocompatibility complex class II molecules and adhesion molecules on human monocytes. Am. J. Clin. Nutr. 63, 267–272 [DOI] [PubMed] [Google Scholar]
- 34. Sanderson P., MacPherson G. G., Jenkins C. H., Calder P. C. (1997) Dietary fish oil diminishes the antigen presentation activity of rat dendritic cells. J. Leukoc. Biol. 62, 771–777 [DOI] [PubMed] [Google Scholar]
- 35. Erickson L., Picha K., Fanslow W., Waldschmidt T. (1997) Murine B1 B cells require an additional signal for optimal T cell-dependent stimulation. J. Allergy Clin. Immun. 99, 1907–1907 [Google Scholar]
- 36. Harriman G. R., Kunimoto D. Y., Elliott J. F., Paetkau V., Strober W. (1988) The role of IL-5 in IgA B-cell differentiation. J. Immunol. 140, 3033–3039 [PubMed] [Google Scholar]
- 37. Stassen M., Muller C., Arnold M., Hultner L., Hessling S. K., Neudorfl C., Reineke T., Serfling E., Schmitt E. (2001) IL-9 and IL-13 production by activated mast cells is strongly enhanced in the presence of lipopolysaccharide: NF-κ B is decisively involved in the expression of IL-9. J. Immunol. 166, 4391–4398 [DOI] [PubMed] [Google Scholar]
- 38. Petitfrere C., Dugas B., Braquet P., Menciahuerta J. M. (1993) Interleukin-9 potentiates the interleukin-4-induced IgE and IgG1 release from murine B-lymphocytes. Immunology 79, 146–151 [PMC free article] [PubMed] [Google Scholar]
- 39. Lai Y. H., Mosmann T. R. (1999) Mouse IL-13 enhances antibody production in vivo and acts directly on B cells in vitro to increase survival and hence antibody production. J. Immunol. 162, 78–87 [PubMed] [Google Scholar]
- 40. Wynn T. A. (2003) IL-13 effector functions. Annu. Rev. Immunol. 21, 425–456 [DOI] [PubMed] [Google Scholar]
- 41. Beli E., Li M., Cuff C., Pestka J. J. (2008) Docosahexaenoic acid-enriched fish oil consumption modulates immunoglobulin responses to and clearance of enteric reovirus infection in mice. J. Nutr. 138, 813–819 [DOI] [PubMed] [Google Scholar]
- 42. Ramon S., Gao F., Serhan C. N., Phipps R. P. (2012) Specialized proresolving mediators enhance human B cell differentiation to antibody-secreting cells. J. Immunol. 189, 1036–1042 [DOI] [PMC free article] [PubMed] [Google Scholar]
- 43. Godson C., Mitchell S., Harvey K., Petasis N. A., Hogg N., Brady H. R. (2000) Cutting edge: lipoxins rapidly stimulate nonphlogistic phagocytosis of apoptotic neutrophils by monocyte-derived macrophages. J. Immunol. 164, 1663–1667 [DOI] [PubMed] [Google Scholar]