Abstract
The appearance of the retinal blood vessels is an important diagnostic indicator of various clinical disorders of the eye and the body. Retinal blood vessels have been shown to provide evidence in terms of change in diameter, branching angles, or tortuosity, as a result of ophthalmic disease. This paper reports the development for an automated method for segmentation of blood vessels in retinal images. A unique combination of methods for retinal blood vessel skeleton detection and multidirectional morphological bit plane slicing is presented to extract the blood vessels from the color retinal images. The skeleton of main vessels is extracted by the application of directional differential operators and then evaluation of combination of derivative signs and average derivative values. Mathematical morphology has been materialized as a proficient technique for quantifying the retinal vasculature in ocular fundus images. A multidirectional top-hat operator with rotating structuring elements is used to emphasize the vessels in a particular direction, and information is extracted using bit plane slicing. An iterative region growing method is applied to integrate the main skeleton and the images resulting from bit plane slicing of vessel direction-dependent morphological filters. The approach is tested on two publicly available databases DRIVE and STARE. Average accuracy achieved by the proposed method is 0.9423 for both the databases with significant values of sensitivity and specificity also; the algorithm outperforms the second human observer in terms of precision of segmented vessel tree.
Keywords: Medical imaging, Retinal images, Retinal vessel segmentation, Biomedical image analysis, Image segmentation, Bit planes, Morphological processing
Introduction
The assessment of the characteristics of the retinal vascular network can reveal information on pathological modifications induced by ocular diseases. The manifestation of the retinal vasculature is important for diagnosis, treatment, screening, evaluation, and the clinical study of ophthalmic diseases including diabetic retinopathy, hypertension, arteriosclerosis [1], retinal artery occlusion [2], and chorodial neovascularization [3]. Some of the main clinical objectives reported in the literature for retinal vessel segmentation are the implementation of screening programs for diabetic retinopathy [3], evaluation of the retinopathy of prematurity [4], foveal avascular region detection [5], arteriolar narrowing detection [6], vessel tortuosity to characterize hypertensive retinopathy, vessel diameter measurement to diagnose hypertension and cardiovascular diseases [7], and computer-assisted laser surgery [1].
Blood vessels are the predominant and most stable structures appearing in the retina which can be directly observed in vivo. The effectiveness of treatment for ophthalmologic disorders is reliant on the timely detection of change in retinal pathology. The manual labeling of retinal blood vessels is a time-consuming process that entails training and skill. Automated segmentation provides consistency and accuracy and reduces the time taken by a physician or a skilled technician for hand mapping. Therefore, an automated reliable method of vessel segmentation would be valuable for the early detection and characterization of morphological changes in the retinal vasculature. The feature characterization and extraction in retinal images is a complex task in general. The main complexities in them are the inadequate contrast, lighting variations, a high noise influence mainly due to its complex acquisition, and anatomic variability depending on the particular patient. Particular features of blood vessels like the convex structure and lower reflectance compared to other retinal surfaces make them complex structures to detect as the gray level of a vessel varies across its length. Their tree-like geometry is often intricate and complicated so that features like bifurcations and overlaps can possibly confuse the detection system. However, some other attributes, like the linearity or the tubular shape, could make the contour detection easier. Further challenges faced in automated vessel detection include a wide range of vessel widths, low contrast with respect to background, and appearance of a variety of structures in the image including the optic disc, the retinal boundary, the lesions, and other pathologies.
This paper deals with the development of a vascular tree detection system, which would constitute the first step for subsequent retinal image analysis and processing. The proposed approach is a unique combination of vessel skeleton extraction and the application of bit planes on morphologically enhanced retinal image for segmentation of retinal blood vessels. There are several methods found in the literature for detection of vessel skeleton in retinal images which includes the application of tramline filters [7], image ridges [8], difference of offset Gaussian (DoOG) filter [9], likelihood ratio test [10], and normalized gradient vector field [11]. In this work, the DoOG filter which was initially proposed by Mendonca and Campilho [9] is employed for vessel skeleton detection. The segmented blood vascular tree is obtained by combination of vessel skeleton and the image obtained from bit planes slicing. The application of morphological bit planes for retinal vasculature extraction is demonstrated.
The organization of paper is as follows: In “Related Work,” we give an overview of vessel extraction methods in the research literature. In “The Methodology,” the methodology for retinal vessel segmentation is discussed in detail. Some illustrative experimental results of the algorithm on the images of the experimented databases are presented in “Experimental Evaluation.” Finally, “Conclusions” is dedicated to the main conclusions of this work.
Related Work
Many algorithms and methodologies for retinal vessel segmentation have been reported. A recent detailed review of these methods can be found in [12]. The algorithms and methodologies for detecting retinal blood vessels can be classified into techniques based on pattern recognition, match filtering, morphological processing, vessel tracking, multiscale analysis, and model-based algorithms. The pattern recognition methods can be further divided into two categories: supervised methods and unsupervised methods. Supervised methods utilize ground truth data for the classification of vessels based on given features. These methods include neural networks [13], principal component analysis [14], k-nearest neighbor classifiers and ridge-based primitives classification [8], line operators and support vector machine (SVM) classification [15], Gabor wavelet and Gaussian mixture model classifier [16, 17], feature-based Adaboost classifier [18], and steerable complex wavelet with semi-supervised SVM classification [19]. The unsupervised methods work without any prior labeling knowledge. Some of the reported methods are the fuzzy C-means clustering algorithm [20, 21], radius-based clustering algorithm [22], maximum likelihood estimation of vessel parameters [23], matched filtering along with specially weighted fuzzy C-means clustering [21], and local entropy thresholding using gray level co-occurrence matrix [24]. The matched filtering methodology exploits the piecewise linear approximation and the Gaussian like intensity profile of retinal blood vessels and uses a kernel based on a Gaussian or its derivatives to enhance the vessel features in the retinal image. The matched filter (MF) is first proposed by Chaudhuri et al. [25] and later adapted and extended by Hoover et al. [26] and Xiaoyi and Mojon [27]. Gang et al. [28] evaluate the suitability of the amplitude-modified second-order Gaussian filter whereas Zhang et al. [29] proposed an extension and generalization of MF with a first-order derivative of Gaussian. A hybrid model of the MF and ant colony algorithm for retinal vessel segmentation is proposed by Cinsdikici and Aydin [30]. A high-speed detection of retinal blood vessels using phase congruency and a bank of log-Gabor filters has been proposed by Amin and Yan [31]. Zana and Klein [32] combine morphological filters and cross-curvature evaluation to segment vessel-like patterns. Mendonca and Campilho [9] detect vessel centerlines in combination with multiscale morphological reconstruction. Fraz et al. [33, 34] combined vessel centerline with bit planes to extract the retinal vasculature. Sun et al. [35] combined morphological multiscale enhancement, fuzzy filter, and the watershed transformation for the extraction of the vascular tree in the angiogram. The algorithm based on evaluation of principal curvature, non-maximal suppression, and hysteresis thresholding-based morphological reconstruction [36] is also employed for retinal vessel segmentation. The tracking-based approaches [20] segment a vessel between two points using local information and work at the level of a single vessel rather than the entire vasculature. The multiscale approaches for vessel segmentation are based on scale space analysis [37]. The width of a vessel decreases gradually across its length as it travels radially outward from the optic disk. Therefore, the idea behind scale-space representation for vascular extraction is to separate out information related to the blood vessel having varying width. The model-based approaches utilize the vessel profile models [38], active contour models [39], and geometric models based on level sets [40] for vessel segmentation.
The Methodology
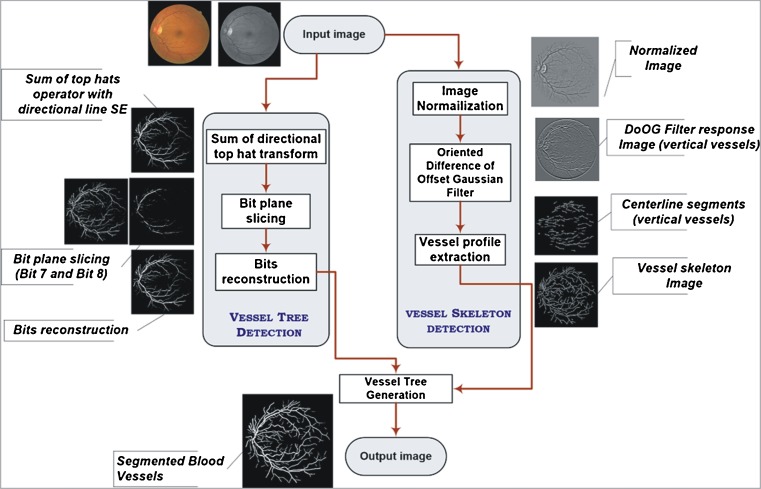
This work presents a new methodology, which incorporates vessel skeleton detection with morphological bit planes slicing for segmentation of retinal blood vessels. The proposed method comprises of several steps. Initially, a binary mask is generated to extract the region of interest (ROI). Then the skeleton image of retinal blood vessels is extracted. The enhanced image of retinal vessels is acquired by taking the sum of images obtained by applying the top-hat transformation on a monochromatic representation of an eye fundus image using a linear structuring element rotated at 22.5°. Later bit plane slicing is used to attain a binary image for retinal vessels. The region growing technique is applied on the vessel skeleton image using the bit plane sliced image as the aggregate threshold in order to obtain the final vessel tree. A schematic overview of the proposed method is described in Fig. 1 along with the thumbnails of corresponding output images.
Fig. 1.
Schematic overview of the methodology
Vessel Skeleton Extraction
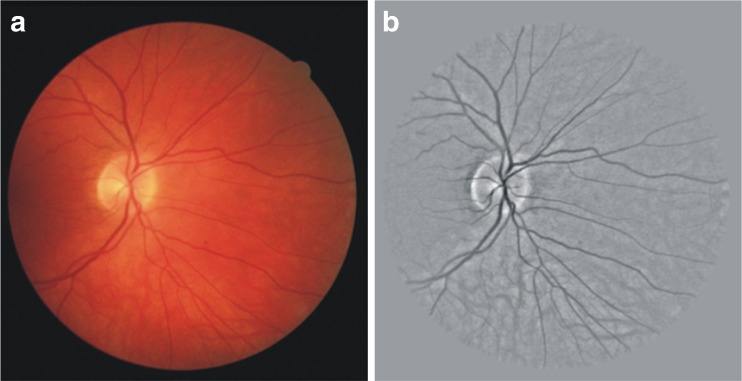
We have used the green channel of the RGB-colored retinal image because it normally demonstrates a higher contrast between vessels and the retinal background [8, 12]. The binary mask for the FOV for each of the DRIVE database image is available with the database. We have created the FOV binary mask for each of the images in STARE database by using the algorithm explained in [16]. The intention of mask generation is to tag the pixels lying in the spherical retinal anatomical structure ROI in the entire image. The variation in image background is normalized by subtracting an estimate of the background, which is obtained by applying an arithmetic mean kernel by using decimation [41]. The decimated image from this process is resized to the actual size of the original image which is then subtracted from the green channel of RGB image to obtain normalize image. An example of a normalized image is shown in Fig. 2b.
Fig. 2.
a RGB retinal image; b normalized image
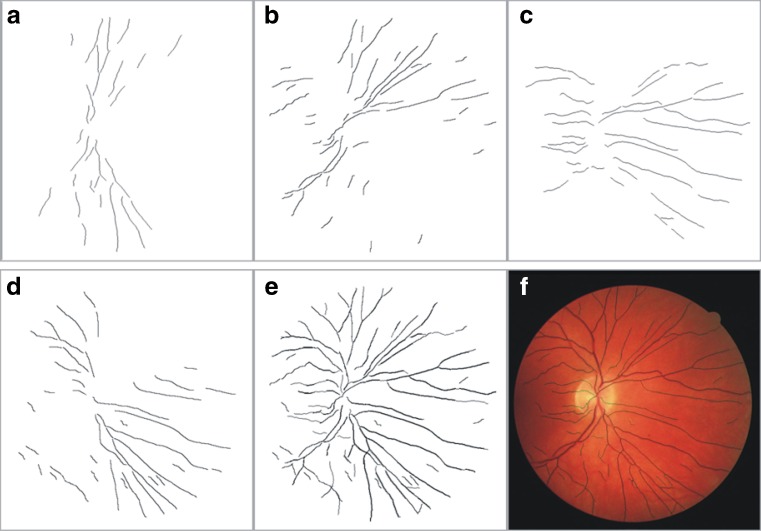
The maximum local intensity across the blood vessel cross profile in the retina generally occurs at the vessel center pixels; therefore, vessel centerlines are measured as the connected sets of pixels which correspond to intensity maxima computed from the intensity profiles of the vessel cross sections. The vessel skeleton which consists of the vessel centerlines is detected by applying difference of offset Gaussian filter in four directions to the background normalized image, followed by the evaluation of average derivative values of the filter response images. For this purpose, the methodology proposed by Mendonca and Campilho [9] is employed. The segments of vessel skeleton in horizontal, vertical, diagonal, and cross-diagonal directions along with their union are illustrated in Fig. 3.
Fig. 3.
a–d Vessel skeleton in vertical, diagonal 45°, horizontal and cross diagonal 135°, respectively); e complete vessel skeleton image; f vessel skeleton superimposed on RGB image
Morphological Bit Plane Slicing
Mathematical morphology has revealed itself as a very useful digital image processing technique for quantifying retinal pathology in fluorescent angiograms and monochromatic images. It has been observed that the blood vessels in retinal images have the following three important properties which are useful for vessel analysis [42]:
The small curvatures of blood vessels can be approximated by piecewise linear segments.
- The vessels appear darker relative to the background and have lower reflectance compared to other retinal surface. The observation is that the vessels almost never have ideal step edges. The intensity profile of the vessels can be approximated by a Gaussian curve and varies slightly from vessel to vessel.
where d is the perpendicular distance between the point (x, y) and the straight line passing through the center of the blood vessel in a direction along its length, σ defines the spread of the intensity profile, A is the grey level intensity of the local background, and k is a measure of reflectance of the blood vessel relative to its neighborhood.
1 The width of a vessel is a gradually decreasing function as it travels radially outward from the optic disk.
In the proposed approach, the above-mentioned properties are exploited with the fact that a vessel is a dark pattern with a Gaussian shape cross-section profile, is piecewise connected, and is locally linear. Because of piecewise linear nature of vessels, the morphological filters with linear structuring elements are used to enhance the vessels in the ocular fundus image. The detailed procedure is explained in the subsequent sections.
Vessel Enhancement
The blood vessels appear as linear bright shapes in the monochromatic representation of a retinal image and can easily be identified using mathematical morphology. Erosion followed by dilation using a linear structuring element will eradicate a vessel or part of it when the structuring element cannot be contained within the vessel. Equation (2) represents the top-hat operator.
 |
2 |
where I is the image to be processed and Se is structuring elements for opening (°).
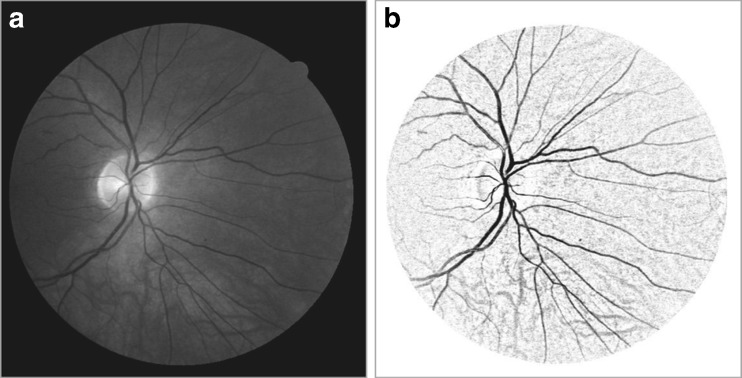
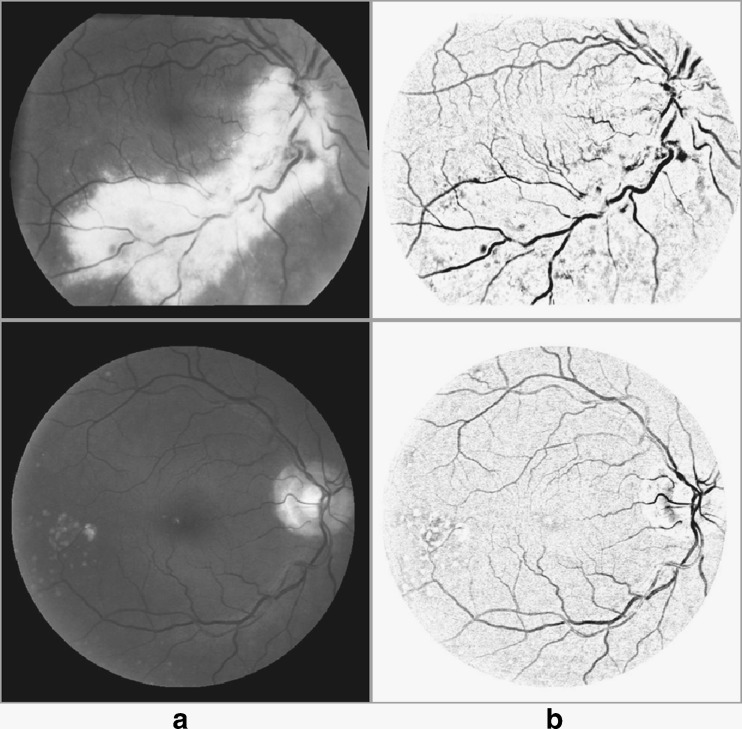
This happens when the vessel and the structuring element have orthogonal directions and the structuring element is longer than the vessel width. Conversely, when the orientation of the structuring element is parallel to the vessel, the vessel will stay nearly unchanged. If the opening along a class of linear structuring elements is considered, a sum of top-hat along each direction will brighten the vessels regardless of their direction, provided that the length of the structuring elements is large enough to extract the vessel with the largest diameter. Therefore, the chosen structuring element is 21 pixels long 1 pixel wide and is rotated at every 30°. Its size is approximately the range of the diameter of the biggest vessels for retinal images. In the image, every isolated round and bright zone whose diameter is less than the length of linear structuring element pixels have been removed. The sum of top-hat on the filtered image will enhance all vessels whatever their direction, including small or tortuous vessels as depicted in Fig. 4b. The pathologies in retinal images contribute toward increasing the rate of false detection of blood vessels. The large homogeneous pathological areas will also be normalized since they are unchanged by the transformation as illustrated in Fig. 5.
Fig. 4.
a Green channel of RGB image; b image resulted from sum of top-hat transformation
Fig. 5.
Pathological images from STARE (top row) and DRIVE (bottom row). a Green channel of RGB image; b image resulted from sum of top-hat transformation
Bit Plane Slicing
Bit plane slicing highlights the contribution made to the total image appearance by specific bits. Separating a digital image into its bit planes is useful for analyzing the relative importance played by each bit of the image. It is a process that aids in determining the adequacy of the number of bits used to quantize each pixel.
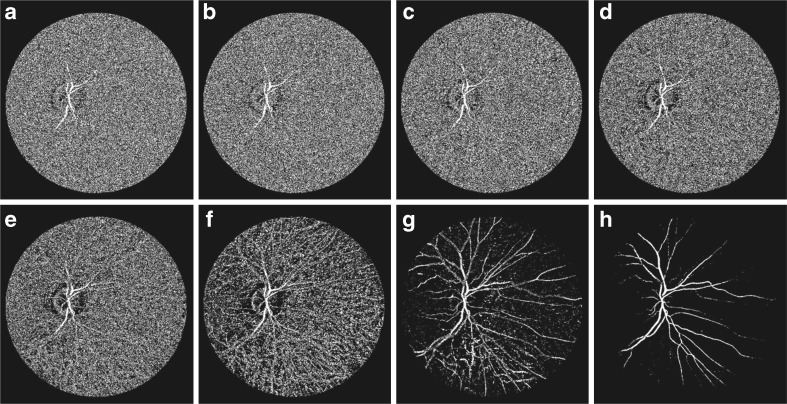
The image resulting from the sum of the top-hat operation is a monochromatic grayscale in which the gray levels are distributed in such a way that the blood vessels are highlighted more than the background. This 8-bit gray scale image can be represented in the form of bit planes, ranging from bit plane 1 for the least significant bit-to-bit plane 8 for the most significant bit as shown in Fig. 6. It is observed that the higher-order bits plane especially the top two bit planes contain the majority of the visually significant data. The other bit planes contribute to more subtle details in the image and appear as noise. A single binary image is obtained by taking the sum of the top two bit planes which are bit plane 7 and bit plane 8. This binary image contains the partial reconstruction of vascular tree of the retina. This partial reconstruction along with the detected vessel centerlines is used in vessel filling.
Fig. 6.
Bit planes of the image shown in Fig. 4b; a–h bit plane 1 to bit plane 8, respectively
Vessel Tree Generation
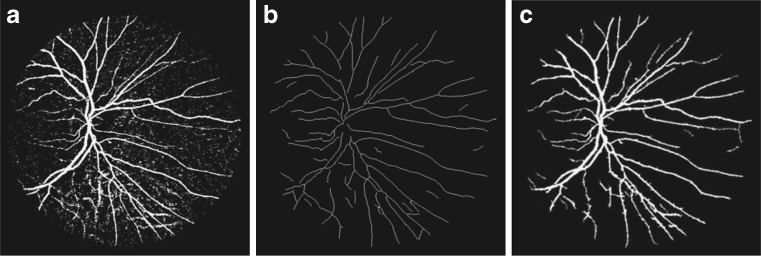
The final image of vascular tree is obtained by combining the vessel skeleton image with the image obtained from morphological bit plane slicing. Vessel skeleton pixels are used as seed points for the region growing algorithm which breed these points by aggregating the pixels from the image resulted from bit planes slicing as shown in Fig. 7a. The seed pixels of vessel skeleton image are compared with neighboring pixels in the bit plane sliced image for 8-connectivity, and region growing is applied using the centerlines and the neighboring pixels of bit plane reconstructed image satisfying this connectivity restriction. The aggregate threshold for 8-connectivity for both of the images of vessel centerline and the bit plane sliced image is set to be 1 because of their binary format. Region growth is performed using all the seed pixels one by one. The final vessel segmentation as shown in Fig. 7c is obtained after a cleaning operation aiming at removing all pixels completely surrounded by vessel points but not labeled as part of a vessel. This is done by considering that each pixel with at least six neighbors classified as vessel points must also belong to a vessel.
Fig. 7.
a Addition of bit plane 7 and bit plane 8, b vessel skeleton, c extracted vascular tree
Experimental Evaluation
Materials
The methodology has been evaluated quantitatively and qualitatively using two publicly available data sets. The DRIVE database [43] contains 40 color images of the retina, captured by a Canon CR5 3CCD camera with a 45° field of view (FOV), with 565 × 584 pixels and 8 bits per color channel. The image set is divided into a test and training set and each one contains 20 images. The performance of the vessel segmentation algorithms is measured on the test set. The test set has four images with pathologies. For the 20 images of the test set, there are two manual segmentations available made by two different observers resulting in sets A and B. The manually segmented images in set A by the first human observer are used as a ground truth. The human observer performance is measured using the manual segmentations by the second human observer from set B. In set A, 12.7 % of pixels were marked as vessel against 12.3 % in set B.
The STARE database [26] contains 20 colored retinal images, with 700 × 605 pixels and 8 bits per RGB channel, captured by a TopCon TRV-50 fundus camera at 35° FOV. Two manual segmentations by A. Hoover and V. Kouznetsova are available. The first observer marked 10.4 % of pixels as vessel, the second one 14.9 %. The performance is computed with the segmentations of the first observer as a ground truth. The comparison of the second human observer with the ground truth images gives a detection performance measure which is regarded as a target performance level. The STARE database contains ten retinal images with pathologies.
Performance Measures
In retinal vessel segmentation, any pixel which is identified as vessel in both the ground truth and segmented image is marked as a true positive. Any pixel which is marked as vessel in the segmented image but not in the ground truth image is counted as a false positive as illustrated in Table 1.
Table 1.
Vessel classification
| Vessel present | Vessel absent | |
|---|---|---|
| Vessel detected | True positive | False positive |
| Vessel not detected | False negative | True negative |
True positive rate (TPR) represents the fraction of pixels correctly detected as vessel pixels. False positive rate (FPR) is the fraction of pixels erroneously detected as vessel pixels. The accuracy (Acc) is measured by the ratio of the total number of correctly classified pixels (sum of true positives and true negatives) by the number of pixels in the image FOV. Sensitivity (SN) reflects the ability of an algorithm to detect the vessel pixels. It can also be referred as TPR. Specificity (SP) is the ability to detect non-vessel pixels. It can be expressed as 1 − FPR. The positive predictive value (PPV) or precession rate gives the proportion of identified vessel pixels which are true vessel pixels. It is the probability that an identified vessel pixel is a true positive. The performance of algorithm is evaluated in terms of SN, SP, Acc, PPV, negative predictive value (NPV), and false discovery rate (FDR) and Matthews correlation coefficient (MCC) [44], which is often used in machine learning and is a measure of the quality of binary (two-class) classifications. These metrics are defined in Table 2 based on the terms in Table 1 and are computed for the databases using the green channel of RGB images.
Table 2.
Performance metrics for retinal vessel segmentation
| Measure | Description |
|---|---|
| SN | TP/(TP + FN) |
| SP | TN/(TN + FP) |
| Accuracy | (TP + TN)/(TP + FP + TN + FN) |
| PPV | TP/(TP + FP) |
| NPV | TN/(TN + FN) |
| FDR | FP/(FP + TP) |
| MCC |  |
Vessel Segmentation Results
Tables 3 and 4 illustrate the performance metrics of the segmentation methodology for each of the images from the test set of the DRIVE and STARE databases, respectively. It is observed that the average accuracy for both of the data sets is approximately equal to 0.9423 and average SN along with average SP depict better figures. High values of average PPV and low values of average FDR for both databases demonstrate that vessels and non-vessel pixels are segmented with high precision. The algorithm outperforms the second human observer in terms of precision.
Table 3.
Performance metrics on DRIVE database
| Image name | Accuracy | Sensitivity | Specificity | PPV | NPV | FDR | MCC |
|---|---|---|---|---|---|---|---|
| 01_test | 0.9452 | 0.8241 | 0.9638 | 0.7782 | 0.9727 | 0.2218 | 0.7691 |
| 02_test | 0.9424 | 0.7997 | 0.9680 | 0.8176 | 0.9642 | 0.1824 | 0.7747 |
| 03_test | 0.9281 | 0.6275 | 0.9805 | 0.8492 | 0.9378 | 0.1508 | 0.6917 |
| 04_test | 0.9454 | 0.7363 | 0.9785 | 0.8440 | 0.9591 | 0.1560 | 0.7577 |
| 05_test | 0.9402 | 0.6653 | 0.9847 | 0.8756 | 0.9478 | 0.1244 | 0.7316 |
| 06_test | 0.9329 | 0.6431 | 0.9820 | 0.8580 | 0.9421 | 0.1420 | 0.7072 |
| 07_test | 0.9374 | 0.6860 | 0.9769 | 0.8231 | 0.9520 | 0.1769 | 0.7167 |
| 08_test | 0.9368 | 0.6247 | 0.9826 | 0.8399 | 0.9470 | 0.1601 | 0.6913 |
| 09_test | 0.9438 | 0.6497 | 0.9842 | 0.8492 | 0.9534 | 0.1508 | 0.7132 |
| 10_test | 0.9438 | 0.6973 | 0.9782 | 0.8171 | 0.9586 | 0.1829 | 0.7238 |
| 11_test | 0.9333 | 0.7593 | 0.9599 | 0.7432 | 0.9631 | 0.2568 | 0.7127 |
| 12_test | 0.9424 | 0.7353 | 0.9731 | 0.8016 | 0.9613 | 0.1984 | 0.7351 |
| 13_test | 0.9341 | 0.6992 | 0.9740 | 0.8202 | 0.9502 | 0.1798 | 0.7202 |
| 14_test | 0.9450 | 0.7755 | 0.9681 | 0.7680 | 0.9694 | 0.2320 | 0.7405 |
| 15_test | 0.9457 | 0.8038 | 0.9625 | 0.7176 | 0.9764 | 0.2824 | 0.7293 |
| 16_test | 0.9464 | 0.7740 | 0.9732 | 0.8177 | 0.9651 | 0.1823 | 0.7648 |
| 17_test | 0.9437 | 0.7074 | 0.9778 | 0.8215 | 0.9585 | 0.1785 | 0.7311 |
| 18_test | 0.9453 | 0.7884 | 0.9664 | 0.7586 | 0.9715 | 0.2414 | 0.7423 |
| 19_test | 0.9595 | 0.8519 | 0.9747 | 0.8261 | 0.9790 | 0.1739 | 0.8158 |
| 20_test | 0.9520 | 0.7563 | 0.9762 | 0.7968 | 0.9701 | 0.2032 | 0.7495 |
| Average | 0.9422 | 0.7302 | 0.9742 | 0.8112 | 0.9600 | 0.1888 | 0.7359 |
| 2nd human observer | 0.9468 | 0.7772 | 0.9721 | 0.8066 | 0.9671 | 0.1933 | 0.7605 |
Table 4.
Performance metrics on STARE database
| Image name | Accuracy | Sensitivity | Specificity | PPV | NPV | FDR | MCC |
|---|---|---|---|---|---|---|---|
| im0001 | 0.9179 | 0.5924 | 0.9578 | 0.6328 | 0.9504 | 0.3672 | 0.5665 |
| im0002 | 0.9288 | 0.5240 | 0.9697 | 0.6366 | 0.9527 | 0.3634 | 0.5394 |
| im0003 | 0.9357 | 0.8082 | 0.9471 | 0.5767 | 0.9823 | 0.4233 | 0.6497 |
| im0004 | 0.9215 | 0.2801 | 0.9949 | 0.8626 | 0.9235 | 0.1374 | 0.4650 |
| im0005 | 0.9275 | 0.7730 | 0.9494 | 0.6833 | 0.9673 | 0.3167 | 0.6855 |
| im0044 | 0.9449 | 0.8744 | 0.9517 | 0.6373 | 0.9874 | 0.3627 | 0.7184 |
| im0077 | 0.9398 | 0.9272 | 0.9414 | 0.6617 | 0.9905 | 0.3383 | 0.7527 |
| im0081 | 0.9508 | 0.8873 | 0.9580 | 0.7072 | 0.9867 | 0.2928 | 0.7659 |
| im0082 | 0.9470 | 0.8796 | 0.9552 | 0.7034 | 0.9850 | 0.2966 | 0.7581 |
| im0139 | 0.9411 | 0.7891 | 0.9600 | 0.7099 | 0.9735 | 0.2901 | 0.7155 |
| im0162 | 0.9504 | 0.9060 | 0.9553 | 0.6880 | 0.9894 | 0.3120 | 0.7638 |
| im0163 | 0.9518 | 0.9422 | 0.9529 | 0.7040 | 0.9928 | 0.2960 | 0.7898 |
| im0235 | 0.9488 | 0.8445 | 0.9633 | 0.7628 | 0.9780 | 0.2372 | 0.7736 |
| im0236 | 0.9483 | 0.8266 | 0.9657 | 0.7749 | 0.9750 | 0.2251 | 0.7708 |
| im0239 | 0.9469 | 0.7715 | 0.9705 | 0.7783 | 0.9693 | 0.2217 | 0.7448 |
| im0240 | 0.9198 | 0.5112 | 0.9867 | 0.8626 | 0.9250 | 0.1374 | 0.6262 |
| im0255 | 0.9550 | 0.8138 | 0.9748 | 0.8198 | 0.9738 | 0.1802 | 0.7912 |
| im0291 | 0.9635 | 0.5892 | 0.9915 | 0.8394 | 0.9699 | 0.1606 | 0.6856 |
| im0319 | 0.9655 | 0.5775 | 0.9899 | 0.7820 | 0.9738 | 0.2180 | 0.6549 |
| im0324 | 0.9410 | 0.5174 | 0.9838 | 0.7639 | 0.9528 | 0.2361 | 0.5993 |
| Average | 0.9423 | 0.7318 | 0.9660 | 0.7294 | 0.9700 | 0.2706 | 0.6908 |
| 2nd human observer | 0.9347 | 0.8955 | 0.9382 | 0.6432 | 0.9883 | 0.3567 | 0.7228 |
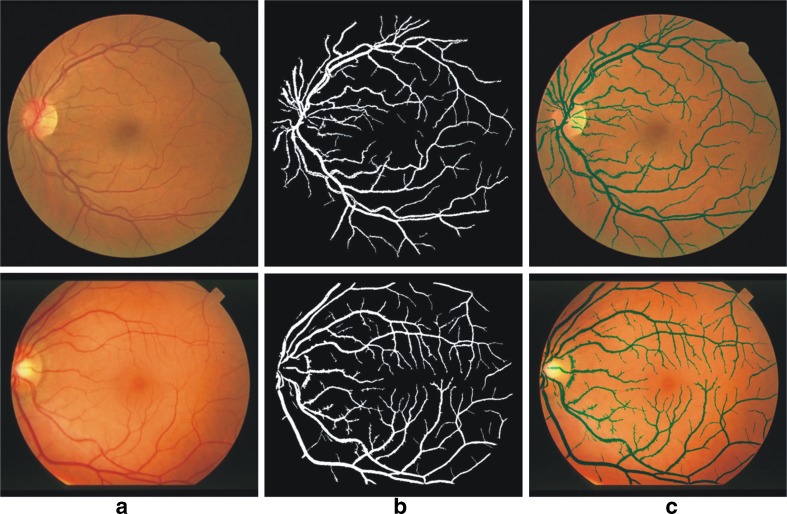
Vessel segmentation results of one image each from the DRIVE and the STARE databases are illustrated in Fig. 8. The figures illustrate the original image, the segmented vessel tree, and the vessel structure superimposed on the original image.
Fig. 8.
Vessel segmentation results of images from DRIVE database (top row) and STARE database (bottom row). a The RGB image; b vessel segmentation result; c the segmented image superimposed on the original image
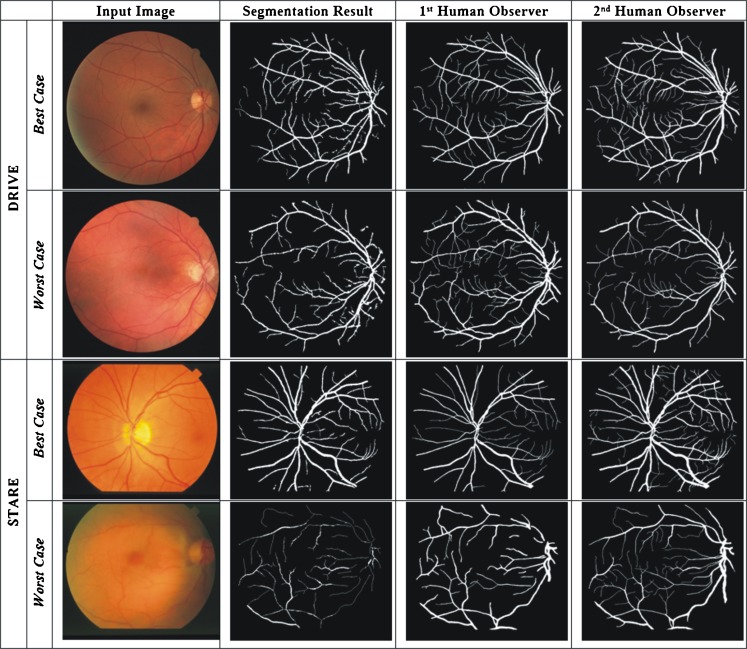
Figure 9 shows the original retinal image, the resulting vessel segmented image, the manually segmented images from the first human observer which is considered as the ground truth, and the manual segmentation from the second human observer. The best-case accuracy, TPR, FPR, and PPV for DRIVE database shown in first row are 0.9619, 0.8400, 0.0212, and 0.8452, respectively, and the worst-case measures depicted in second row are 0.9377, 0.6710, 0.0211, and 0.8300, respectively. For the STARE database, the best case of vessel segmentation results is presented in the third row of Fig. 9, with an accuracy of 0.9552; TPR, FRP, and PPV are 0.9321, 0.0420, and 0.7238, respectively. The image with the worst-case segmentation results is shown in the fourth row where the accuracy is 0.9240; TPR and FPR are 0.3106 and 0.0060, respectively.
Fig. 9.
Segmentation results for DRIVE and STARE databases
Comparison with Published Methods
The performance of the proposed methodology is compared with other published algorithms in Tables 4 and 5 for DRIVE and STARE, respectively. The maximum average accuracy, sensitivity, and specificity are calculated for the 20 images of the test set of the DRIVE database and 20 images of STARE database. The same performance measures for other vessel segmentation methods are obtained from the respective publications. The performance measures of Hoover et al. [26] and Soares et al. [16] were calculated using the segmented images downloaded from their websites. The results of Zana and Klein [32] and Xiaoyi and Mojon [27] are taken from DRIVE database website.
Table 5.
Performance comparison of vessel segmentation methods (DRIVE images)
| Sr. No. | Methods | Average accuracy | Sensitivity | Specificity |
|---|---|---|---|---|
| 1. | 2nd human observer | 0.9470 | 0.7763 | 0.9725 |
| 2. | Zana and Klein [32] | 0.9377 | 0.6971 | NA |
| 3. | Niemeijer et al. [45] | 0.9416 | 0.7145 | 0.9696 |
| 4. | Xiaoyi and Mojon [27] | 0.9212 | 0.6399 | NA |
| 5. | Al-Diri et al. [39] | 0.9258 | 0.6716 | NA |
| 6. | Martinez-Perez et al. [46] | 0.9181 | 0.6389 | NA |
| 7. | Chaudhuri et al. [25] | 0.8773 | 0.3357 | NA |
| 8. | Mendonca and Campilho [9] | 0.9452 | 0.7344 | 0.9764 |
| 9. | Soares et al. [16] | 0.9466 | 0.7285 | 0.9786 |
| 10. | Staal et al. [8] | 0.9441 | 0.7345 | NA |
| 11. | Ricci and Perfetti [15] | 0.9595 | NA | NA |
| 12. | Lam et al. [47] | 0.9472 | NA | NA |
| 13. | Fraz et al. [33] | 0.9430 | 0.7152 | 0.9768 |
| 14. | Proposed method | 0.9422 | 0.7302 | 0.9742 |
NA not available
The average accuracy produced by the proposed algorithm is 0.9423 with a sensitivity and specificity of 0.7302 and 0.9742, respectively. In terms of average accuracy, the proposed method is better than Zana, Niemeijer, Jaing, Al-Diri, Martinez, and Chaudhuri (0.0046, 0.0007, 0.0211, 0.0165, 0.0242, and 0.0650, respectively). Results of Mendonça, Soares, Staal, Ricci, and Lam are better in terms of average accuracy. In general, supervised approaches have better accuracy, and the methods presented by Soares, Staal, and Ricci are supervised approaches. On the other hand, the proposed method consumes less time for blood vessel extraction. Matlab 7.0 is used to implement this system, and it consumes on average 37.4 s per image for DRIVE database and 39.5 s per image for STARE database. Other approaches also mentioned the average time consumed per image in respective papers in extraction of blood vessels. Human observer takes almost 2 h, Chaudhuri’s method utilizes 50 s, Mendonca’s approach completes in 149 s, Soares et al. spend 3 min, and Staal et al. consume 15 min.
The results obtained for the STARE database are shown in Table 6. The average accuracy of other reported methods in the literature is comparable with our results. The proposed method consumes almost 39.5 s on average which makes it a good candidate to use in real time. The main reason of less time consumption is that proposed method use only single iteration as compared to other methods which relies on number of iterations for region growing. Moreover, in STARE database, pathological images are 10 out of 20, and with the proposed approach, we have achieved high sensitivity. The average sensitivity for the STARE dataset is 0.7318 which is better than all the methods. Therefore, the sensitivity of our method performs well on pathological images because directional linear structuring elements used in top-hat on the filtered image enhances all vessels whatever their direction, including small or tortuous vessels and the large homogeneous pathological areas becomes normalized.
Table 6.
Performance comparison of vessel segmentation methods (STARE images)
| Sr. no. | Methods | Average accuracy | Sensitivity | Specificity |
|---|---|---|---|---|
| 1 | 2nd human observer | 0.9348 | 0.8951 | 0.9384 |
| 2 | Hoover et al. [26] | 0.9267 | 0.6751 | 0.9567 |
| 3 | Xiaoyi and Mojon [27] | 0.9009 | NA | NA |
| 4 | Staal et al. [8] | 0.9516 | 0.6970 | 0.9810 |
| 5 | Soares et al. [16] | 0.9478 | 0.7197 | 0.9747 |
| 6 | Mendonca and Campilho [9] | 0.9440 | 0.6996 | 0.9730 |
| 7 | Fraz et al. [33] | 0.9442 | 0.7311 | 0.9680 |
| 8 | Lam et al. [47] | 0.9567 | NA | NA |
| 9 | Ricci and Perfetti [15] | 0.9646 | NA | NA |
| 10 | Proposed method | 0.9423 | 0.7318 | 0.9660 |
NA not available
Conclusions
An automated method of blood vessel extraction in retinal images has been proposed in this paper. A fast and unique combination of different techniques based on detection of vessel skeleton with the application of multidirectional morphological bit plane slicing is presented. The skeleton of blood vessels is computed and the complete segmented vascular image is obtained by a sequence of morphological operations on the green channel of RGB colored retinal image. The key contribution is to demonstrate the application of morphological bit planes for retinal vasculature extraction. The skeleton images are extracted by the application of directional differential operators and then evaluation of a combination of derivative signs and average derivative values. Mathematical morphology has revealed itself as a very useful digital image processing technique for quantifying retinal pathology in human retinal images. A multidirectional top-hat operator with a rotating structuring element is used to emphasize the vessels in a particular direction and information is extracted using bit plane slicing. Morphological bit plane slicing is espoused for segmentation of blood vessel with varying width. A region growing method is applied to integrate the skeleton image and the images resulting from bit plane slicing of vessel direction dependent morphological filters. The methodology has been tested on two publicly available databases (DRIVE and STARE) and has been validated against observer studies. Average accuracy achieved using the proposed method is 0.9423 for both the databases with good values of sensitivity and specificity.
Contributor Information
M. M Fraz, Phone: +44-751-4567523, Email: moazam.fraz@kingston.ac.uk.
A. Basit, Email: abdulbasit1975@gmail.com
S. A. Barman, Email: S.Barman@kingston.ac.uk
References
- 1.Kanski JJ. Clinical Ophthalmology. 6. London: Elsevier Health Sciences (UK); 2007. [Google Scholar]
- 2.Liang Z, et al. The detection and quantification of retinopathy using digital angiograms. Medical Imaging, IEEE Transactions on. 1994;13:619–626. doi: 10.1109/42.363106. [DOI] [PubMed] [Google Scholar]
- 3.Teng T, et al. Progress towards automated diabetic ocular screening: a review of image analysis and intelligent systems for diabetic retinopathy. Medical and Biological Engineering and Computing. 2002;40:2–13. doi: 10.1007/BF02347689. [DOI] [PubMed] [Google Scholar]
- 4.Heneghan C, et al. Characterization of changes in blood vessel width and tortuosity in retinopathy of prematurity using image analysis. Medical Image Analysis. 2002;6:407–429. doi: 10.1016/S1361-8415(02)00058-0. [DOI] [PubMed] [Google Scholar]
- 5.Haddouche A, et al. Detection of the foveal avascular zone on retinal angiograms using Markov random fields. Digital Signal Processing. 2010;20:149–154. doi: 10.1016/j.dsp.2009.06.005. [DOI] [Google Scholar]
- 6.E. Grisan and A. Ruggeri. A divide et impera strategy for automatic classification of retinal vessels into arteries and veins. In: Engineering in Medicine and Biology Society, 2003. Proceedings of the 25th Annual International Conference of the IEEE, 2003, pp 890–893, Vol.1.
- 7.Lowell J, et al. Measurement of retinal vessel widths from fundus images based on 2-D modeling. Medical Imaging IEEE Transactions on. 2004;23:1196–1204. doi: 10.1109/TMI.2004.830524. [DOI] [PubMed] [Google Scholar]
- 8.Staal J, et al. Ridge-based vessel segmentation in color images of the retina. Medical Imaging IEEE Transactions on. 2004;23:501–509. doi: 10.1109/TMI.2004.825627. [DOI] [PubMed] [Google Scholar]
- 9.Mendonca AM, Campilho A. Segmentation of retinal blood vessels by combining the detection of centerlines and morphological reconstruction. Medical Imaging IEEE Transactions on. 2006;25:1200–1213. doi: 10.1109/TMI.2006.879955. [DOI] [PubMed] [Google Scholar]
- 10.Sofka M, Stewart CV. Retinal vessel centerline extraction using multiscale matched filters, confidence and edge measures. Medical Imaging, IEEE Transactions on. 2006;25:1531–1546. doi: 10.1109/TMI.2006.884190. [DOI] [PubMed] [Google Scholar]
- 11.Lam BSY, Hong Y. A novel vessel segmentation algorithm for pathological retina images based on the divergence of vector fields. Medical Imaging, IEEE Transactions on. 2008;27:237–246. doi: 10.1109/TMI.2007.909827. [DOI] [PubMed] [Google Scholar]
- 12.M. M. Fraz, et al. Blood vessel segmentation methodologies in retinal images—a survey. Comput Methods Programs Biomed, 2012. doi:10.1016/j.cmpb.2012.03.009 [DOI] [PubMed]
- 13.Marin D, et al. A new supervised method for blood vessel segmentation in retinal images by using gray-level and moment invariants-based features. Medical Imaging, IEEE Transactions on. 2011;30:146–158. doi: 10.1109/TMI.2010.2064333. [DOI] [PubMed] [Google Scholar]
- 14.Sinthanayothin C, et al. Automated localisation of the optic disc, fovea, and retinal blood vessels from digital colour fundus images. British Journal of Ophthalmology. 1999;83:902–910. doi: 10.1136/bjo.83.8.902. [DOI] [PMC free article] [PubMed] [Google Scholar]
- 15.Ricci E, Perfetti R. Retinal blood vessel segmentation using line operators and support vector classification. Medical Imaging, IEEE Transactions on. 2007;26:1357–1365. doi: 10.1109/TMI.2007.898551. [DOI] [PubMed] [Google Scholar]
- 16.Soares JVB, et al. Retinal vessel segmentation using the 2-D Gabor wavelet and supervised classification. Medical Imaging, IEEE Transactions on. 2006;25:1214–1222. doi: 10.1109/TMI.2006.879967. [DOI] [PubMed] [Google Scholar]
- 17.M. M. Fraz et al. An ensemble classification based approach applied to retinal blood vessel segmentation. Biomedical Engineering, IEEE Transactions on 59, 2012. doi:10.1109/TBME.2012.2205687 [DOI] [PubMed]
- 18.Lupascu CA, et al. FABC: retinal vessel segmentation using AdaBoost. Information Technology in Biomedicine, IEEE Transactions on. 2010;14:1267–1274. doi: 10.1109/TITB.2010.2052282. [DOI] [PubMed] [Google Scholar]
- 19.You X, et al. Segmentation of retinal blood vessels using the radial projection and semi-supervised approach. Pattern Recognition. 2011;44:2314–2324. doi: 10.1016/j.patcog.2011.01.007. [DOI] [Google Scholar]
- 20.Tolias YA, Panas SM. A fuzzy vessel tracking algorithm for retinal images based on fuzzy clustering. Medical Imaging, IEEE Transactions on. 1998;17:263–273. doi: 10.1109/42.700738. [DOI] [PubMed] [Google Scholar]
- 21.Kande GB, et al. Unsupervised fuzzy based vessel segmentation in pathological digital fundus images. Journal of Medical Systems. 2009;34:849–858. doi: 10.1007/s10916-009-9299-0. [DOI] [PubMed] [Google Scholar]
- 22.Salem S, et al. Segmentation of retinal blood vessels using a novel clustering algorithm (RACAL) with a partial supervision strategy. Medical and Biological Engineering and Computing. 2007;45:261–273. doi: 10.1007/s11517-006-0141-2. [DOI] [PubMed] [Google Scholar]
- 23.Ng J, et al. Maximum likelihood estimation of vessel parameters from scale space analysis. Image and Vision Computing. 2010;28:55–63. doi: 10.1016/j.imavis.2009.04.019. [DOI] [Google Scholar]
- 24.Villalobos-Castaldi F, et al. A fast, efficient and automated method to extract vessels from fundus images. Journal of Visualization. 2010;13:263–270. doi: 10.1007/s12650-010-0037-y. [DOI] [Google Scholar]
- 25.Chaudhuri S, et al. Detection of blood vessels in retinal images using two-dimensional matched filters. Medical Imaging, IEEE Transactions . 1989;8:263–269. doi: 10.1109/42.34715. [DOI] [PubMed] [Google Scholar]
- 26.Hoover AD, et al. Locating blood vessels in retinal images by piecewise threshold probing of a matched filter response. Medical Imaging, IEEE Transactions on. 2000;19:203–210. doi: 10.1109/42.845178. [DOI] [PubMed] [Google Scholar]
- 27.Xiaoyi J, Mojon D. Adaptive local thresholding by verification-based multithreshold probing with application to vessel detection in retinal images. Pattern Analysis and Machine Intelligence, IEEE Transactions. 2003;25:131–137. doi: 10.1109/TPAMI.2003.1159954. [DOI] [Google Scholar]
- 28.Gang L, et al. Detection and measurement of retinal vessels in fundus images using amplitude modified second-order Gaussian filter. Biomedical Engineering, IEEE Transactions on. 2002;49:168–172. doi: 10.1109/10.979356. [DOI] [PubMed] [Google Scholar]
- 29.Zhang B, et al. Retinal vessel extraction by matched filter with first-order derivative of Gaussian. Computers in biology and medicine. 2010;40:438–445. doi: 10.1016/j.compbiomed.2010.02.008. [DOI] [PubMed] [Google Scholar]
- 30.Cinsdikici MG, Aydin D. Detection of blood vessels in ophthalmoscope images using MF/ant (matched filter/ant colony) algorithm. Computer methods and programs in biomedicine. 2009;96:85–95. doi: 10.1016/j.cmpb.2009.04.005. [DOI] [PubMed] [Google Scholar]
- 31.M. Amin and H. Yan. High speed detection of retinal blood vessels in fundus image using phase congruency. Soft Computing—A Fusion of Foundations, Methodologies and Applications 15:1–14, 2010.
- 32.Zana F, Klein JC. Segmentation of vessel-like patterns using mathematical morphology and curvature evaluation. Image Processing, IEEE Transactions on. 2001;10:1010–1019. doi: 10.1109/83.931095. [DOI] [PubMed] [Google Scholar]
- 33.M. M. Fraz, et al. An approach to localize the retinal blood vessels using bit planes and centerline detection. Comput Methods Programs Biomed, 2011. doi:10.1016/j.cmpb.2011.08.009 [DOI] [PubMed]
- 34.M. M. Fraz, et al. Retinal vessel extraction using first-order derivative of Gaussian and morphological processing. In: Bebis G, Boyle R, Parvin B, et al. Eds. Advances in visual computing. Springer Berlin: Heidelberg, 2011, vol 6938, pp 410-420
- 35.K. Sun, et al. Morphological multiscale enhancement, fuzzy filter and watershed for vascular tree extraction in angiogram. J Med Syst 35:811–824, 2010. [DOI] [PubMed]
- 36.M. M. Fraz, et al. Retinal vasculature segmentation by morphological curvature, reconstruction and adapted hysteresis thresholding. In: Emerging Technologies (ICET), 2011 7th International Conference on, Islamabad, Pakistan, 2011, pp 1–6.
- 37.A. F. Frangi, et al. Multiscale vessel enhancement filtering. In: Medical Image Computing and Computer-Assisted Interventation MICCAI™98. vol. 1496. Berlin: Springer, 1998, p 130.
- 38.Li W, et al. Analysis of retinal vasculature using a multiresolution Hermite model. Medical Imaging, IEEE Transactions on. 2007;26:137–152. doi: 10.1109/TMI.2006.889732. [DOI] [PubMed] [Google Scholar]
- 39.Al-Diri B, et al. An active contour model for segmenting and measuring retinal vessels. Medical Imaging, IEEE Transactions on. 2009;28:1488–1497. doi: 10.1109/TMI.2009.2017941. [DOI] [PubMed] [Google Scholar]
- 40.Sum KW, Cheung PYS. Vessel extraction under non-uniform illumination: a level set approach. Biomedical Engineering, IEEE Transactions on. 2008;55:358–360. doi: 10.1109/TBME.2007.896587. [DOI] [PubMed] [Google Scholar]
- 41.J. J. de Oliveira, Jr., et al. Interpolation/decimation scheme applied to size normalization of character images. In: Pattern Recognition, 2000. Proceedings. 15th International Conference on, 2000, pp 577–580 vol. 2.
- 42.Fleming AD, et al. Automated microaneurysm detection using local contrast normalization and local vessel detection. Medical Imaging, IEEE Transactions on. 2006;25:1223–1232. doi: 10.1109/TMI.2006.879953. [DOI] [PubMed] [Google Scholar]
- 43.Staal JJ, et al. Ridge based vessel segmentation in color images of the retina. IEEE Transactions on Medical Imaging. 2004;23:501–509. doi: 10.1109/TMI.2004.825627. [DOI] [PubMed] [Google Scholar]
- 44.Kohavi R, Provost F. Glossary of terms. Machine Learning. 1998;30:271–274. doi: 10.1023/A:1017181826899. [DOI] [Google Scholar]
- 45.M. Niemeijer, et al. Comparative study of retinal vessel segmentation methods on a new publicly available database. In: SPIE Medical Imaging, 2004, pp 648–656.
- 46.M. E. Martinez-Perez, et al. Retinal blood vessel segmentation by means of scale-space analysis and region growing. In: Proceedings of the Second International Conference on Medical Image Computing and Computer-Assisted Intervention, London, UK, 1999, pp 90–97.
- 47.Lam BSY, et al. General retinal vessel segmentation using regularization-based multiconcavity modeling. Medical Imaging, IEEE Transactions on. 2010;29:1369–1381. doi: 10.1109/TMI.2010.2043259. [DOI] [PubMed] [Google Scholar]


