Abstract
Introduction
Pulmonary nodules of the adenocarcinoma spectrum are characterized by distinctive morphological and radiological features and variable prognosis. Non-invasive high-resolution computed-tomography (HRCT)-based risk stratification tools are needed to individualize their management.
Methods
Radiological measurements of histopathologic tissue invasion were developed in a training set of 54 pulmonary nodules of the adenocarcinoma spectrum and validated in 86 consecutively resected nodules. Nodules were isolated and characterized by computer-aided analysis and data were analyzed by Spearman correlation, sensitivity, specificity as well as the positive and negative predictive values.
Results
Computer Aided Nodule Assessment and Risk Yield (CANARY) can non-invasively characterize pulmonary nodules of the adenocarcinoma spectrum. Unsupervised clustering analysis of HRCT data identified 9 unique exemplars representing the basic radiologic building blocks of these lesions. The exemplar distribution within each nodule correlated well with the proportion of histologic tissue invasion, Spearman R=0.87,p < 0.0001 and 0.89,p < 0.0001 for the training and the validation set, respectively. Clustering of the exemplars in three-dimensional space corresponding to tissue invasion and lepidic growth was used to develop a CANARY decision algorithm, which successfully categorized these pulmonary nodules as “aggressive” (invasive adenocarcinoma) or “indolent” (adenocarcinoma in situ and minimally invasive adenocarcinoma). Sensitivity, specificity, positive predictive value and negative predictive value of this approach for the detection of “aggressive” lesions were 95.4%, 96.8%, 95.4% and 96.8%, respectively in the training set and 98.7%, 63.6%, 94.9% and 87.5%, respectively in the validation set.
Conclusion
CANARY represents a promising tool to non-invasively risk stratify pulmonary nodules of the adenocarcinoma spectrum.
Keywords: Pulmonary nodules, lung adenocarcinoma, risk stratification, computer aided image analysis
Introduction
Lung cancer remains the leading cause of cancer-related deaths in the US and worldwide.1,2 While early diagnosis offers a chance of cure, in the absence of effective screening, most patients present with advanced stage disease associated with poor outcomes.3 Recently the National Lung Screening Trial (NLST) demonstrated that annual screening using low-dose chest high-resolution computed tomography (HRCT) reduces lung-cancer specific mortality by 20% in high-risk individuals. Unfortunately, CT screening was positive in 39.1% of all participants and 24.2% of all screening CT-scans. The false positive rate was 96.4% among all positive screening CTs.4
Data from prior single-arm observational studies of lung cancer screening suggest that some HRCT-screen-detected lung cancers may be more indolent than their clinically detected counterparts. The majority of these lesions belong to the recently re-classified lung adenocarcinoma spectrum.5–7 The radiological manifestations of these lesions range from pure ground glass opacities (GGO) to sub-solid opacities (SSO) and solid pulmonary nodules (SPN). Whereas GGO and SSO typically progress slowly as evidenced by prolonged volume doubling times of frequently > 400 days, SPN of the adenocarcinoma spectrum commonly grow faster.5
Histologically, GGO and SSO are usually characterized by various combinations of lepidic growth (malignant growth along the intact alveolar structures), tissue invasion and associated desmoplasia. Therefore, depending on the presence and size of invasive foci, they are classified as adenocarcinoma in situ (AIS), minimally invasive adenocarcinoma (MIA, invasion ≤5 mm) or invasive adenocarcinoma (IA, invasion >5 mm). In contrast, enlarging solid areas and SPN on HRCT typically represent IA.8 Whereas the clinical outcomes of patients with surgically resected AIS and MIA are excellent (approaching 100% disease specific survival at 10 years), patients with IA have a more guarded prognosis.9–11 This spectrum of biological behavior highlights the value of a comprehensive histological examination of these lesions to predict patient outcomes and forms the basis of the recent histological re-classification of the lung adenocarcinoma spectrum. As alternative therapeutic strategies to standard lobectomy (such as sublobar resections) are currently being investigated, the non-invasive risk stratification of these nodules will facilitate individualized patient management. By definition, this assessment requires surgical resection of the lesion with histopathologic examination of the entire lesion, which cannot be reliably performed on non-surgical tissue biopsies. Due to the widespread availability and utilization of HRCT in clinical practice and lung cancer screening programs, HRCT-based risk stratification would be ideal for this task. Unfortunately, currently available HRCT based strategies remain suboptimal.
CALIPER (Computer-Aided Lung Informatics for Pathology Evaluation and Rating) is a HRCT-based image analysis tool developed at Mayo Clinic, Rochester. CALIPER has demonstrated considerable potential for automatic, rapid, and reliable lung parenchymal isolation and tissue classification in patients with diffuse lung diseases such as diffuse interstitial pneumonias and emphysema.12 Based on these observations we hypothesized that CALIPER could facilitate the non-invasive radiological-pathological correlation of pulmonary nodules of the adenocarcinoma spectrum. Herein we report the development of Computer Aided Nodule Assessment and Risk Yield (CANARY) - an adjunct tool for the characterization and categorization of pulmonary nodules.
Materials and Methods
Participants
Between 2008–2010 patients with surgically resected lesions of the pulmonary adenocarcinoma spectrum (search terms “bronchioloalveolar carcinoma (BAC)”, “adenocarcinoma with BAC features” and “adenocarcinoma”) were identified from the Mayo Clinic Epidemiology and Genetics of Lung Cancer Study database as a training set. An independent validation set of 80 cases, 86 consecutively resected (from January 1st, 2006 to December 31, 2007) pulmonary nodules of adenocarcinoma spectrum meeting the same inclusion criteria as the training set were identified from the Mayo Clinic Thoracic Surgery Registry. All Patients without a signed research authorization were excluded.
Histology review
Two independent expert pulmonary pathologists (J.B. and E.S.Y.) blindly (without clinical or radiological information) reviewed all available Hematoxylin & Eosin slides of the enrolled cases. As the proportion of lepidic growth was found to be technically easier to estimate than the proportion of invasion, they estimated the proportion of lepidic growth. In addition the presence or absence of stromal, vascular and/or pleural invasion was assessed and the diameter of the largest area of invasion including surrounding scar was measured. All measurements were adjusted to the nearest millimeter.
Based on the largest focus of tissue invasion all cases were also categorized as absent invasion (adenocarcinoma in situ, AIS), ≤ 5mm invasion (minimally invasive adenocarcinoma, MIA) or > 5mm invasion (invasive adenocarcinoma, IA), as previously described.11 When there was disagreement between invasive category (AIS, MIA, and IA), the consensus invasive category was determined by the third pathologist (M.C.A.). The consensus value for the proportion of lepidic growth was determined using the following algorithm (all values in cases where lepidic growth was <90% were rounded up to the nearest 10%):
For cases < 50% lepidic growth by either pathologist, the results were averaged if the discrepancy was ≤ 20%. Otherwise, a third pathologist reviewed the case and the two closest lepidic growth values were averaged. For cases between 50% and 90% lepidic growth the results were averaged if the discrepancy was ≤ 10%. Otherwise a third pathologist reviewed the case and the two closest lepidic growth values were averaged. Cases ≥90% lepidic growth were categorized as 90%, 95%, 99, or 100% by two pathologists. Any discrepant cases were reviewed by a third pathologist and categorized based on the two closest values.
CT imaging
Chest CT scans were done on a variety of scanners. The scanners were all multi-detector scanners ranging from 8 to 64 detectors. Preoperative (≤ 3 months) thin section images were required in all cases. Collimation ranged from 1.25–2.5mm. Reconstruction algorithms varied by scanner and included both smoothing and high-resolution algorithms based on the vendor algorithms.
Radiology review
All preoperative CT-scans included in the training set were reviewed independently in a blinded fashion by two thoracic radiologists, (AMS and TEH). Both readers subjectively categorized each case as aggressive or indolent and measured the Tumor/Consolidation (C/T) ratio as previously described.13
Lung parenchymal characterization and nodule extraction
Lung parenchymal isolation and classification
The lung parenchyma was isolated by segmentation of pre-operative HRCT data using an adaptive density-based morphology approach involving threshold optimizing, region growing and hole filling. Lung parenchymal classification was based upon the previously identified exemplars representing five radiological lung tissue types, normal, emphysema, reticular, ground glass and honeycomb change. An exemplar represents the most central region of interest (ROI) within a natural cluster of ROIs and constitutes the basic building block for the CALIPER based lung parenchymal classification. These exemplars were derived based on the statistical analysis of representative HRCT data of patients with various parenchymal lung diseases that were selected from the Lung Tissue Research Consortium.12 Consequently, each lung parenchymal voxel was assigned to one of these five primal lung parenchymal HRCT patterns using CALIPER (See Supplemental Material, Supplemental Figures 1 and 2, Supplemental Table 1).
Nodule Extraction
The location of all surgically resected nodules was known a priori. Hence the nodule of interest was extracted with a supervised approach using constrained seeded region growing. Since GGO, SSO and SPN nodules are composed of reticular and ground glass patterns, the region growing was constrained to include only those voxels connected to the seed voxel and classified as either reticular or ground glass.
Statistical analysis
Multinomial logistic regression was used to generate equations predictive of the degree of histologic invasion (see results).
Due to the absence of a Gaussian distribution of the data for AIS and invasion, non-parametric Spearman correlation was used to analyze the relationship between histopathological and radiological invasion as determined by CANARY. The sensitivity, specificity as well as the positive and negative predictive value for CANARY to distinguish histopathologically “aggressive” from “indolent” lesions were calculated. A p value of < 0.05 was considered statistically significant. Cohen’s kappa was calculated as a statistical measure of the interrater-agreement between the thoracic radiologists. The Prism software package (GraphPad, San Diego, CA) was used for the statistical analysis.
The Mayo Foundation Institutional Review Board (IRB) approved the study.
Results
Subjects
For the training set 139 of the 208 identified cases were excluded due to absence of an appropriate pre-operative HRCT scan. Of the remaining 70 patients, 16 patients with lung masses (>3 cm) were excluded. Fifty-four patients with surgically resected pulmonary nodules of the adenocarcinoma spectrum were included in the analysis as the training set.
For the independent validation set, 86 nodules (80 patients) of consecutively resected pulmonary nodules with similar inclusion criteria as the training set were included in the analysis. The demographic characteristics, TNM stage, pathological nodule size and consensus histopathology diagnoses for these patients are included in Table 1 and Supplemental Figure 3.
Table 1.
Patient demographics, tumor stage, nodule size and histology
| Demographics | 54 patients (n = 54 nodules) Training Set |
80 patients (n = 86 nodules) Validation Set |
|---|---|---|
|
Age at diagnosis years: median (range) |
68 (40–89) | 68 (35–91) |
| Gender n (%) | ||
| Women | 35 (65) | 48 (60) |
| Smoking n (%) | ||
| Never | 17 (31) | 9 (11) |
| TNM Stage n (%) | ||
| IA | 42 (76) | 42 (52) |
| IB | 1 (2) | 12 (15) |
| IIA | 0 | 4 (5) |
| IIB | 8 (16) | 7 (9) |
| IIIA | 1 (2) | 8 (10) |
| IV | 2 (4) | 7 (9) |
| Nodule Size mm ± SD | 16.7 ± 0.69 | 17.2 ± 0.61 |
|
Histopathological Classification n (%) |
||
| AIS | 2 (6) | 1 (1) |
| MIA | 20 (36) | 10 (12) |
| IA | 32 (58) | 75 (87) |
Radiological nodule analysis and development of Computer Aided Nodule Assessment and Risk Yield (CANARY)
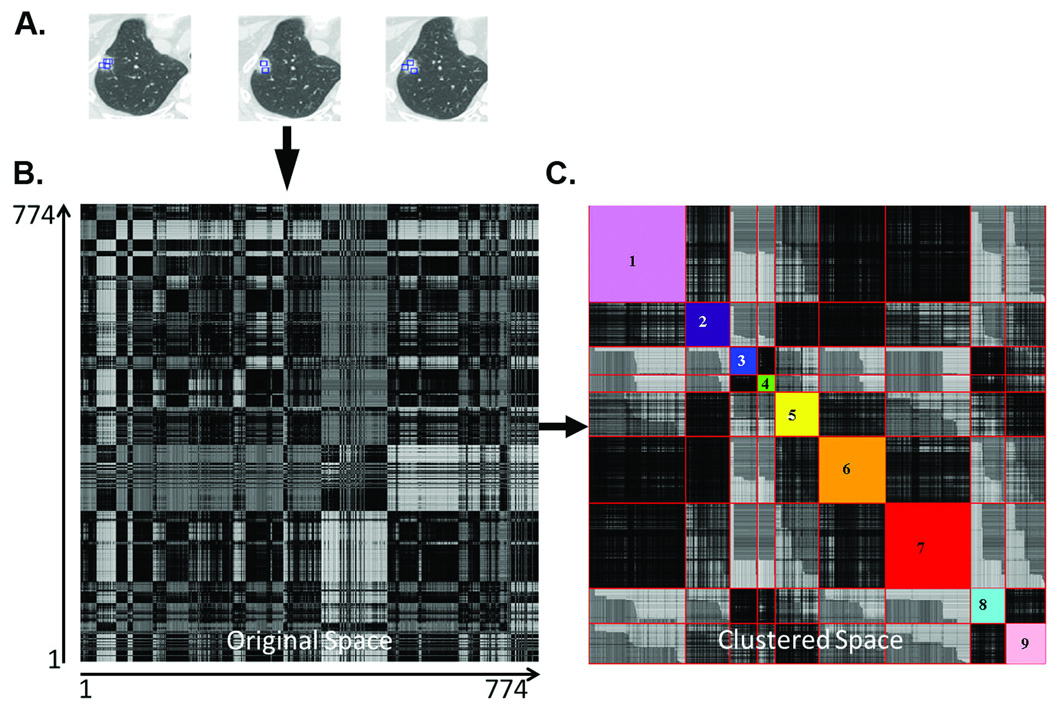
Conventional characterization of lung nodules on HRCT consists of semi-quantitative estimates of the solid and ground glass components by a trained radiologist. However, these nodules are represented by a complex combination of numerous contiguous voxels with a broad range of densities. Consequently, reducing this information to only two categories, solid or ground glass, likely results in the loss of potentially useful diagnostic information. Using CANARY we were able to successfully reduce this complex pattern of voxel densities to a limited number of representative exemplars, hypothesized to represent the essential building blocks of lung nodules of the adenocarcinoma spectrum. These exemplars were generated using the following approach. An expert thoracic radiologist (B.J.B.) arbitrarily selected 774 regions of interest (ROI; size= 9×9 voxels, Figure 2) spanning the radiological spectrum of these lesions across the HRCT scans of 37 randomly selected cases (37 of the 54 included cases). Natural clusters among these ROIs were identified by comparing all ROIs to one another using affinity propagation (an unsupervised clustering technique) and pairwise similarity metrics.14 This unsupervised analysis yielded 9 unique natural clusters of ROIs. The most central ROI within each cluster was chosen as the exemplar, or essential building block, of the lesions (see Supplemental material). These exemplars were color-coded as Violet (V), Indigo (I), Blue (B), Green (G), Yellow (Y), Orange (O), Red (R), Cyan (C) and Pink (P). These color-coded exemplars form the basic building blocks for the analysis and risk stratification of pulmonary nodules of the adenocarcinoma spectrum by CANARY (Figure 2.)
Figure 2.
Natural clustering of HRCT regions of interest (ROI) of lung nodules. Panel A shows representative ROIs selected from different nodules in the training set. Each of the 774 ROI were compared with each other to derive the pairwise 774×774 similarity matrix and color coded (Panel B) such that the darkness is proportional to the similarity. Panel C shows the similarity matrix in the Affinity Propagation based clustered space wherein the arbitrarily color-coded diagonal sub-blocks show the automatically computed natural clusters.
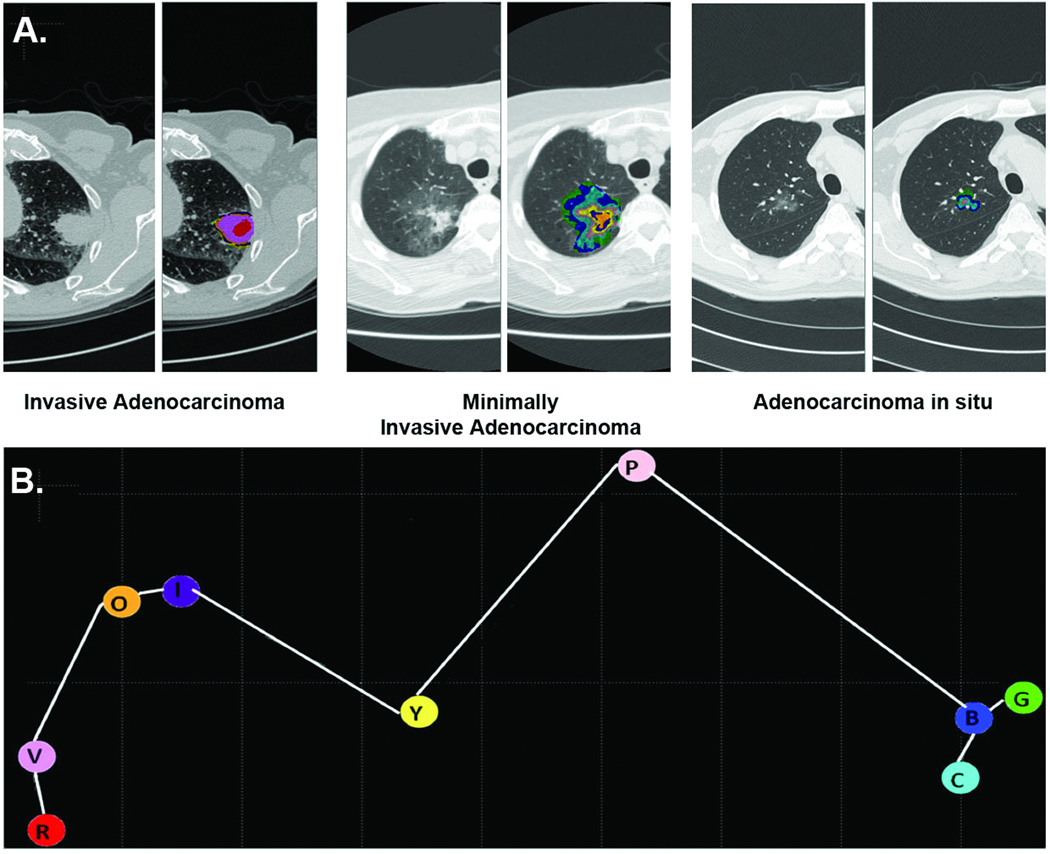
To characterize an extracted lung nodule, each voxel within the nodule was compared to all 9 exemplars. The most similar exemplar was computed using the pairwise comparison of histograms of the 9 × 9 voxel neighborhood of each voxel to the respective exemplars. The color code of the most similar exemplar was assigned to each individual voxel of the analyzed nodule. This approach resulted in a specific combination of exemplars (and color pattern) for each nodule. This distribution of exemplars within the nodule (signature) was visualized yielding concentric color-coded areas (Figure 3A). Hence, CANARY signatures were established without clinical input, solely based on radiologic characteristics.
Figure 3.
Representative signatures for invasive adenocarcinoma, minimally invasive adenocarcinoma and adenocarcinoma in situ (Panel A). Representative CT images with the superimposed distribution of the 9 adenocarcinoma exemplars are show for IA, MIA and AIS. Panel B shows the three-dimensional distribution of the 9 adenocarcinoma exemplars using Multi-Dimensional Scaling. It demonstrates the secondary clustering of the exemplars, violet-indigo-red-orange (V-I-R-O) representing invasion, yellow-pink (Y-P) and blue-green-cyan (B-G-C) representing lepidic growth.
CANARY based assessment of the relative contributions of tissue invasion and lepidic growth in pulmonary nodules of the adenocarcinoma spectrum
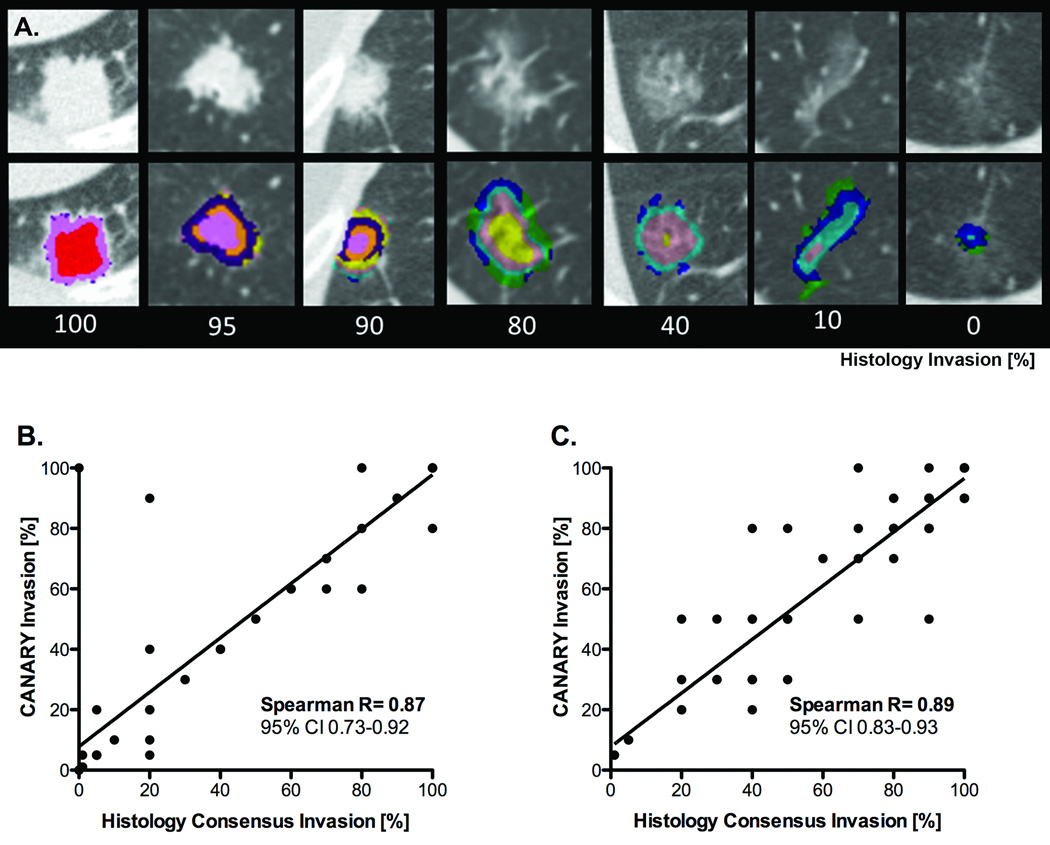
In order to investigate the face validity of the CANARY lung nodule signatures, we attempted to determine whether specific signatures (combination of exemplars) would correlate with distinct histologic characteristics. We elected to compare these radiologic signatures to a histologic measure of invasion defined as 100% - lepidic growth %. Sixteen nodules spanning the entire spectrum of invasion (from 0% to 100% as assessed by consensus pathology) were included in a multinomial logistic regression analysis to generate equations to radiologically predict the proportion of histologic tissue invasion. These predictive equations were then validated on the remaining 38 nodules. In addition the excellent correlation between CANARY and consensus histopathology was confirmed in an independent Validation Set. (Figure 4)
Figure 4. Radiological-histopathologic correlation of tissue invasion between CANARY based nodule assessment and consensus histopathology.
Examples of representative CT images with superimposed CANARY “signatures” (distinctive combinations of exemplars within one nodule) associated with nodules with varying degrees of histological invasion (%, 100 – consensus histopathology lepidic growth %) (Panel A.).
Correlation between CANARY and consensus histopathology for pulmonary nodules of the adenocarcinoma spectrum, Training Set, excluding 16 cases used to develop CANARY (n=38), Panel B. and Validation Set (n=86), Panel C. Spearman’s correlation (p<0.0001), line represents linear regression (Panels B. and C.).
With the exception of two cases, correlation between CANARY and consensus histopathology was excellent (Spearman R=0.87, 95% CI [0.78–0.92], p < 0.0001) among the 38 cases of the training set and even better, Spearman R=0.89, [0.83–0.93], p < 0.0001 in the independent Validation Set of 86 nodules from 80 patients. (Figure 4)
The two discrepant cases were reviewed in detail. For one case CANARY determined the lesion to be 100% invasive whereas consensus histologic assessment found no invasion. For the second case CANARY measured 80% invasion compared to 20% by consensus histology. These cases were found to be solid opacities radiologically while characterized by minimal invasion on histopathologic evaluation, explaining the discordant results between CANARY assessment and histopathology.
CANARY based non-invasive radiological risk stratification of pulmonary nodules of the adenocarcinoma spectrum
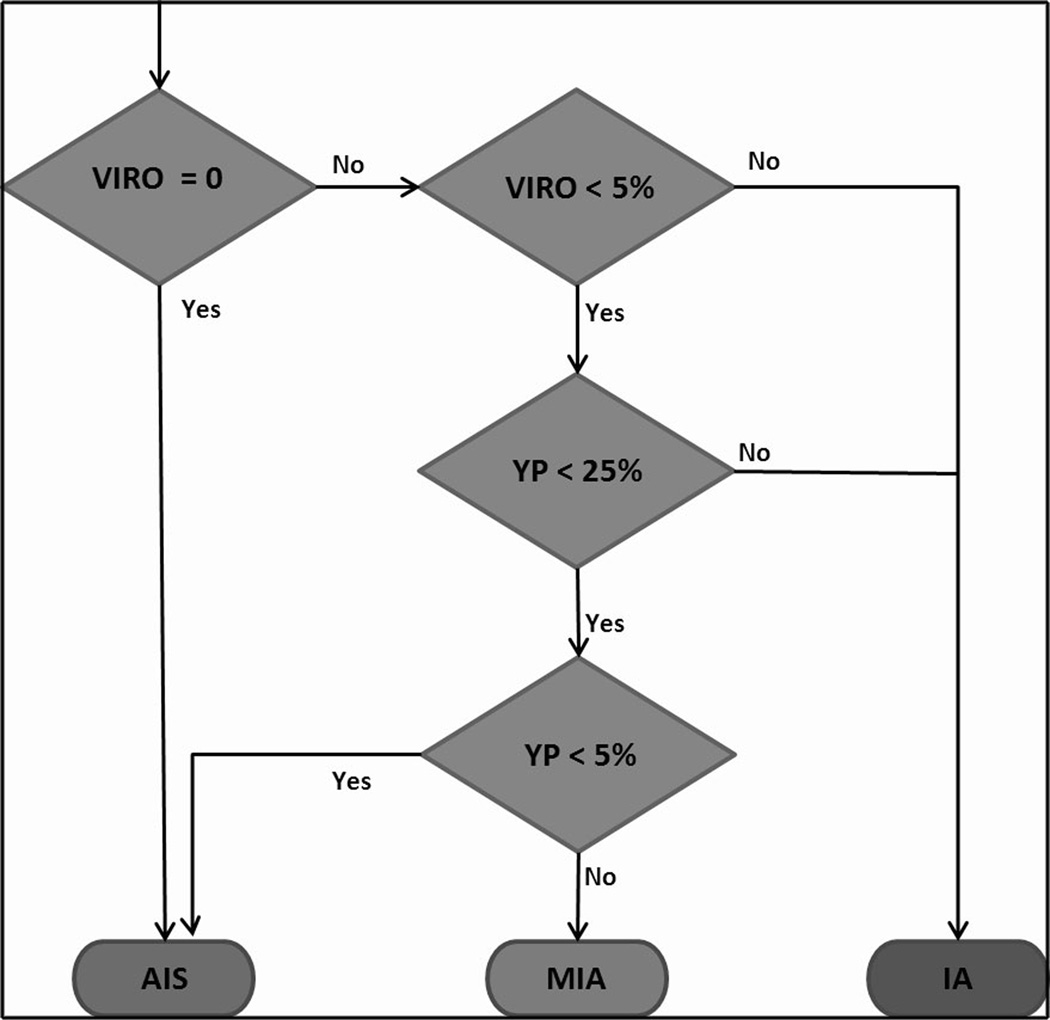
Subsequently, Multi-Dimensional Scaling was used to understand the three-dimensional distribution of the 9 adenocarcinoma exemplars.15 The space partitioned into three natural exemplar clusters corresponding to the V-I-R-O, Y-P and B-G-C exemplars. The quantitative distribution of the different exemplars and the rule-based CANARY decision algorithm were used to categorize each of the pulmonary nodules. Based on the observation that V-I-R-O and B-G-C groups correlated predominantly with invasion and lepidic growth, respectively, a rule-based CANARY decision algorithm was developed to categorize every nodule as AIS, MIA or IA. (Figures 3B and 5)
Figure 5.
Rule-based CANARY decision algorithm based on the distribution of exemplar clusters (%): violet-red-orange (VIRO), yellow-pink (YP) and blue-green-cyan (BGC) within each lesion.
Patients with AIS and MIA share a similarly favorable post-surgical prognosis. This contrasts with the worse postoperative survival of patients with IA. Consequently, we classified all cases as either Group 1histology “aggressive” (n=32, training set and n=75, validation set) (IA) or Group 2histology “indolent” (n=22, training set and n=11 validation set) (AIS & MIA) based on predominance of the VIRO (aggressive) YP (moderately aggressive) or the BGC (indolent) cluster. Sensitivity, specificity, positive predictive value and negative predictive value for the detection of histopathologic “aggressive” lesions utilizing the CANARY decision algorithm were calculated. The sensitivity was 95.4% [95% CI 75.1–99.7%] and 98.7% [95% CI 91.8–99.9%], the specificity was 96.8% [95% CI 82–99.8%] and 63.6% [95% CI 31.6–87.6%], the positive predictive value was 95.4% [95% CI 75.1–99.7%] and 94.9% [95% CI 86.7–98.3%], and the negative predictive value was 96.8% [95% CI 82–99.8%] and 87.5% [95% CI 46.7–99.3%] in the training and validation set respectively (Figure 6)
Figure 6.

Two by two contingency table of CANARY’s diagnostic performance (rows) to predict consensus histopathological tissue invasion (columns). Panel A. Training Set (n=54) and Panel B. Validation Set (n=86)
None of the “indolent” cases identified by CANARY in the training or validation sets presented with locally advanced of metastatic disease. In the validation set lung cancer specific post-surgical survival of the “indolent” and “aggressive” CANARY groups mirrored that of the AIS/MIA and IA groups identified by consensus histopathology. (Figure 7)
Figure 7.
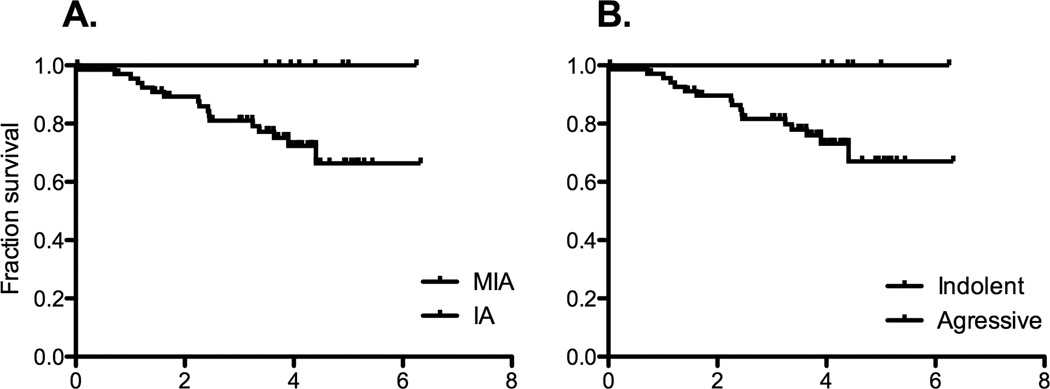
Lung cancer specific post-operative survival. Panel A. Consensus histopathology and Panel B. CANARY.
Semi-quantitative review of the training set
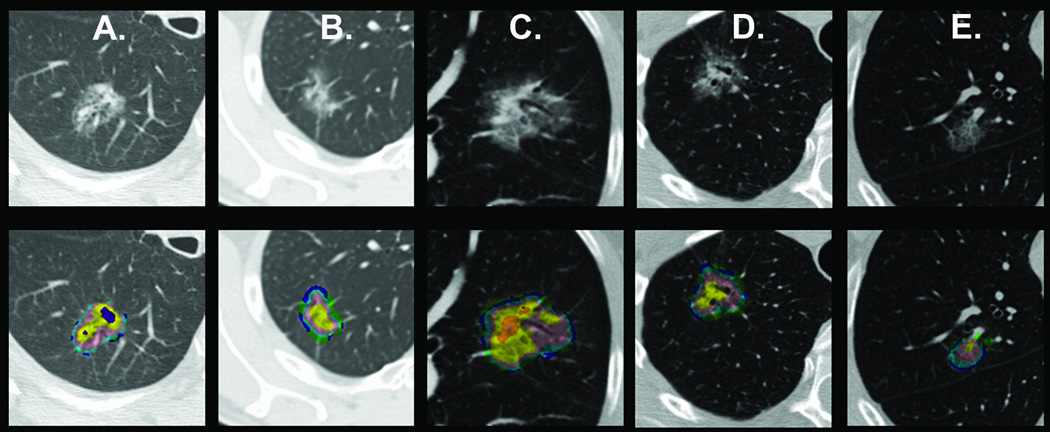
Based on the case review by the treating physician, the assessment of the clinical radiologist and patient preferences all 140 nodules included in the training and validation sets were judged to be worrisome enough to be resected. All 54 preoperative CT-scans analyzed by CANARY in the training set were reviewed independently in a blinded fashion by two thoracic radiologists, (AMS and TEH). Both readers subjectively categorized each case as aggressive (IA) or indolent (AIS or MIA). There was moderate agreement with a kappa of 0.49, [95% CI 0.21–0.78]. Based on consensus histology 36 cases were correctly categorized by both radiologists. In 10 cases the readers disagreed and 8 cases were incorrectly classified by both. Seven cases were classified as aggressive as opposed to indolent and 1 case as indolent as opposed to aggressive. Representative cases misclassified by both radiologists but correctly identified by CANARY are shown in Figure 8.
Figure 8.
Representative nodules with discrepant radiologic and histologic classification. Nodules in panels A and B were categorized differently by the expert radiologists (IA versus MIA) but correctly identified by CANARY (histologic consensus MIA).
Histology confirmed MIA nodules in (C) and (D) were categorized by both radiologists as IA. The histologically confirmed IA nodule in (E) was categorized by both the radiologists as MIA. The rule-based CANARY categorization of these nodules was the same as histology consensus.
Utilizing a C/T ratio of ≤ 0.25 to classify the pulmonary nodules as either indolent (≤ 0.25) or aggressive (> 0.25) we observed better agreement (substantial agreement), kappa 0.78, [95% CI 0.60–0.96], between the two readers. In the training set a C/T ratio ≤ 0.25 by consensus or average between the two readers detected invasion with a sensitivity of 91% [95% CI 74–98%] and a specificity of 55% [95% CI 33–75%].
Discussion
The ever-increasing utilization of HRCT imaging of the lungs has led to a substantial increase in the number of detected pulmonary nodules. In addition, the results of the recently published NLST will almost certainly prompt the implementation of comprehensive HRCT screening programs for high-risk individuals. This strategy has already been endorsed by some of the major medical societies.4,16 Pulmonary nodules of the adenocarcinoma spectrum represent the majority of HRCT detected lung cancers and the biological behavior of a sub-group of these lesions appears to differ significantly from their clinically detected counterparts, though arguably the data regarding the natural history of these lesions are limited.5. Radiologically, these lesions often present as solitary or not uncommonly multiple subsolid or pure groundglass opacities, for which the optimal management strategies are suboptimally defined. Consequently, the indiscriminate implementation of a mass HRCT screening program and routine utilization of standard surgical therapy (lobectomy) as opposed to currently available alternatives such as limited resection or stereotactic body radiation therapy would potentially result in excess mortality, morbidity and healthcare cost. This paradigm shift in our understanding of lung cancer will require the urgent development and implementation of new non-invasive strategies for the risk stratification and guidance of the individualized management of HRCT detected pulmonary nodules.13
Unsupervised CANARY based analysis of HRCT data identified nine exemplars across the spectrum of pulmonary nodules of the lung adenocarcinoma spectrum. These exemplars segregate into 3 clusters, which appear to visually correspond to the predominant histopathology of the lesion. Whereas the B-G-C cluster represents lepidic growth, the V-I-R-O cluster correlates with tissue invasion. By providing additional HRCT descriptors beyond well-established categories such as ground glass opacity and consolidation, CANARY based analysis facilitates the individualized characterization of pulmonary nodules of the lung adenocarcinoma spectrum. Based on the CANARY analysis and the consensus histopathology of the lesion we successfully designed and optimized a decision algorithm for the non-invasive risk stratification into “aggressive” (IA) and “indolent” lesions (AIS and MIA). Through automated volumetric quantitation of the lesions, CANARY provides the opportunity for the non-invasive preoperative characterization and risk stratification of pulmonary nodules of the lung adenocarcinoma spectrum. If validated in future prospective studies, CANARY could ultimately become a valuable tool to assist in the individualized management of these lesions (e.g. limited surgical resection VS. standard of care).17
Other investigators have successfully demonstrated the value of comprehensive histological assessment to predict the postsurgical disease specific survival (biologic behavior) of these pulmonary nodules. In this context pure lepidic growth (AIS) and ≤ 5 mm invasion (MIA) are associated with significantly better patient outcomes than lesions with > 5 mm invasion (IA).10,18–23 These observations are reflected in the revised 2011 histological classification of pulmonary adenocarcinomas.11 Unfortunately, comprehensive histological tumor tissue analysis requires the surgical removal of the lesion and is not feasible for preoperative treatment planning. In contrast, HRCT allows the comprehensive and non-invasive characterization of pulmonary nodules. However the accurate and reproducible assessment of pulmonary nodules, including solid and sub-solid opacities, remains challenging. Difficulties include large interobserver variability in the assessment of simple variables such as variation of size over time to estimates of volume-doubling times. Despite previous reports demonstrating some correlation between lepidic growth and tissue invasion with ground glass and solid opacities by HRCT, respectively, these strategies remain suboptimal.19,24–28
Previously reported semi-quantitative strategies to characterize pulmonary nodule evaluated characteristics of these lesions include diameter, area, modified diameter (consolidation to ground glass opacity ratio) and the vanishing ratio (portion of the nodule that remains visible from parenchyma to mediastinal windows).29–31 While initial studies suggested that the vanishing ratio might be the most reliable parameter to characterize these lesions, a recently published large prospective study of 545 patients demonstrated that the consolidation to tumor ratio (C/T ratio) might represent a better predictor in a Japanese patient population.32 In this study a C/T ratio more than 0.25 predicted the presence of invasive adenocarcinomas among nodules ≤ 2 cm with a sensitivity of 98.7% (78/79, 95% CI: 93.2–100%) but with a specificity of 16.2% (34/210, 95% CI: 11.5–21.9%).
In contrast to automated computer aided strategies such as CANARY, intra- and interobserver variability remains a significant issue for the subjective classification and operator driven semi-quantitative measurements of theses lesions. This was confirmed in our study, as we observed only moderate agreement between two expert thoracic radiologists for the subjective classification of the cases of our training set into “aggressive” or “indolent” cases. Despite better agreement between the two expert readers, the diagnostic performance of semi-quantitative tumor measurements (C/T ratio ≤ 0.25) was inferior to CANARY in our training set. Most importantly the semi-quantitative assessment missed two additional invasive cases.
Few previous reports have addressed the value of automated computer-aided imaging in the characterization and categorization of these pulmonary nodules. In a pilot study, histogram peaks of 2-dimensional CT images were found to be moderately discriminative between atypical adenomatous hyperplasia and bronchioloalveolar carcinoma, but with significant overlap.33 Volumetric analysis using density histograms was more discriminative and seemed to categorize atypical adenomatous hyperplasia, bronchioloalveolar carcinoma and invasive adenocarcinoma. However, the study was limited by very small sample size and a lack of validation.34
Our study has several limitations. It is a pilot study and as such, the CANARY methodology will have to be validated in further independent retrospective and prospective patient cohorts. Prospective validation is currently ongoing. Another substantial limitation is the absence of true gold standard test for the risk assessment of pulmonary nodules of the lung adenocarcinoma spectrum. The value of radiological-pathological correlation is limited for several important reasons. First, histology represents a surrogate marker for patient outcomes and consequently CANARY based nodule assessment ultimately will need to be correlated to meaningful clinical outcome measures such as metastatic lymph node involvement and progression free survival. This correlation is currently ongoing in our validation study. Furthermore, in the absence of a standardized approach for semi-quantitative assessment for histopathological evaluation, measurements of lepidic growth and invasion size are subject to intra- and interobserver variability. In that regard, it is important to consider that the comprehensive (volumetric) analysis of the histological samples is limited by the thickness of the tissue blocks (5–10 mm) and the number of slides/tissue block evaluated (1×10µm section/block), whereas CANARY allows a full volumetric analysis of the lesion. While this may limit the interpretation of our current results (radiological-pathological correlation), we also recognize that this may represent a strength of CANARY when correlated to patient-centered outcome measures. In addition, we acknowledge that the use of different scanners and acquisition protocols for the CT scans, due to the retrospective nature of our study, may have influenced our results. We are currently in the process of investigating the differences in the CANARY signatures due to different CT scanners and determine the optimal reconstruction algorithm. Another limitation of our study is that the natural history of screen-detected subsolid opacities of the adenocarcinoma spectrum remains unknown. However, the post-surgical biological behavior of these lesions appears to correlate well with the histologic predictors of outcomes that correlated to CANARY.
Whereas this pilot study is restricted to cases of histologically confirmed adenocarcinomas, we hope to expand the use of CANARY to classify screening detected pulmonary nodules. We are currently investigating whether a CANARY based approach can classify screening detected pulmonary nodules into benign and malignant lesions and identify clinically “aggressive” lesions of the adenocarcinoma spectrum using the NLST dataset.
In conclusion, after further validation, the CANARY based non-invasive risk stratification of pulmonary nodules of the adenocarcinoma spectrum using a preoperative HRCT could be applied to guide the individualized management of these lesions and may offer valuable insight into the biology of this type of lung cancer. Furthermore, future use of CANARY for the assessment of serial imaging studies to highlight both qualitative and quantitative longitudinal changes across serial imaging studies might improve its diagnostic yield beyond that of the current single time point evaluation.
Supplementary Material
Figure 1.
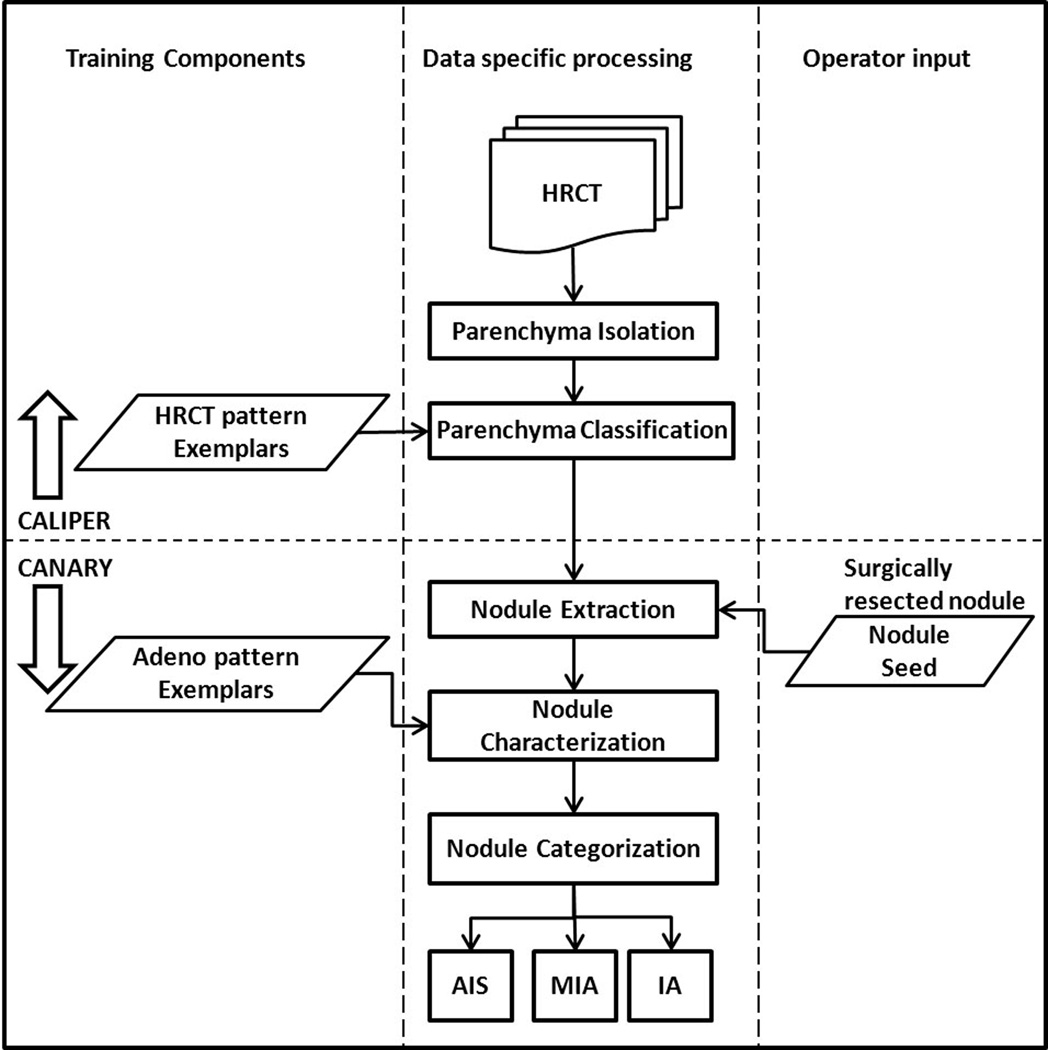
CANARY workflow outlining the procedural steps involved in categorizing the HRCT based nodules into one of AIS, MIA and IA. The first step involves the automated lung parenchymal isolation and classification using CALIPER. Subsequently, each nodule is identified by the operator using seed placement. This is followed the automated volumetric extraction of the nodule and the characterization of each voxel within a given nodule based on the 9 exemplars. This distribution of the exemplars within an individual lesion is than used to categorize each nodule.
Acknowledgments
Funding: Eagles Pilot Award (TP), V-Foundation Scholar Award (TP), K12 Award CA90628 (TP), Annenberg Career Development Award (FM), NIH R01CA84354 (PY)
Footnotes
Publisher's Disclaimer: This is a PDF file of an unedited manuscript that has been accepted for publication. As a service to our customers we are providing this early version of the manuscript. The manuscript will undergo copyediting, typesetting, and review of the resulting proof before it is published in its final citable form. Please note that during the production process errors may be discovered which could affect the content, and all legal disclaimers that apply to the journal pertain.
References
- 1.Jemal A, Bray F, Center MM, Ferlay J, Ward E, Forman D. Global cancer statistics. CA Cancer J Clin. 2011;61:69–90. doi: 10.3322/caac.20107. [DOI] [PubMed] [Google Scholar]
- 2.Jemal A, Siegel R, Xu J, Ward E. Cancer statistics, 2010. CA Cancer J Clin. 2010;60:277–300. doi: 10.3322/caac.20073. [DOI] [PubMed] [Google Scholar]
- 3.Groome PA, Bolejack V, Crowley JJ, et al. The IASLC Lung Cancer Staging Project: validation of the proposals for revision of the T, N, and M descriptors and consequent stage groupings in the forthcoming (seventh) edition of the TNM classification of malignant tumours. J Thorac Oncol. 2007;2:694–705. doi: 10.1097/JTO.0b013e31812d05d5. [DOI] [PubMed] [Google Scholar]
- 4.Aberle DR, Adams AM, Berg CD, et al. Reduced lung-cancer mortality with low-dose computed tomographic screening. N Engl J Med. 2011;365:395–409. doi: 10.1056/NEJMoa1102873. [DOI] [PMC free article] [PubMed] [Google Scholar]
- 5.Detterbeck FC, Gibson CJ. Turning gray: the natural history of lung cancer over time. J Thorac Oncol. 2008;3:781–792. doi: 10.1097/JTO.0b013e31817c9230. [DOI] [PubMed] [Google Scholar]
- 6.Henschke CI, Yankelevitz DF, Libby DM, Pasmantier MW, Smith JP, Miettinen OS. Survival of patients with stage I lung cancer detected on CT screening. N Engl J Med. 2006;355:1763–1771. doi: 10.1056/NEJMoa060476. [DOI] [PubMed] [Google Scholar]
- 7.Swensen SJ, Jett JR, Hartman TE, et al. CT screening for lung cancer: five-year prospective experience. Radiology. 2005;235:259–265. doi: 10.1148/radiol.2351041662. [DOI] [PubMed] [Google Scholar]
- 8.Godoy MC, Naidich DP. Subsolid pulmonary nodules and the spectrum of peripheral adenocarcinomas of the lung: recommended interim guidelines for assessment and management. Radiology. 2009;253:606–622. doi: 10.1148/radiol.2533090179. [DOI] [PubMed] [Google Scholar]
- 9.Motoi N, Szoke J, Riely GJ, et al. Lung adenocarcinoma: modification of the 2004 WHO mixed subtype to include the major histologic subtype suggests correlations between papillary and micropapillary adenocarcinoma subtypes, EGFR mutations and gene expression analysis. Am J Surg Pathol. 2008;32:810–827. doi: 10.1097/PAS.0b013e31815cb162. [DOI] [PubMed] [Google Scholar]
- 10.Yoshizawa A, Motoi N, Riely GJ, et al. Impact of proposed IASLC/ATS/ERS classification of lung adenocarcinoma: prognostic subgroups and implications for further revision of staging based on analysis of 514 stage I cases. Mod Pathol. 2011;24:653–664. doi: 10.1038/modpathol.2010.232. [DOI] [PubMed] [Google Scholar]
- 11.Travis WD, Brambilla E, Noguchi M, et al. International association for the study of lung cancer/american thoracic society/european respiratory society international multidisciplinary classification of lung adenocarcinoma. J Thorac Oncol. 2011;6:244–285. doi: 10.1097/JTO.0b013e318206a221. [DOI] [PMC free article] [PubMed] [Google Scholar]
- 12.Zavaletta VA, Bartholmai BJ, Robb RA. High resolution multidetector CT-aided tissue analysis and quantification of lung fibrosis. Acad Radiol. 2007;14:772–787. doi: 10.1016/j.acra.2007.03.009. [DOI] [PMC free article] [PubMed] [Google Scholar]
- 13.Suzuki K, Koike T, Asakawa T, et al. A prospective radiological study of thin-section computed tomography to predict pathological noninvasiveness in peripheral clinical IA lung cancer (Japan Clinical Oncology Group 0201) J Thorac Oncol. 2011;6:751–756. doi: 10.1097/JTO.0b013e31821038ab. [DOI] [PubMed] [Google Scholar]
- 14.Frey BDD. Clustering by passing messages between data points. Science. 2007;315:972–976. doi: 10.1126/science.1136800. [DOI] [PubMed] [Google Scholar]
- 15.Cox TFCM. Multidimensional scaling. 2nd ed. New York: 2001. [Google Scholar]
- 16.Bach PB, Mirkin JN, Oliver TK, et al. Benefits and harms of CT screening for lung cancer: a systematic review. Jama. 2012;307:2418–2429. doi: 10.1001/jama.2012.5521. [DOI] [PMC free article] [PubMed] [Google Scholar]
- 17.Van Schil PE, Asamura H, Rusch VW, et al. Surgical implications of the new IASLC/ATS/ERS adenocarcinoma classification. Eur Respir J. 2012;39:478–486. doi: 10.1183/09031936.00027511. [DOI] [PubMed] [Google Scholar]
- 18.Russell PA, Wainer Z, Wright GM, Daniels M, Conron M, Williams RA. Does lung adenocarcinoma subtype predict patient survival?: A clinicopathologic study based on the new International Association for the Study of Lung Cancer/American Thoracic Society/European Respiratory Society international multidisciplinary lung adenocarcinoma classification. J Thorac Oncol. 2011;6:1496–1504. doi: 10.1097/JTO.0b013e318221f701. [DOI] [PubMed] [Google Scholar]
- 19.Noguchi M, Morikawa A, Kawasaki M, et al. Small adenocarcinoma of the lung. Histologic characteristics and prognosis. Cancer. 1995;75:2844–2852. doi: 10.1002/1097-0142(19950615)75:12<2844::aid-cncr2820751209>3.0.co;2-#. [DOI] [PubMed] [Google Scholar]
- 20.Borczuk AC, Qian F, Kazeros A, et al. Invasive size is an independent predictor of survival in pulmonary adenocarcinoma. Am J Surg Pathol. 2009;33:462–469. doi: 10.1097/PAS.0b013e318190157c. [DOI] [PMC free article] [PubMed] [Google Scholar]
- 21.Yim J, Zhu LC, Chiriboga L, Watson HN, Goldberg JD, Moreira AL. Histologic features are important prognostic indicators in early stages lung adenocarcinomas. Mod Pathol. 2007;20:233–241. doi: 10.1038/modpathol.3800734. [DOI] [PubMed] [Google Scholar]
- 22.Maeshima AM, Tochigi N, Yoshida A, Asamura H, Tsuta K, Tsuda H. Histological scoring for small lung adenocarcinomas 2 cm or less in diameter: a reliable prognostic indicator. J Thorac Oncol. 2010;5:333–339. doi: 10.1097/JTO.0b013e3181c8cb95. [DOI] [PubMed] [Google Scholar]
- 23.Vazquez M, Carter D, Brambilla E, et al. Solitary and multiple resected adenocarcinomas after CT screening for lung cancer: histopathologic features and their prognostic implications. Lung Cancer. 2009;64:148–154. doi: 10.1016/j.lungcan.2008.08.009. [DOI] [PMC free article] [PubMed] [Google Scholar]
- 24.Leader JK, Warfel TE, Fuhrman CR, et al. Pulmonary nodule detection with low-dose CT of the lung: agreement among radiologists. AJR Am J Roentgenol. 2005;185:973–978. doi: 10.2214/AJR.04.1225. [DOI] [PubMed] [Google Scholar]
- 25.Bogot NR, Kazerooni EA, Kelly AM, Quint LE, Desjardins B, Nan B. Interobserver and intraobserver variability in the assessment of pulmonary nodule size on CT using film and computer display methods. Acad Radiol. 2005;12:948–956. doi: 10.1016/j.acra.2005.04.009. [DOI] [PubMed] [Google Scholar]
- 26.Singh S, Pinsky P, Fineberg NS, et al. Evaluation of reader variability in the interpretation of follow-up CT scans at lung cancer screening. Radiology. 2011;259:263–270. doi: 10.1148/radiol.10101254. [DOI] [PMC free article] [PubMed] [Google Scholar]
- 27.Kakinuma R, Ohmatsu H, Kaneko M, et al. Progression of focal pure ground-glass opacity detected by low-dose helical computed tomography screening for lung cancer. J Comput Assist Tomogr. 2004;28:17–23. doi: 10.1097/00004728-200401000-00003. [DOI] [PubMed] [Google Scholar]
- 28.Jennings SG, Winer-Muram HT, Tann M, Ying J, Dowdeswell I. Distribution of stage I lung cancer growth rates determined with serial volumetric CT measurements. Radiology. 2006;241:554–563. doi: 10.1148/radiol.2412051185. [DOI] [PubMed] [Google Scholar]
- 29.Kakinuma R, Kodama K, Yamada K, et al. Performance evaluation of 4 measuring methods of ground-glass opacities for predicting the 5-year relapse-free survival of patients with peripheral nonsmall cell lung cancer: a multicenter study. J Comput Assist Tomogr. 2008;32:792–798. doi: 10.1097/RCT.0b013e31815688ae. [DOI] [PubMed] [Google Scholar]
- 30.Suzuki K, Koike T, Asakawa T, et al. A prospective radiological study of thin-section computed tomography to predict pathological noninvasiveness in peripheral clinical IA lung cancer (Japan Clinical Oncology Group 0201) J Thorac Oncol. 2011;6:751–756. doi: 10.1097/JTO.0b013e31821038ab. [DOI] [PubMed] [Google Scholar]
- 31.Shimada Y, Yoshida J, Hishida T, Nishimura M, Ishii G, Nagai K. Predictive Factors of Pathologically Proven Noninvasive Tumor Characteristics in T1aN0M0 Peripheral Non-small Cell Lung Cancer. Chest. 2012;141:1003–1009. doi: 10.1378/chest.11-0017. [DOI] [PubMed] [Google Scholar]
- 32.Kozu Y, Tsuta K, Kohno T, et al. The usefulness of mutation-specific antibodies in detecting epidermal growth factor receptor mutations and in predicting response to tyrosine kinase inhibitor therapy in lung adenocarcinoma. Lung Cancer. 2011;73:45–50. doi: 10.1016/j.lungcan.2010.11.003. [DOI] [PubMed] [Google Scholar]
- 33.Nomori H, Ohtsuka T, Naruke T, Suemasu K. Differentiating between atypical adenomatous hyperplasia and bronchioloalveolar carcinoma using the computed tomography number histogram. Ann Thorac Surg. 2003;76:867–871. doi: 10.1016/s0003-4975(03)00729-x. [DOI] [PubMed] [Google Scholar]
- 34.Ikeda K, Awai K, Mori T, Kawanaka K, Yamashita Y, Nomori H. Differential diagnosis of ground-glass opacity nodules: CT number analysis by three-dimensional computerized quantification. Chest. 2007;132:984–990. doi: 10.1378/chest.07-0793. [DOI] [PubMed] [Google Scholar]
Associated Data
This section collects any data citations, data availability statements, or supplementary materials included in this article.


