Abstract
Purpose
To assess changes in apparent diffusion coefficient (ADC) and fractional anisotropy (FA) values in brainstem gliomas in children and to observe the temporal evolution of changes in the white matter tracts following therapy using diffusion tensor imaging (DTI) analysis.
Methods
Serial ADC and FA measurements were obtained in 3 patients with newly diagnosed brainstem gliomas on two approved treatment protocols. Values were compared with a set of normative ADC, FA, and eigenvalues of age-matched children of the corticospinal, transverse pontine and medial lemniscal tracts. Fiber tracking of the tracts coursing through the brainstem was performed using standard diffusion tractography analysis.
Results
We found increased ADC values within tumor at baseline compared to age-matched controls, with subsequent drop following treatment and subsequent increase with recurrence. Correspondingly, FA values were reduced at presentation, but transiently recovered during the phase of tumor response to treatment, and finally decreased significantly during tumor progression. These changes were concordant with the tractography analysis of white matter tracts in the brainstem. Based on these results, we suggest that initial changes in ADC and FA values reflects tract infiltration by tumor, but not complete disruption, whereas tumor progression results in complete loss of anisotropy possibly due to tract disruption.
Conclusion
Serial changes in ADC and FA values and tractography data in pediatric brainstem gliomas suggest initial tumor infiltration, with transient improvement on treatment and subsequent loss of tract anisotropy during tumor progression. This technique may have potential use in assessing response to treatment regimens for pediatric brainstem gliomas.
Keywords: MRI, diffusion tensor imaging, brainstem glioma, pediatrics
Introduction
Diffuse intrinsic brainstem gliomas (BSG) in children are a group of malignant tumors with a poor prognosis [1, 2]. These tumors are usually fibrillary astrocytomas (WHO grade II) or malignant WHO grade III or IV astrocytomas at diagnosis. Treatment of brainstem gliomas usually entails radiation therapy followed by or accompanied with chemotherapy, although outcomes after treatment are often poor [2, 3]. In addition to being the mainstay for diagnosis, conventional MR imaging has been used to monitor tumor response following therapy [4].
Diffusion tensor imaging (DTI) is a technique that detects anisotropic diffusion, thereby enabling delineation of the major fiber tracts in the brainstem [5]. Assessment of precise tract location and tumor effect (tract displacement or apparent interruption due to tumor invasion) are possible using DTI. Prior studies have studied the role of DTI in supratentorial tumors and shown the value of measuring apparent diffusion coefficient (ADC) and fractional anisotropy (FA) to characterize tumors and assess peritumoral involvement of white matter tracts [6–8]. Invasion of the key tracts in the brainstem by pontine tumors has also been analyzed using DTI data, and these studies have shown reduced FA and elevated ADC values [9, 10].
The purpose of our study was to assess the ADC and FA values in brainstem gliomas and observe the temporal evolution of changes in the white matter tracts following therapy. Patients were serially assessed over time which is unique in this study group. We hypothesized that tractography would enable us to examine the level of recovery in tract anisotropy and help assess the response to therapy.
Materials and Methods
This report describes findings in 3 patients with newly diagnosed brainstem gliomas from a single institution treated on two Institutional Review Board-approved Pediatric Brain Tumor Consortium protocols. All patients gave their informed consent prior to inclusion in the studies. All three patients had diffusion tensor imaging performed prior to initiation of therapy and at least four time points after the initiation of therapy. The first treatment protocol (PBTC-007) was a phase II trial of gefitinib (Iressa®, AstraZeneca, Wilmington, DE 250 mg/m2 once daily) administered concurrently with irradiation. The second protocol (PBTC-014) was a phase II trial of tipifarnib (Zarnestra®, Johnson and Johnson Pharmaceutical Research and Development, Raritan, NJ, 125 mg/m2/dose, twice daily) with concurrent irradiation. Diffusion tensor imaging was acquired in conjunction with other standard MRI sequences (T2, FLAIR and T1 with gadolinium) serially at protocol-specified time intervals (every 8 weeks during year 1, every 12 weeks thereafter and at completion of therapy). Each course in both PBTC-007 and PBTC-014 was defined as four weeks.
MRI Technique MRI of the brain was performed at 1.5T on a GE scanner (GE Medical Systems, Signa Excite, Waukesha, WI) using a standard head coil. Conventional imaging (4.0–5.0/0–1.5-mm gap) included fast spin echo T1-weighted (repetition time [TR] 400–700 ms, echo time [TE] 8–14 ms), fluid-attenuated inversion recovery (10002/160–170/inversion time [TI] 2200), T2-weighted (3250–5500/92–100), T1-weighted gradient echo (400–700/40), and fast spin echo T1-weighted images after administration of intravenous gadolinium. DTI was performed using an echoplanar imaging sequence (TR 6000–9200 ms, TE 73–108 ms, 5.0/0-mm gap, matrix 128 × 128 interpolated to 256 × 256) obtained in six noncollinear directions at a b value of 1000 s/mm2.
Image Analysis
Using the Vitrea® workstation (Vital Images, Minnetonka, MN) we performed volumetric tumor analyses on axial FLAIR sequences, and post-gadolinium axial T1 images with user-assisted semi-automated software; and then recorded tumor volumes on FLAIR and enhancement and cyst/necrosis on T1 gadolinium images [11].
Post-processing of the diffusion tensor imaging was performed using in house software written in IDL (ITT Visual Information Solutions™, Boulder, CO). Fractional anisotropy (FA), apparent diffusion coefficient (ADC), and the three eigenvector maps were generated for each series. FA color maps color-coded based on the direction of the principal eigenvector were also generated. The major white matter tracts running through the brainstem were located on each FA color map using visual inspection and reference to a white matter atlas. Regions of interest (ROIs) were drawn within the left/right corticospinal tracts, the left and right sides of the anterior transverse pontine fibers, the left and right sides of the posterior transverse pontine fibers, and the left/right medial lemnisci. If the tract could not be reliably identified, an ROI was placed in the approximate location of the tract in the brainstem. If the approximate location of the tract showed only necrosis, no ROI was chosen. These ROIs were then used to obtain the ADC, FA, and individual eigenvalues through the left and right side of each tract, and the average of the left and right FA graphed for each structure.
DTI data from age-matched controls were also obtained from the current NIH MRI database of normal brain development [12]. ADC, FA, and eigenvalues were extrapolated from DTI data of these controls and used to identify a baseline of normal values through the corticospinal, transverse pontine and medial lemniscal tracts of age-matched children.
Fiber tractography was performed based on the FACT algorithm and used to visualize the corticospinal tracts passing through the length of the brainstem. Superiorly, the corticospinal tract was visualized as far as practicable above the level of the corpus callosum. Using the Diffusion Toolkit and TrackVis software (Ruopeng Wang, Van J. Wedeen, TrackVis.org, Martinos Center for Biomedical Imaging, Massachusetts General Hospital, Boston, MA), fibers were tracked with an angle threshold of 35 degrees, FA threshold 0.2, and length threshold 10 mm. Attention was given to changes in the degree of disruption and displacement of the corticospinal tracts with reduction in size of tumor and tumor recurrence.
Case 1
Patient 1 was a previously well 17-year-old male with a history of progressive blurred vision, particularly when looking left, as well as coughing or choking when drinking liquids. In addition, he had approximately two months of early morning headaches.
MRI at presentation showed a T2 hyperintense pontine lesion on FLAIR images extending inferiorly into the upper medulla, posteriorly into the middle cerebellar peduncles and superiorly into the midbrain (Fig. 1A). Treatment was instituted on protocol PBTC 007 including radiation and concurrent gefitinib. Subsequent imaging performed after completion of radiotherapy showed decrease in tumor size (Fig 1B). Imaging performed fourteen months after therapy showed progression of tumor, with increased size as seen on FLAIR images (Fig 1C) and increased enhancement(not shown).
Fig 1.
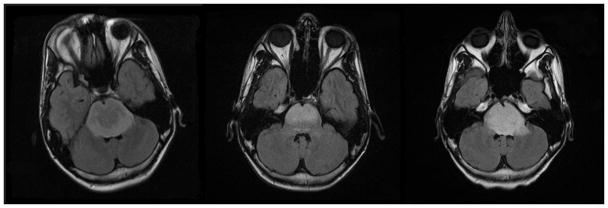
Fig 1A–C. Patient 1 Conventional MRI images
Fig 1A: MRI at presentation shows a T2 hyperintense pontine lesion on FLAIR images extending inferiorly into the upper medulla, posteriorly into the middle cerebellar peduncles and superiorly into the midbrain.
Fig 1B: MRI following completion of radiotherapy shows decrease in tumor size.
Fig 1C: Imaging performed fourteen months after therapy shows progression of tumor, with increased tumor size.
Tractography performed at these three time points shows initial attenuation of the corticospinal and transverse pontine fibers at diagnosis (Fig 2A). In contrast, the scan performed after completion of radiotherapy demonstrated improved visualization of the tracts coursing through the brainstem (Fig 2B), with recovery of the fractional anisotropy (Fig 3) and alignment in response to therapy, possibly as a result of reduction in edema within the tracts. Subsequently, tract visualization deteriorated (Fig 2C) in conjunction with progression of the tumor.
Fig 2.

Fig 2A–C. Patient 1 DTI Tractography Analysis
Fig 2A: Tractography at presentation shows initial attenuation of the corticospinal and transverse pontine fibers.
Fig 2B: Tractography performed after completion of radiotherapy demonstrates improved visualization of the corticospinal tracts and transverse pontine fibers coursing through the brainstem.
Fig 2C: With the progression of tumor there is decreased visualization of the transverse pontine fibers and corticospinal tracts.
Fig 3.
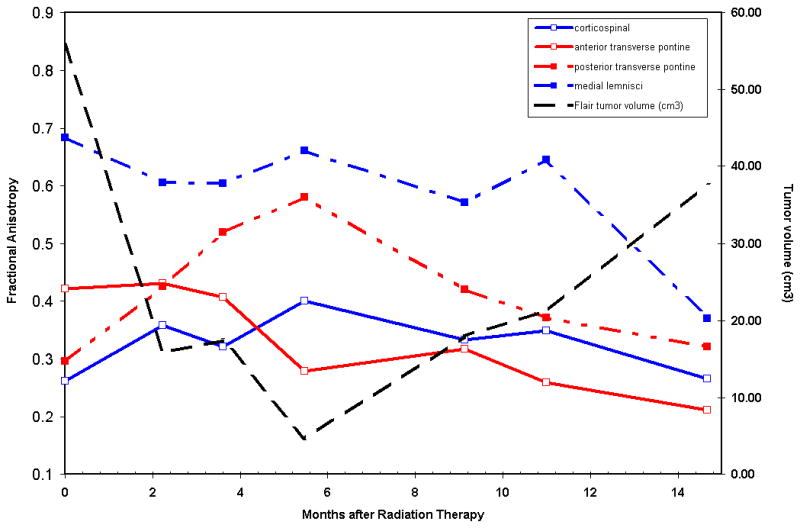
Patient 1 Correlation of Fractional anisotropy (FA) of Brainstem White Matter Tracts with Tumor Volume
Fractional anisotropy within the major tracts in the brainstem correlated with the tumor volume and time duration after radiotherapy. The FA recovers in the majority of tracts during the period of response to radiotherapy when the tumor volume also decreases and then the FA falls sharply during tumor progression.
Case 2
Patient 2 was a previously healthy seven-year-old who presented with a two week history of excessive blinking and squinting with subsequent progression to diplopia at the time of presentation to the hospital. MRI at presentation showed a non-enhancing lesion with T2 prolongation on FLAIR images (Fig 4A). Follow-up MRI performed at 8 weeks after presentation and institution of treatment on PBTC protocol 007 with gefitinib and concurrent radiation therapy showed decrease in size of the nonenhancing T2 prolongation within the pons compared to the prior study (Fig 4B). Clinical symptoms improved at this time. Imaging performed seven months after therapy showed increased size of the tumor, indicating tumor progression (Fig 4C).
Fig 4.
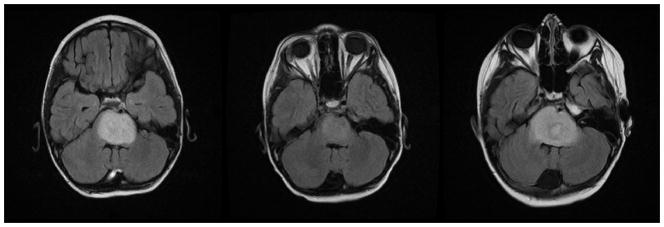
Fig 4A–C. Patient 2 Conventional MRI images
Fig 4A: MRI at presentation shows an expansile pontine mass with T2 prolongation.
Fig 4B: Follow-up MRI performed at 8 weeks after treatment shows decrease in amount of T2 prolongation within the pons compared to the prior study.
Fig 4C: Imaging performs seven months after therapy shows increased T2 signal in the pons consistent with tumor progression.
Tractography showed decreased visualization of the corticospinal and transverse pontine fibers at diagnosis (Fig 5A). Scan performed following completion of radiotherapy demonstrated improved visualization of the tracts coursing through the brainstem (Fig 5B), with recovery of the fractional anisotropy (Fig 6) and alignment in response to therapy. Subsequently, tracts in the brainstem were attenuated in conjunction with progression of the tumor (Fig 5C).
Fig 5.

Fig 5A–C. Patient 2 DTI Tractography Analysis
Fig 5A: Tractography shows decreased visualization of the corticospinal and transverse pontine fibers at diagnosis.
Fig 5B: Tractography following completion of radiotherapy demonstrated improved visualization of the tracts coursing through the brainstem.
Fig 5C: Attenuation of brainstem white matter tracts in conjunction with progression of the tumor.
Fig 6.
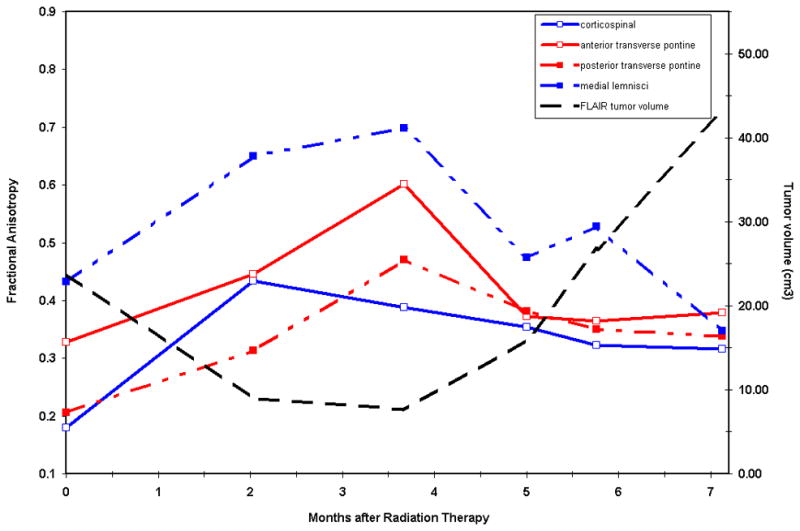
Patient 2 Correlation of Fractional anisotropy (FA) of Brainstem White Matter Tracts with Tumor Volume
There is recovery of the fractional anisotropy within major brainstem tracts in response to therapy.
Case 3
Patient 3 was a previously healthy four-year-old male who presented with a 4 day history of unsteady gait and ataxia, with more acute facial nerve palsy. An MRI performed at presentation demonstrated a T2 hyperintense mass in the pons (Fig 7A) with an enhancing central component and three smaller nodular areas of enhancement on the right side of the lesion (not shown). Treatment was instituted on protocol PBTC 014 using tipifarnib and radiation therapy. After an initial decrease in size of the tumor (Fig 7B), there was tumor progression with central necrosis seven months after treatment (Fig 7C).
Fig 7.
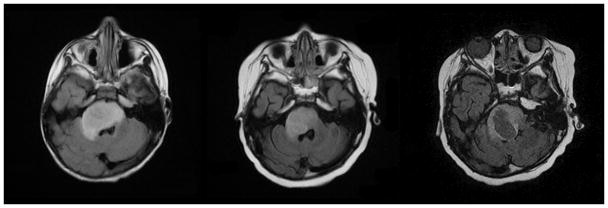
Fig 7A–C. Patient 3 Conventional MRI images
Fig 7A: MRI performed at diagnosis shows expansile T2 hyperintense lesion in the pons with mass effect on the right side of the fourth ventricle and extension into the right middle cerebellar peduncle.
Fig 7B: Initial decrease in size of the pontine tumor after initiation of therapy.
Fig 7C: Tumor progression with central necrosis within the right side of the pontine mass seven months after treatment.
Tractography at presentation (Fig 8A) demonstrated posterior displacement of medial lemnisci and anterior transverse pontine fibers and infiltration of the corticospinal tracts and posterior transverse pontine fibers. Subsequent imaging performed showed slightly improved visualization of the long tracts in the brainstem (Fig 8B) soon after completion of radiotherapy. At the time of tumor progression, tract visualization in the brainstem was poor (Fig 8C), indicating that the tracts were severely compromised, and individual tracts could not be identified on the color FA maps. Due to these limitations, calculation of exact ADC values within the tumor was not considered diagnostic in this case.
Fig 8.
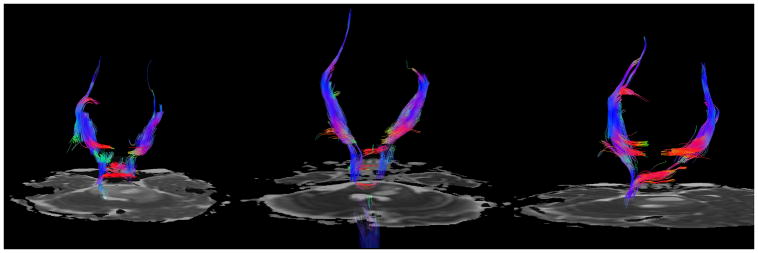
Fig 8A–C. Patient 3 Tractography analysis
Fig 8A. Diffusion tractography at presentation demonstrates posterior displacement of medial lemnisci and anterior transverse pontine fibers and infiltration of the corticospinal tracts and posterior transverse pontine fibers.
Fig 8B: Subsequent imaging shows slightly improved visualization of the corticospinal tracts in the brainstem after completion of radiotherapy.
Fig 8C: Visualization of the corticospinal tracts is decreased due to tumor progression.
Tumor volume versus time
After radiation there was decrease in tumor volume in all patients. At the time of progression of tumor there was increased tumor volume. Enhancement at baseline was present in 2 of the 3 patients with mean gadolinium enhancing volume of 1.81 cc (range 0.63– 2.99 cc).
The ADC values for the corticospinal tracts were compared to age-matched controls (AMC) in each case, and the results are shown in the graph (Fig 9). In all cases there was increase in ADC values within the tumor at baseline compared to age matched controls.
Fig 9.
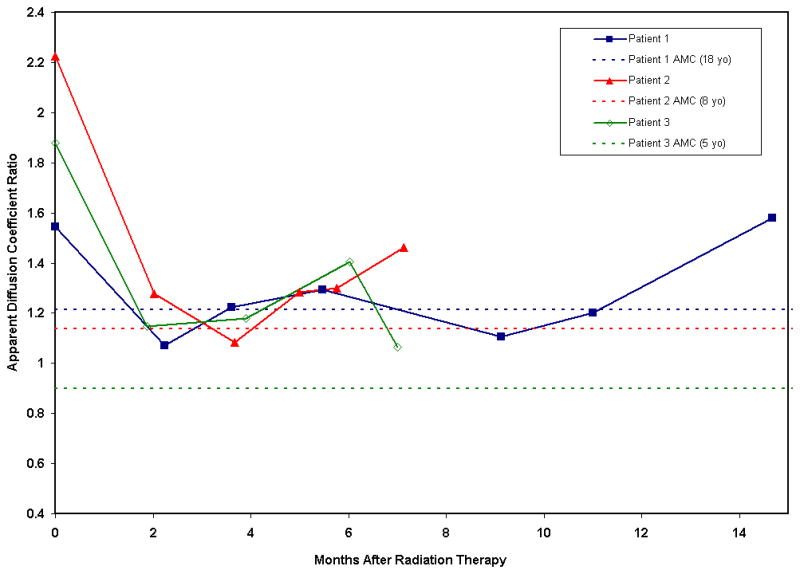
Apparent diffusion coefficient (ADC) ratio in the three patients compared to normal controls before and after radiation therapy shows decreased ADC tumor values after radiation therapy and subsequent increased ADC tumor values during tumor progression.
Discussion
This study followed BSG using serial DTI pre-therapy, during and after radiation therapy and drug therapy. BSGs have a number of features that preclude resection including their infiltration of the rich white matter network in the brainstem, which is quite often engulfed, displaced or destroyed by tumor growth [1, 13].
Our preliminary study provides insight on how the white matter tracts are affected by tumor and subsequently by radiation and treatment. Conventional MR imaging has previously been used to follow treatment of diffuse brain stem gliomas. However, the white matter appears homogeneous on MR images and therefore, it is not possible to distinguish the precise relationship of tumor with the white matter tracts. The ability of DTI to detect anisotropic diffusion and allow the visualization of major fiber tracts in the brainstem may provide information about tumor involvement of the white matter tracts. A recent study with a small number of cases has suggested the utility of tractography in differentiating between brainstem gliomas and demyelination, with the pattern of tract preservation being the distinguishing feature of the patients with demyelination. [14]
Prior studies have used quantitative DTI to explore the differences between the involvement of the corticospinal, transverse pontine and medial lemniscal tracts in patients with diffuse pontine gliomas and those with focal brainstem tumors [9, 15, 16]. Our report extends these observations in the more common diffusely infiltrating pontine gliomas by exploring the changes in the ADC and FA in these tracts associated with treatment response and subsequent disease progression.
Our cases showed diffuse infiltration of the corticospinal and transverse pontine tracts at presentation and displacement of the individual corticospinal tracts and posterior displacement of the medial lemnisci. As shown by other authors [9], we also observed that the corticospinal tracts and transverse pontine fibers are more often infiltrated or destroyed than were the medial lemnisci. This finding goes along with the common clinical presentation of children with pontine gliomas (long tract signs, ataxia, and cranial nerve deficits). The fact that the tracts show signs of recovery during treatment correlates with the clinical improvement, albeit transient, often observed in these patients.
This finding may also help understand the exact nature of white matter involvement by tumor in these patients. Prior reviews have discussed the altered states of white matter that result from neoplastic involvement, which may affect the measurement of diffusion tensor anisotropy and orientation, influencing patterns on directional DTI color maps [13, 17]. The possible mechanisms suggested include: 1) bulk displacement of intact white matter tracts by tumor (identifiable in their new location or orientation on directional DTI color maps with preserved anisotropy), 2) edema within preserved tracts (with some loss of some anisotropy but retention of enough directional organization to remain identifiable on directional DTI maps), 3) disruption of the directional organization of fiber tracts by infiltrating tumor, resulting in markedly altered color patterns on directional maps (causing substantially decreased anisotropy) and 4) complete tract disruption leading to isotropic diffusion resulting from loss of directional organization and diffusion anisotropy [13]. A combined mechanism with a mixture of edema and tumor invasion has also been proposed. Based on our results, the transient recovery suggests that the drop in FA at presentation reflects tract infiltration by tumor, but not complete disruption. Subsequently, however, tumor progression, as in case 3, results in complete loss of anisotropy due to complete tract disruption.
Another finding that warrants highlighting is that the ADC was increased compared to normal age-matched controls and the fractional anisotropy decreased within the white matter tracts for all tumors before therapy. After radiation therapy, the ADC dropped and progressively increased with recurrence. This finding has been reported in a recent study in a similar group of patients [18]. Unique in this case series is the use of diffusion tractography on serial imaging studies during treatment which has, to our knowledge, not been reported in this patient population.
It is also noteworthy that although the three patients were on two different treatment protocols, the basis for both protocols used was a combination of radiotherapy and a chemotherapeutic agent affecting the Ras signal transduction cascade [19]. Therefore, the change in the ADC and FA values in the three cases is less likely to have been affected by differences in treatment methods.
Based on the results of this study, we are currently working on a larger prospective study of patients with brainstem gliomas to explore DTI at diagnosis and early after irradiation as a response measure in these tumors. It may be important to determine in future studies whether there is a correlation between decreased FA values and severity of neurologic deficits, and if there is a threshold below which decreased FA values become clinically apparent.
Conclusion
DTI may have a role in assessing response of diffuse brainstem gliomas to therapy. Serial imaging with DTI may be a more sensitive indicator of tumor response and may correlate better with response compared to conventional imaging. Larger prospective studies are required to investigate this further.
Acknowledgments
National Institute of Health (NIH) [U01 CA81457]; The Pediatric Brain Tumor Consortium Foundation; The Pediatric Brain Tumor Foundation of the United States; and American Lebanese Syrian Associated Charities.
Footnotes
Conflict of Interest:
The authors declare that they have no conflict of interest.
References
- 1.Donaldson SS, Laningham F, Fisher PG. Advances toward an understanding of brainstem gliomas. J Clin Oncol. 2006;24(8):1266–72. doi: 10.1200/JCO.2005.04.6599. [DOI] [PubMed] [Google Scholar]
- 2.Chan JL, et al. Survival and failure patterns of high-grade gliomas after three-dimensional conformal radiotherapy. J Clin Oncol. 2002;20(6):1635–42. doi: 10.1200/JCO.2002.20.6.1635. [DOI] [PubMed] [Google Scholar]
- 3.Broniscer A, Gajjar A. Supratentorial high-grade astrocytoma and diffuse brainstem glioma: two challenges for the pediatric oncologist. Oncologist. 2004;9(2):197–206. doi: 10.1634/theoncologist.9-2-197. [DOI] [PubMed] [Google Scholar]
- 4.Albright AL, et al. Magnetic resonance scans should replace biopsies for the diagnosis of diffuse brain stem gliomas: a report from the Children’s Cancer Group. Neurosurgery. 1993;33(6):1026–9. doi: 10.1227/00006123-199312000-00010. discussion 1029–30. [DOI] [PubMed] [Google Scholar]
- 5.Stieltjes B, et al. Diffusion tensor imaging and axonal tracking in the human brainstem. Neuroimage. 2001;14(3):723–35. doi: 10.1006/nimg.2001.0861. [DOI] [PubMed] [Google Scholar]
- 6.Field AS. Diffusion tensor imaging at the crossroads: fiber tracking meets tissue characterization in brain tumors. AJNR Am J Neuroradiol. 2005;26(9):2168–9. [PMC free article] [PubMed] [Google Scholar]
- 7.Holodny AI, et al. Tumor involvement of the corticospinal tract: diffusion magnetic resonance tractography with intraoperative correlation. J Neurosurg. 2001;95(6):1082. doi: 10.3171/jns.2001.95.6.1082. [DOI] [PubMed] [Google Scholar]
- 8.Lu S, et al. Peritumoral diffusion tensor imaging of high-grade gliomas and metastatic brain tumors. AJNR Am J Neuroradiol. 2003;24(5):937–41. [PMC free article] [PubMed] [Google Scholar]
- 9.Helton KJ, et al. Diffusion tensor imaging of tract involvement in children with pontine tumors. AJNR Am J Neuroradiol. 2006;27(4):786–93. [PMC free article] [PubMed] [Google Scholar]
- 10.Helton KJ, et al. Diffusion tensor imaging of brainstem tumors: axonal degeneration of motor and sensory tracts. J Neurosurg Pediatr. 2008;1(4):270–6. doi: 10.3171/PED/2008/1/4/270. [DOI] [PubMed] [Google Scholar]
- 11.Sorensen AG, et al. Comparison of diameter and perimeter methods for tumor volume calculation. J Clin Oncol. 2001;19(2):551–7. doi: 10.1200/JCO.2001.19.2.551. [DOI] [PubMed] [Google Scholar]
- 12.Evans AC. The NIH MRI study of normal brain development. Neuroimage. 2006;30(1):184–202. doi: 10.1016/j.neuroimage.2005.09.068. [DOI] [PubMed] [Google Scholar]
- 13.Jellison BJ, et al. Diffusion tensor imaging of cerebral white matter: a pictorial review of physics, fiber tract anatomy, and tumor imaging patterns. AJNR Am J Neuroradiol. 2004;25(3):356–69. [PMC free article] [PubMed] [Google Scholar]
- 14.Giussani C, et al. DTI fiber tracking to differentiate demyelinating diseases from diffuse brain stem glioma. Neuroimage. 52(1):217–23. doi: 10.1016/j.neuroimage.2010.03.079. [DOI] [PubMed] [Google Scholar]
- 15.Phillips NS, et al. Diffusion tensor imaging of intraaxial tumors at the cervicomedullary and pontomedullary junctions. Report of two cases. J Neurosurg. 2005;103(6 Suppl):557–62. doi: 10.3171/ped.2005.103.6.0557. [DOI] [PubMed] [Google Scholar]
- 16.Tropine A, et al. Contribution of diffusion tensor imaging to delineation of gliomas and glioblastomas. J Magn Reson Imaging. 2004;20(6):905–12. doi: 10.1002/jmri.20217. [DOI] [PubMed] [Google Scholar]
- 17.Witwer BP, et al. Diffusion-tensor imaging of white matter tracts in patients with cerebral neoplasm. J Neurosurg. 2002;97(3):568–75. doi: 10.3171/jns.2002.97.3.0568. [DOI] [PubMed] [Google Scholar]
- 18.Chen HJ, et al. Apparent Diffusion and Fractional Anisotropy of Diffuse Intrinsic Brain Stem Gliomas. AJNR Am J Neuroradiol. doi: 10.3174/ajnr.A2179. [DOI] [PMC free article] [PubMed] [Google Scholar]
- 19.Haas-Kogan DA, et al. Phase I trial of tipifarnib in children with newly diagnosed intrinsic diffuse brainstem glioma. Neuro Oncol. 2008;10(3):341–7. doi: 10.1215/15228517-2008-004. [DOI] [PMC free article] [PubMed] [Google Scholar]


