Abstract
TCR-induced NF-AT activation leads to the up-regulation of multiple genes involved in T cell anergy. Since NF-AT is also involved in T cell activation, we have endeavored to dissect TCR-induced activating and inhibitory genetic programs. This approach revealed roles for the early growth response (Egr) family of transcription factors and the Egr coactivator/corepressor NGFI-A-binding protein (NAB)2 in regulating T cell function. TCR-induced Egr-1 and NAB2 enhance T cell function, while Egr-2 and Egr-3 inhibit T cell function. In this report, we demonstrate that Egr-2 and Egr-3 are induced by NF-AT in the absence of AP-1, while Egr-1 and NAB2 both require AP-1-mediated transcription. Our data suggest that Egr-3 is upstream of Egr-2, and that mechanistically Egr-2 and Egr-3 suppress Egr-1 and NAB2 expression. Functionally, T cells from Egr-2 and Egr-3 null mice are hyperresponsive while T cells from Egr-3 transgenic, overexpressing mice are hyporesponsive. Furthermore, an in vivo model of autoimmune pneumonitis reveals that T cells from Egr-3 null mice hasten death while Egr-3-overexpressing T cells cause less disease. Overall, our data suggest that just as the Egr/NAB network of genes control cell fate in other systems, TCR-induced Egr-1, 2, 3 and NAB2 control the fate of antigen recognition in T cells.
Keywords: Activation, EGR, NAB2, T cells, Tolerance
Introduction
The early growth response (Egr) family of transcription factors was initially discovered as genes up-regulated in response to growth factors [1]. There are four known family members, each of which contains a highly conserved zinc finger DNA binding domain. Egr-mediated transcription has been shown to have important roles in multiple pathways including central nervous system function and development, prostate cancer development, thymic T cell development, and hematopoietic cell fate determination [2–7].
During TCR engagement, Egr-1, Egr-2 and Egr-3 are induced (while Egr-4 remains constitutively expressed in T cells) [8, 9]. However, recent studies have revealed opposing functions among the Egr in regulating T cell activation. Egr-1, through the up-regulation of IL-2, TNF, CD154 and IL-2r, is associated with enhancing T cell function [10–13]. Alternatively, Egr-2 and Egr-3 are emerging as negative regulators of T cell activation. Egr-3 was originally described as the TCR-induced cyclosporin (CSA)-sensitive factor responsible for Fas ligand (FasL) up-regulation [9]. Subsequently, it was determined that Egr-2 could also participate in FasL transcription [9, 14]. More recently, our group has identified Egr-2 and Egr-3 as negative regulators of Tcell function [15–17]. Egr-2 and Egr-3 expression is up-regulated in models of anergy in vitro and in vivo. Functionally, this overexpression of Egr-2 and Egr-3 inhibits Tcell activation. Conversely, Tcells from Egr3−/− mice are resistant to anergy induction in an in vivo peptide-induced model of tolerance.
The ability of Egr family members to regulate transcription is mediated in part by NAB1 (NGFI-A-binding protein) and NAB2 [18, 19]. Neither NAB1 nor NAB2 possess DNA-binding domains. Originally, they were identified as corepressors of EGR-mediated transcription by direct binding to Egr-1, Egr-2 and Egr-3 [18, 19]. Subsequently, it has been shown that NAB2 can also co-activate Egr-mediated transcription [20]. Indeed, our group has recently identified NAB2 as a novel co-activator of T cell function by enhancing Egr-1-mediated IL-2 production. NAB2 is induced by TCR engagement and its expression at the protein level is enhanced by the presence of costimulation [21].
TCR-dependent up-regulation of Egr-1, Egr-2, Egr-3 and NAB2 suggests that the Egr family plays a critical role in directing the consequences of antigen recognition. Egr-1 and NAB2 promote a TCR-induced activation program while Egr-2 and Egr-3 are responsible for modulating a TCR-induced negative genetic program. In this report, we determine the temporal and functional relationship between TCR-induced Egr-1, 2, 3 and NAB2. In doing so, we define a novel network of TCR-induced activation by Egr-1 and NAB2 and inhibition by Egr-2 and Egr-3.
Results
Differential regulation of TCR-induced Egr-1, 2, 3 and NAB2
The Egr genes and their coactivators/corepressors NAB1 and NAB2 are emerging as determents of genetic programs critical for cell fate and differentiation [7]. Egr-1, Egr-2, Egr-3, and NAB2 are all induced upon TCR engagement, however, they play different roles in regulating T cell function. Previously, our group and others have identified Egr-2 and Egr-3 as negative regulators of T cell function up-regulated during anergy induction [15, 16]. In contrast, we have demonstrated that NAB2, in collaboration with Egr-1, promotes IL-2 production [21]. Given the opposing roles that Egr-2, Egr-3 and Egr-1, NAB2 play in modulating T cell activation, we hypothesized that Egr and NAB2 play a role in determining the fate of antigen recognition. To investigate this, we first sought to establish the simultaneous expression patterns of each of these factors during TCR stimulation alone or in the presence of CD28 costimulation.
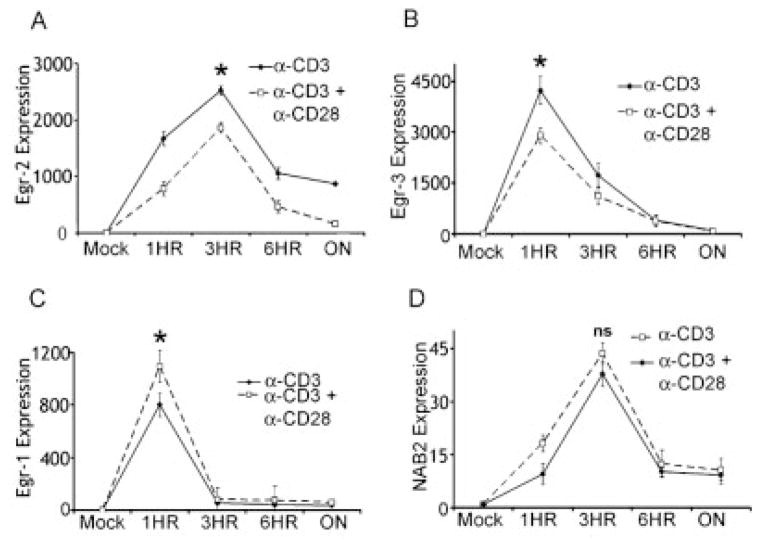
Purified naive CD4+ TCR-transgenic T cells from 5CC7 mice on a Rag−/− background were stimulated with anti-CD3 alone or anti-CD3 and anti-CD28. RNA expression was determined by real-time PCR for Egr-1, 2, 3 and NAB2. Consistent with our previous findings, Egr-2 expression peaks at 3 h and in the absence of costimulation Egr-2 transcripts persist (Fig. 1A) [15]. The kinetics of Egr-3 expression was faster peaking at 1 h. The addition of costimulation consistently led to a decrease in Egr-3 expression but did not affect the kinetics of expression (Fig. 1B). The kinetics of Egr-1 transcription was maximally up-regulated at 1 h following anti-CD3 stimulation and fell to near unstimulated levels by 6 h (Fig. 1C). Interestingly, Egr-1 RNA levels were not affected by the presence of CD28 costimulation. Consistent with other cell types, NAB2 expression was delayed when compared with Egr-1, and like Egr-1 at the RNA level its expression was not affected by the presence of costimulation (Fig. 1D) [22]. This is consistent with our previous findings that costimulation leads to post-transcriptional increases in NAB2 protein expression [21]. Overall, these kinetic data indicate a temporal relationship whereby following TCR stimulation Egr-1 and Egr-3 are most immediately expressed followed by Egr-2 and NAB2. Having established the expression patterns of the Egr-1, 2, 3 and NAB2, we next wanted to define the signaling pathways regulating their induction.
Figure 1.
Egr-1, 2, 3 and NAB2 are up-regulated by TCR stimulation. Real-time PCR was performed on 5CC7 T cells following stimulation with either anti-CD3 alone or anti-CD3 plus anti-CD28. Expression data for Egr-2 (A), Egr-3 (B), Egr-1 (C) and NAB2 (D) are shown. The y-axes represent the fold increase in transcript expression over mock-treated cells. (*) Indicates statistical significance between groups at indicated time points. For Egr-2 (A) at 3 hours p = 0.035, Egr-3 (B) at 1 h p = 0.016, Egr-1 (C) at 1 h p = 0.041, NAB2 (D) at 3 h p =0.114. All experiments were performed at least three times.
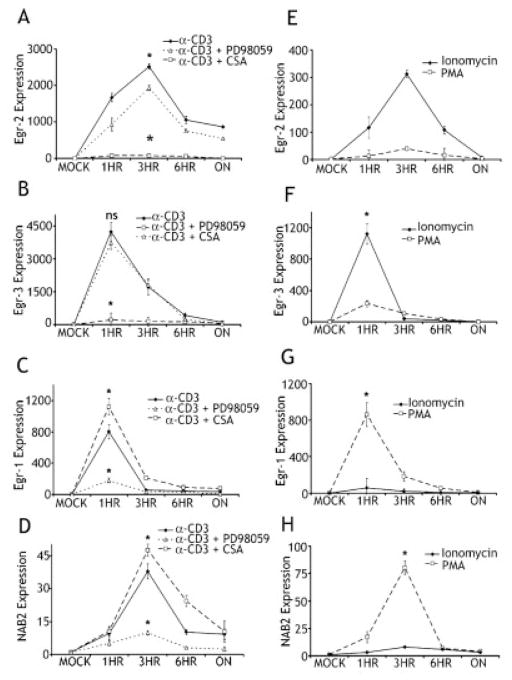
The Rao group [23] has proposed that sustained Ca2+ signaling in isolation leads to the preferential induction of an inhibitory genetic program while T cell activation with costimulation leads to maximal AP-1 activation and the subsequent induction of activators of T cell function. Thus, we wanted to determine how inhibitors of T cell function (Egr-2 and Egr-3) and activators of T cell function (Egr-1 and NAB2) fit this paradigm. To this end, we stimulated purified naive CD4+ TCR transgenic Tcells from 5CC7 mice on a Rag−/− background in the presence of well- characterized inhibitors of AP-1 activation (the MEK inhibitor PD98059) or the Ca2+ pathway (CSA). As we have previously shown Egr-2 and Egr-3 expression was markedly inhibited by CSA (Fig. 2A and B) [15]. Inhibition of AP-1 by PD98059 had little affect on TCR-induced Egr-2 and Egr-3 consistent with the hypothesis that both of these negative regulatory genes are induced by NF-AT in the absence of AP-1. In direct contrast we observed the opposite effect on Egr-1 and NAB2. CSA did not inhibit Egr-1 or NAB2 expression (Fig. 2C and D). Inhibition of signaling leading to AP-1 with PD98059 inhibited both Egr-1 and NAB2 expression. These findings are consistent with previous findings that Egr-1 induction is dependent on ERK activation [24].
Figure 2.
(A–D) Egr-2 and Egr-3 expression is abrogated by CSA treatment. Real-time PCR was performed on 5CC7 T cells following stimulation with anti-CD3 in the presence of either CSA or the MAP kinase inhibitor PD98059. Expression data for Egr-2 (A), Egr-3 (B), Egr-1 (C) and NAB2 (D) are shown. The y-axes represent the fold increase in transcript expression over mock-treated cells. (*) Indicates statistical significance between inhibitor and control groups at indicated time points. For Egr-2 (A) CSA at 3 h p = 0.0064, PD98059 at 3 h p = 0.014, Egr-3 (B) at 1 h CSA p = 0.00018, PD98059 at 1 h p = 0.081, Egr-1 (C) CSA at 1 h p = 0.0084, PD98059 at 1 h p = 0.00073, NAB2 (D) CSA at 3 h p = 0.014, PD98059 at 3 h p = 0.009. (E–H) Egr-2 and Egr-3 are up-regulated through a calcium-dependant pathway. Real-time PCR was performed on 5CC7 T cells following stimulation with either PMA or ionomycin. Expression data for Egr-2 (E), Egr-3 (F), Egr-1 (G) and NAB2 (H) are shown. The y-axes represent the fold increase in transcript expression over mock-treated cells. (*) Indicates statistical significance between groups at indicated time points. For Egr-2 (E) at 3 h p = 0.006, Egr-3 (F) at 1 h p = 0.000127, Egr-1 (G) at 1 h p = 0.00038, NAB2 (H) at 3 hr p = 0.006. All experiments were performed at least three times.
Stimulating T cells with ionomycin leads to the Ca2+-induced activation of NF-AT and the preferential up-regulation of a TCR-induced negative regulatory gene expression profile (T cell anergy) [23]. Thus, we stimulated purified naive CD4+ TCR-transgenic T cells from 5CC7 mice on a Rag−/− background with either ionomycin alone to activate NF-AT or with PMA to activate the Ras-MAP-kinase pathway. Consistent with the Rao paradigm, Egr-2 and Egr-3 were both strongly induced by ionomycin alone and only minimally up-regulated by PMA (Fig. 2E and F). Alternatively, the mediators of T cell activation, Egr-1 and NAB2, were strongly up-regulated by PMA stimulation but displayed only minimal expression when stimulated with ionomycin (Fig. 2G and H). These findings are consistent with previous reports showing that Egr-2 and Egr-3 inductions in T cells are not only NF-AT dependent [14] but that NF-AT alone is sufficient for their transcription. Furthermore, our data suggest that the NF-AT-induced negative genetic program is mediated in part by Egr-2 and Egr-3 (NF-AT > Egr-2 and Egr-3 > inhibition of T cell function).
Enhanced function in Egr2−/− and Egr3−/− T cells
Having identified Egr-2 and Egr-3 as being up-regulated in anergy, we hypothesized that these two transcription factors were part of a TCR-induced negative feedback loop. To functionally test this hypothesis we examined IL-2 production and proliferation in T cells from Egr-2 and Egr-3 null mice. Egr-3 null mice have been previously described [25] and display no gross abnormalities in T cell thymic development. After crossing the Egr-3 null mice onto the 6.5+ TCR-transgenic background we found no significant differences in either CD4+, CD8+, 6.5+ or CD44high percentages in peripheral blood (data not shown). Egr-2 null mice are embryonic lethal and T cell development and function have never been investigated for such mice. Therefore, we transferred fetal livers from 6.5+ BALB/c Egr-2 null embryos into irradiated BALB/c hosts and harvested the T cells after immune reconstitution. Analysis of peripheral blood CD4+, CD8+, 6.5+ and CD44high percentages indicated no significant differences between WT Egr-2 and Egr-2 null mice (data not shown). We also took advantage of an Egr-3-overexpressing transgenic (Egr-3 TG) mouse. This mouse has previously been described as having lower percentages of thymic CD4+ T cells and increased percentages of thymic CD8+ and CD4−CD8− T cells [26]. Peripheral blood analysis of Egr-3 TG mice indicated lower CD4+ T cell percentages than in WT controls; however, 6.5+ CD4+ T cell percentages were not significantly different (data not shown). To compensate for potential differences in CD4+ Tcell percentages, CD4+ Tcells were enriched and used in equivalent numbers for all subsequent experiments.
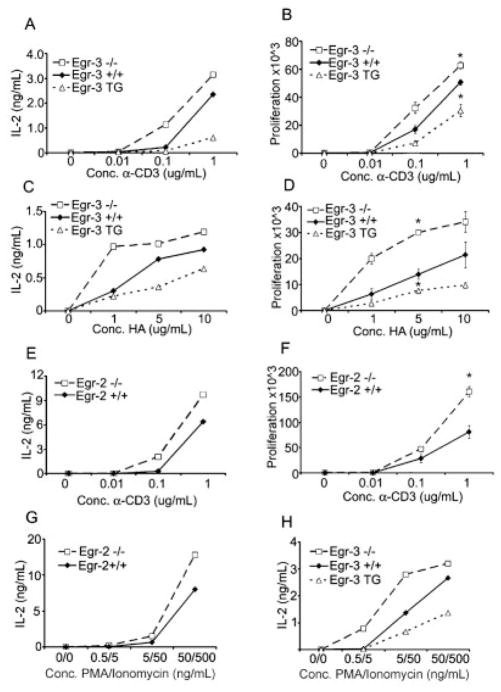
Egr-2 null, Egr-3 null and Egr-3-transgenic T cells were stimulated with increasing doses of anti-CD3 and IL-2 production and proliferation were assayed. Egr-3 null T cells repeatedly displayed enhanced IL-2 production and proliferation in comparison to WT controls. In contrast, T cells from Egr-3 TG mice were consistently hyporesponsive when compared to WT controls (Fig. 3A and B). Similar effects were also seen when the T cells were stimulated with HA peptide and irradiated APC (Fig. 3C and D). Similarly, T cells from the Egr-2 null mice demonstrated increased proliferation and IL-2 production in response to increasing doses of anti-CD3 (Fig. 3E and F). We also wanted to determine if the increased T cell function in the Egr-2 null and Egr-3 null mice and the decreased T cell function in Egr-3 TG mice were due to changes in receptor-mediated signaling thresholds. To this end, WT, null and transgenic T cells were stimulated with increasing doses of PMA and ionomycin to bypass proximal signaling events. As with CD3 stimulation, Egr-2 and Egr-3 null T cells produced more IL-2 in response to PMA and ionomycin, whereas Egr-3 TG mice produced less (Fig. 3G and H). Overall, these data employing T cells from Egr-2 and Egr-3 null mice and Egr-3 TG mice demonstrate the role of Egr-2 and Egr-3 as negative regulators of T cell function.
Figure 3.
Egr-2 and Egr-3 null T cells have enhanced T cell function. Egr-3 null, Egr-3 transgenic and WT control T cells were stimulated with increasing doses of anti-CD3 and anti-CD28. IL-2 (A) and proliferation (B) were analyzed, for proliferation (*) indicates statistical significance between Egr-3+/+ and Egr-3−/− or Egr-3+/+ and Egr-3 TG at indicated concentration of αCD3. For Egr-3+/+ vs. Egr-3−/− p = 0.0381, for Egr-3+/+ vs. Egr-3 TG p = 0.026. Egr-3 null, Egr-3 transgenic and WT control T cells were stimulated with increasing doses of HA peptide in the presence of irradiated splenocytes. IL-2 (C) and proliferation (D) were analyzed. For proliferation (*) indicates statistical significance between Egr-3+/+ and Egr-3−/− or Egr-3+/+ and Egr-3 TG at indicated concentration of HA peptide. For Egr-3+/+ vs. Egr-3−/− p = 0.0036, for Egr-3+/+ vs. Egr-3 TG p = 0.011. Egr-2 null and WT control T cells were stimulated with increasing doses of anti-CD3 and anti-CD28. IL-2 (E) and proliferation (F) were analyzed. For proliferation (*) indicates statistical significance between Egr-2+/+ and Egr-2−/− at indicated concentration of αCD3, p = 0.0226. Egr-2 null and WT control T cells (G) and Egr-3 null, Egr-3 transgenic, and WT control T cells (H) were stimulated with increasing doses of PMA and Ionomycin and IL-2 production was analyzed. All experiments were performed at least three times.
Egr2 and Egr3 inhibit T cell function in part by inhibiting Egr-1 and NAB2 expression
In other cell types, it has been shown that the Egr and NAB genes determine cell fate and differentiation in part by regulating themselves. For example, Egr-1 promotes the induction of NAB2, which in turn represses Egr-1 function, including the up-regulation of NAB2 [22]. Given the fact that Egr-1 and NAB2 promote T cell function and Egr-2 and Egr-3 inhibit T cell function we hypothesized that such negative feedback loops might also be present in T cells. In as much as Egr-1 and NAB2 promote T cell activation, we wanted to determine the effect of Egr-2 and Egr-3 on Egr-1 and NAB2 expression. Tcells from WT, Egr-2 null, Egr-3 null and Egr-3 TG mice were stimulated with anti-CD3 and expression of the Egr and NAB2 was assessed.
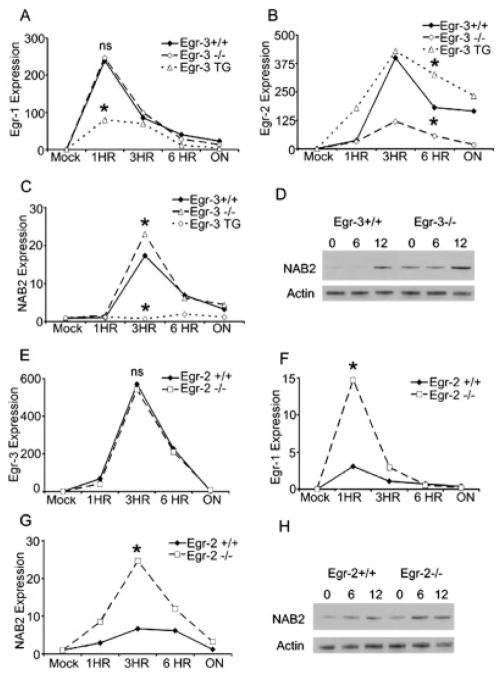
Egr-3 overexpression led to the marked inhibition of both Egr-1 and NAB2 (Fig. 4A and C). These data suggest that one mechanism by which Egr-3 mediates its inhibition is by promoting the down-regulation of these two activators of T cell function. Consistent with this finding (though less dramatic), NAB2 RNA was slightly increased in the Egr-3 null T cells. Previously, we have shown that NAB2 is regulated in part at the translational level [21]. Thus, we also measured NAB2 protein expression in the Egr-3 null T cells. The increased NAB2 RNA expression peaking at 3 h in the Egr-3 null T cells translated into an increase in NAB2 protein (Fig. 4D). In contrast, Egr-2 expression was slightly increased in the Egr-3 TG T cells, suggesting that Egr-3 may enhance Egr-2 expression. Supporting this hypothesis is the observation that Egr-2 levels are decreased in the Egr-3 null Tcells (Fig. 4B). While Egr-2 levels were decreased in the T cells from the Egr-3 null mice, Egr-3 levels appeared unaffected by the absence of Egr-2 (Fig. 4E). Of note, the time for peak expression of Egr-3 was delayed in the WT Egr-2 control mice compared with that seen in the naive CD4+ TCR-transgenic T cells from 5CC7 mice on a Rag−/− background (Fig. 4E vs. Fig. 1B). This may be because being on a Rag−/− background, 100% of the T cells from the 5CC7 mice are naive. The up-regulation of both T cell activators, Egr-1 and NAB2, was more robust in the Egr-2 null T cells (Fig. 4F and G). NAB2 protein expression was also analyzed in Egr-2 WT and null T cells. Consistent with the RNA expression data, NAB2 protein was also enhanced in Egr-2 null T cells (Fig. 4H). Taken together, our data are consistent with a model whereby Egr-2 and Egr-3 mediate inhibition of T cell function in part by inhibiting the expression of Egr-1 and NAB2.
Figure 4.
Egr-2 and Egr-3 null T cells have altered Egr-1 and NAB2 expression. (A–C) Real time PCR was performed on Egr-3 null, Egr-3 transgenic and WT control T cells following stimulation with anti-CD3. Expression data for Egr-1 (A), Egr-2 (B) and NAB2 (C) are shown. The y-axes represent the fold increase in transcript expression over mock-treated cells. (*) Indicates statistical significance between WT and KO or WT and TG groups. For Egr-1 (A) at 1 h Egr-3 KO vs. WT p = 0.39, WT vs. Egr-3 TG p = 0.0036. For Egr-2 (B) at 6 h Egr-2 KO vs. WT p = 0.0028, Egr-3 TG vs. WT p = 0.0052. For NAB2 (C) at 3 h Egr-3 KO vs. WT p = 0.042, Egr-3 WT vs. Egr-3 TG p = 0.0029. (D) Western blot analysis of NAB2 expression in Egr-3 WT and Egr-3 null T cells stimulated with anti-CD3, actin blotting is included as loading control. (E–G) Real-time PCR was conducted on Egr-2 null or WT control T cells stimulated with anti-CD3. Expression data for Egr-3 (E), Egr-1 (F) and NAB2 (G). The y-axes represent the fold increase in transcript expression over mock-treated cells. (*) Indicates statistical significance between WT and KO groups. For Egr-3 (E) at 3 h p = 0.402. For Egr-1 (F) at 1 h p = 0.0029. For NAB2 (G) at 3 h p = 0.02. (H) Western blot analysis of NAB2 expression in Egr-2 WT and Egr-2 null T cells stimulated with anti-CD3, actin blotting is included as loading control. (*) Indicates statistical significance between WT and KO or WT and TG groups. All experiments were performed at least three times except Western blots which were performed twice.
Increased autoimmunity induced by Egr-3−/− autoreactive T cells
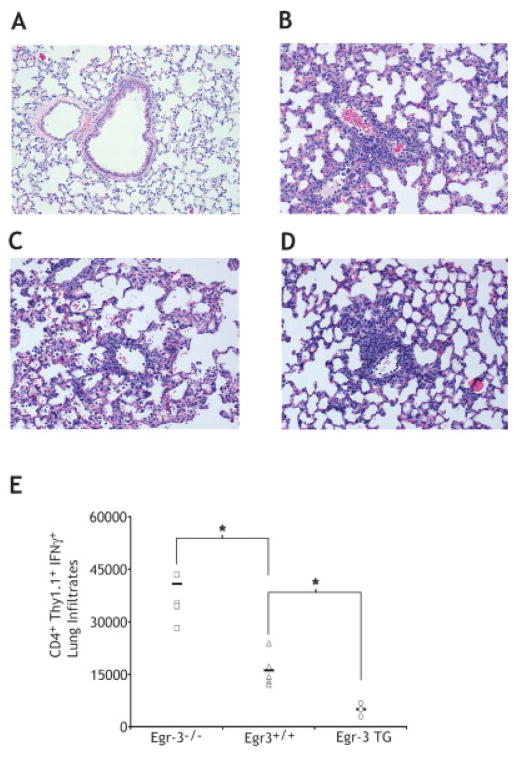
Our in vitro studies have thus far demonstrated that Egr-2 and Egr-3 are part of the NF-AT-induced negative regulatory network in T cells. Further, we have shown that Egr-2 and Egr-3-induced inhibition of IL-2 production and proliferation correlates with decreased expression of Egr-1 and NAB2. We wanted to demonstrate the in vivo significance of these findings on T cell function. To this end, HA-specific 6.5+ TCR-transgenic Tcells from either Egr-3 null mice, Egr-3 WT, or Egr-3 TG mice were adoptively transferred into C3HA mice expressing HA as a self-antigen primarily in the lungs. In this model, the adoptive transfer of sufficient numbers of T cells leads to death due to autoimmune pneumonitis [25]. When T cells from age- and sex-matched WT mice were adoptively transferred into the C3HA mice 70% of the mice died. When equal numbers of clonotypic T cells from Egr-3 null mice were adoptively transferred, 100% of the mice died (Fig. 5A). The finding that T cells from Egr-3 null mice induced more autoimmune mortality than WT mice was consistently seen in multiple experiments. In contrast, the adoptive transfer of T cells from Egr-3 TG mice led to lower death rate due to autoimmune pneumonitis in multiple experiments (Fig. 5B). In this model, the infiltration of CD4+ clonotypic T cells in the lungs is prominent at necropsy [27]. We performed histology on lung tissue on day 4 post T cell transfer (Fig. 6A–D). Interestingly, in spite of the differences in survival, lymphocytic infiltrates were observed after the adoptive transfer of the WT, Egr-3 null and Egr-3 TG T cells. These findings were consistent with the notion that Egr-3 is influencing the development of disease by regulating the effector function of the autoreactive T cells and not altering T cell trafficking. Indeed, intracellular staining was performed on clonotypic lung infiltrating T cells for IFN-γ production. The number of IFN-γ-producing 6.5+ T cells in the lung was highest in the mice that received T cells from Egr-3 null mice (Fig. 6E). Conversely, IFN-γ production was least in the clonotypic cells that overexpressed Egr-3.
Figure 5.
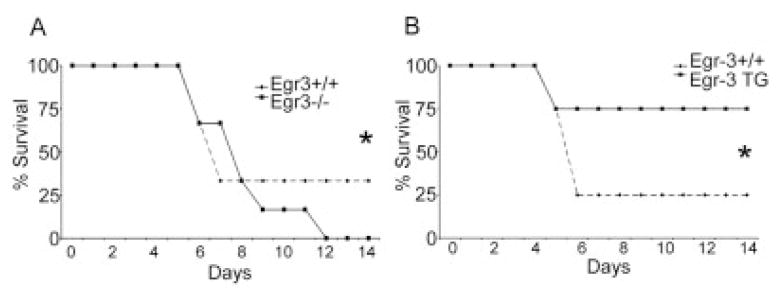
Egr-3 levels regulate the ultimate fate of T cell mediated autoimmune pneumonitis. All C3HA mice were injected with bulk preparations of lymphocytes/splenocytes containing WT 2.5 × 10⁶ CD4+ 6.5+ T cells. Injections were “spiked” with 2 × 10⁶ CD4 purified 6.5+ T cells from Egr-3 WTor Egr-3 KO littermate mice (A) or 2 × 10⁶ CD4 purified 6.5+ T cells from Egr-3 WT or Egr-3 TG littermate mice (B). Results are representative from three (A) and two (B) independent experiments, where n = 25 (Egr-3 WT), n = 18 (Egr-3 KO) and n = 9 (Egr-3 TG). (*) Indicates statistical significance between groups for overall survival. (A) p = 0.0018, (B) p = 0.0037.
Figure 6.
Egr-3 levels modulate T cell function but not T cell trafficking during autoimmune pneumonitis. (A–D) Histological analysis of lung biopsies of untreated (A), wild-type Egr-3 T cell transfer (B), Egr-3 null T cell transfer (C), and Egr-3 transgenic T cell transfer (D) on day 4 following T cell transfer. (E) Total CD4+ Thy1.1+ IFN-γ+ lung infiltrates from mice with autoimmune pneumonitis. Data are representative of five mice for Egr-3−/− and Egr-3+/+ and three mice for Egr-3 TG. (*) Indicate statistical significance between Egr-3+/+ and Egr-3−/− (p = 0.022) and between Egr-3+/+ and Egr-3 TG (p = 0.013).
Discussion
The specific recognition of antigen by the TCR enables the immune system to mount effective responses against a diverse array of pathogens. However, inherent in the T cell activation program are negative regulatory mechanisms designed to prevent over-exuberant immune responses from destroying healthy tissue. In addition, when TCR engagement occurs in the absence of costimulation, this leads to the up-regulation of a negative genetic program that induces Tcell tolerance in the form of anergy [28]. Our group and others have identified Egr-2 and Egr-3 as playing an important role in the induction of T cell anergy [15, 16]. In this regard, just as the Egr have been shown to play essential roles in determining cell fate and differentiation in other settings, we propose that this family of transcription factors also regulates the fate of antigen recognition.
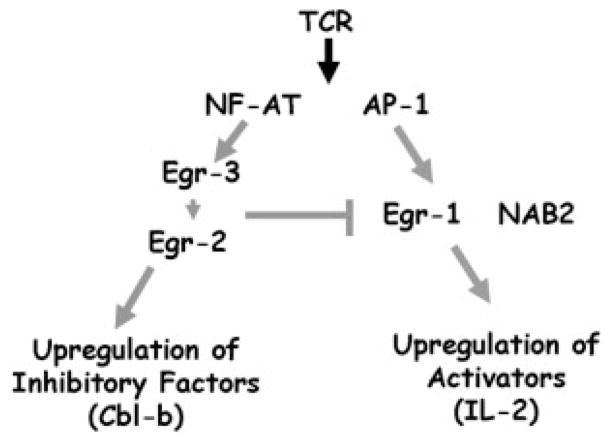
TCR-induced Ca2++ influx leads to the translocation of NF-AT to the nucleus. Initially NF-AT was shown to play an important role in facilitating T cell activation by promoting the transcription of multiple cytokines and chemokines [29]. However, NF-AT also plays an integral role in promoting the up-regulation of a program of genes that inhibit Tcell function and induce Tcell anergy [23]. Indeed, not only is T cell activation inhibited by CSA but also T cell anergy. Rao and colleagues [23] have proposed that under activating conditions NF-AT cooperates with AP-1 in order to promote the expression of genes that enhance T cell function. Alternatively, under suboptimal activating conditions, genes that are induced by NF-AT in the absence of AP-1 dominate. These genes primarily have inhibitory functions and are theorized to constitute the genes that promote T cell anergy. The genes that make up this negative genetic program are induced when T cells are stimulated with ionomycin alone. The expression of Egr-2 and Egr-3 meets these criteria, leading us to propose that Egr-2 and Egr-3 play an important role in executing the NF-AT-induced negative regulatory program (Fig. 7). Indeed, it has been previously shown that Egr-2 and Egr-3 induction is blocked by CSA and is NF-AT dependent [9, 14]. Our data that both Egr-2 and Egr-3 are up-regulated by ionomycin alone and that their induction is not dependent upon MAP-kinase activation support this hypothesis. Of interest, it has been proposed that the up-regulation of the E3 ligases represents an important component of NF-AT-induced inhibition [30]. Previously, we have shown that the E3 ligase Cbl-b is decreased in T cells from Egr-3 null mice and increased with the overexpression of Egr-3. Such findings support the notion that NF-AT-induced Cbl-b is downstream of Egr-3 [15].
Figure 7.
Model for the regulation of T cell function by Egr-1, 2, 3 and NAB2. We propose that Egr-3 and Egr-2 are important mediators of the negative regulatory program downstream of isolated NF-AT signaling. Our data suggest that Egr-2 is up-regulated by Egr-3. Egr-2 and Egr-3 inhibit T cell function by both promoting the up-regulation of negative regulators such as Cbl-b and by inhibiting the expression of the T cell activators Egr-1 and NAB2.
Recently, a role for Egr-1, Egr-2, and NAB2 has been defined in determining cell fate in myelopoiesis [7]. The induction of these factors promotes macrophage differentiation by enhancing the expression of macrophage specific genes and simultaneously repressing neutrophil-specific genes. We have defined a parallel role for Egr-1 and NAB2 in promoting T cell activation in part by enhancing IL-2 transcription. Importantly, our data suggest that one mechanism by which Egr-2 and Egr-3 inhibit T cell function is by blocking the up-regulation of NAB2 and Egr-1. Clearly, NAB2 and Egr-1 expressions are markedly decreased in Egr-3 TG mice (Fig. 4A and C). In addition, NAB2 expression is increased in Egr-2 and Egr-3 null T cells, while Egr-1 expression is enhanced in Egr-2 null T cells. Thus, either directly or indirectly, Egr-2 and Egr-3 expression appears to inhibit Egr-1 and NAB2 expression. Interestingly, we find that Egr-2 levels are reduced in Egr-3 null Tcells and enhanced in Egr-3 TG T cells. On the other hand, Egr-3 levels are unaffected by the presence or absence of Egr-2. These findings are consistent with Egr-3 being upstream of Egr-2. We propose that the coordinate expression of Egr-2 and Egr-3 provides a negative feedback loop for Tcell activation. Under fully activating conditions, in the context of costimulation, the magnitude of Egr-3 expression is decreased and the kinetics of Egr-2 expression is markedly shortened. However, their initial presence may be the equivalent of “tapping on the brakes” to prevent from going too fast. Alternatively, in the absence of costimulation the expression of Egr-2 is protracted, resulting in a dominant, negative regulatory program leading to tolerance in the form of anergy.
The ability of Egr-2 and Egr-3 to attenuate T cell activation was supported by our functional data. T cells from both Egr-2 and Egr-3 null mice were relatively hyperactive in vitro, while T cells from Egr-3 TG mice were markedly hyporesponsive. In vivo, the dose of Egr-3 present in T cells proved to correlate with immune mediated pathology. Egr-3 null T cells showed a greater capacity to induce autoimmunity compared to WT controls, while the overexpression of Egr-3 protected mice from T cell-induced pneumonitis. This protection was not associated with decreased T cell infiltrate but rather a decrease in IFN-γ production by the auto-reactive T cells. In this regard, our findings have potential clinical implications. Our data suggest that an inhibitor of T cell activation that does not block the up-regulation of Egr-2 and Egr-3 would be able to promote T cell tolerance. The well characterized T cell inhibitor CSA, as an inhibitor of NF-AT activation, blocks not only T cell activation but also T cell tolerance. In contrast, an inhibitor of NF-AT/AP-1 association could potentially promote a tolerogenic program, in part, by leaving TCR-induced expression of Egr-2 and Egr-3 intact.
Materials and methods
Mice
B10.A/AiTac-[Tg]TCRCyt5CC7-I-[KO]Rag2 were purchased from Taconic Farms (model 004094-MM). Egr3−/− mice were obtained from J. Milbrandt (Washington University, St Louis, MO). Egr-3 TG mice on the B6.AKR background were obtained from G. Kersh (Emory University School of Medicine, Atlanta, Georgia) [25, 26]. The Egr3−/− mice and Egr3 TG mice were backcrossed onto the B10.D2 6.5+ TCR-transgenic background for at least nine and five generations, respectively. Egr-2 +/− mice [31] were backcrossed onto the BALB/c 6.5+ TCR background for nine generations. Embryos from heterozygous timed pregnancies were harvested on day 13.5. Fetal livers from Egr-2+/+ or Egr-2−/− embryos (as confirmed by PCR) were resuspended in HBSS. Approximately 1 × 10⁶ fetal liver cells were injected into BALB/c recipients, which received a lethal dose of irradiation (850 rad) 4 h prior to injection. Engraftment was confirmed by flow cytometry for 6.5+ at 4–8 weeks from mouse tail bleeds. C3-HA-transgenic B10.D2 and 6.5+ TCR-transgenic B10.D2 mice were a gift from C. Drake (Johns Hopkins University, Baltimore, MD). All animal protocols were approved by the Institutional Animal Care and Use Committee of Johns Hopkins University.
Antibodies and reagents
Anti-CD3 (2C11; BD PharMingen) was utilized at a concentration of 1 μg/mL. Some cultures were supplemented with ascites fluid containing the 37.51 mAb to CD28 (a gift from J. Allison, Memorial Sloan-Kettering Cancer Center, New York, NY) at a final dilution of 1:1,000. PMA and ionomycin were purchased from Sigma. Flow cytometry antibodies were purchased from BD biosciences.
Real-time RT-PCR
Real-time PCR was conducted as previously described [15] using primers and probes specific for Egr-2 (forward, 5′-GTGCCAGCTGCTATCCAGAAG-3′; reverse, 5′-GGCTGTG-GTTGAAGCTGGAG-3′; and probe, 5′-TTGTGAGTGCGGG-CATCTTGCAA-3′), Egr-1 (forward, 5′-, GATGTCTCCGCTGCA-GATCTC-3′; reverse, 5′-TGTCCATGGTGGGTGAGTGA-3′; and probe, 5′-CCCGTTCGGCTCC-3′), Egr-3 (forward, 5′-CAACGA-CATGGGCTCCATTC-3′, reverse, 5′-GGCCTTGATGGTCTC-CAGTG-3′, and probe, 5′-CCTTCCAGGGCATGGACCCCA-3′). and NAB2 (forward, 5′-CAGAGATGGTGCGAATGGTG-3′; reverse, 5′-GCTTCAACAGGGATGCGATC-3′; and probe, 5′-TGGAGAGTGTTGAGAGGATCTTCCGGAGT-3′). All samples were analyzed in triplicate and presented as average values, for which SD are <0.5 cycles.
Immunoblot analysis
Immunoblots were performed as previously described [15]. Anti-actin was purchased from Sigma-Aldrich. Anti-NAB2 was a gift from Dr. J. Johnson (Institute for Immunology, Munich, Germany) and has been described previously [32].
C3-HA tolerance model
C3-HA-expressing transgenic (recipient) mice have been described [27]. The hemagglutinin gene derived from influenza virus A/PR/8/34 (Mount Sinai strain), placed under the control of the rat C3 promoter, was established on the B10.D2 background homozygous for Thy1.2. The TCR-transgenic mouse line 6.5 (donor) expresses a TCR that recognizes the I-Ed-restricted HA(110–120) epitope (SFER-FEIFPKE), as described [33] and was backcrossed onto the B10.D2 background. CD4+ T cells were prepared from pooled spleens and lymph nodes of Thy1.1+, 6.5-transgenic mice and clonotypic percentages were determined by flow cytometry. Bulk lymphocyte/splenocyte preparation containing 2.5 × 10⁶ CD4+ clonotypic 6.5+ T cells were adoptively transferred intravenously into all C3-HA mice. C3-HA mice received an additional CD4+ purified 2 × 10⁶ clonotypic 6.5+ T cells from Egr-3 WT, Egr-3 KO or Egr-3 TG mice. On day 4, mice were sacrificed and exsanguinated with PBS, lung tissue was removed and fixed in formalin overnight. Fixed samples were then sectioned and stained for H&E; samples were analyzed by microscope at 20X amplification. For intracellular staining, lung tissue was removed following exsanguinations with PBS, and infiltrating T cells were isolated using liberase digestion. Isolated T cells were stimulated for 5 h with HA peptide and then fixed and permeabilized for intracellular staining. Flow cytometry was conducted by gating on CD4+ Thy1.1+ donor cells and analyzing IFN-γ production. Data are presented as total numbers of CD4+ Thy1.1+ IFN-γ+ T cells isolated from lung tissue.
ELISA and proliferation
IFN-γ and IL-2 were measured in supernatants by ELISA according to the manufacturer’s instructions (eBioscience). Proliferation was measured by [3H]thymidine incorporation after a 16-h pulse before collection; radioactivity of samples was measured using a Betaplate reader.
Statistical analysis
All statistical analysis was conducted using the paired Student’s t-test. Statistical significant values were those where p <0.05.
Acknowledgments
The authors would like to thank Allen Fung for his assistance on this project, as well as the members of the Powell lab for their critical reviews of this manuscript. This project was supported by the National Cancer Institute (R01CA098109–02).
Abbreviations
- CSA
cyclosporin
- Egr
early growth response gene
- NAB
NGFI-A-binding protein
Footnotes
Conflict of interest: The authors declare no financial or commercial conflict of interest.
References
- 1.O’Donovan KJ, Tourtellotte WG, Millbrandt J, Baraban JM. The EGR family of transcription-regulatory factors: progress at the interface of molecular and systems neuroscience. Trends Neurosci. 1999;22:167–173. doi: 10.1016/s0166-2236(98)01343-5. [DOI] [PubMed] [Google Scholar]
- 2.Le N, Nagarajan R, Wang JY, Svaren J, LaPash C, Araki T, Schmidt RE, Milbrandt J. Nab proteins are essential for peripheral nervous system myelination. Nat Neurosci. 2005;8:932–940. doi: 10.1038/nn1490. [DOI] [PubMed] [Google Scholar]
- 3.Tourtellotte WG, Keller-Peck C, Milbrandt J, Kucera J. The transcription factor Egr3 modulates sensory axon-myotube interactions during muscle spindle morphogenesis. Dev Biol. 2001;232:388–399. doi: 10.1006/dbio.2001.0202. [DOI] [PubMed] [Google Scholar]
- 4.Yang SZ, Eltoum IA, Abdulkadir SA. Enhanced EGR1 activity promotes the growth of prostate cancer cells in an androgen-depleted environment. J Cell Biochem. 2006;97:1292–1299. doi: 10.1002/jcb.20736. [DOI] [PubMed] [Google Scholar]
- 5.Schnell FJ, Zoller AL, Patel SR, Williams IR, Kersh GJ. Early growth response gene 1 provides negative feedback to inhibit entry of progenitor cells into the thymus. J Immunol. 2006;176:4740–4747. doi: 10.4049/jimmunol.176.8.4740. [DOI] [PubMed] [Google Scholar]
- 6.Miyazaki T, Lemonnier FA. Modulation of thymic selection by expression of an immediate-early gene, early growth response 1 (Egr-1) J Exp Med. 1998;188:715–723. doi: 10.1084/jem.188.4.715. [DOI] [PMC free article] [PubMed] [Google Scholar]
- 7.Laslo P, Spooner CJ, Warmflash A, Lancki DW, Lee HJ, Sciammas R, Gantner BN, et al. Multilineage transcriptional priming and determination of alternate hematopoietic cell fates. Cell. 2006;126:755–766. doi: 10.1016/j.cell.2006.06.052. [DOI] [PubMed] [Google Scholar]
- 8.Skerka C, Decker EL, Zipfel PF. Coordinate expression and distinct DNA-binding characteristics of the four EGR-zinc finger proteins in Jurkat T lymphocytes. Immunobiology. 1997;198:179–191. doi: 10.1016/S0171-2985(97)80039-3. [DOI] [PubMed] [Google Scholar]
- 9.Mittelstadt PR, Ashwell JD. Cyclosporin A-sensitive transcription factor Egr-3 regulates Fas ligand expression. Mol Cell Biol. 1998;18:3744–3751. doi: 10.1128/mcb.18.7.3744. [DOI] [PMC free article] [PubMed] [Google Scholar]
- 10.Decker EL, Skerka C, Zipfel PF. The early growth response protein (EGR-1) regulates interleukin-2 transcription by synergistic interaction with the nuclear factor of activated T cells. J Biol Chem. 1998;273:26923–26930. doi: 10.1074/jbc.273.41.26923. [DOI] [PubMed] [Google Scholar]
- 11.Decker EL, Nehmann N, Kampen E, Eibel H, Zipfel PF, Skerka C. Early growth response proteins (EGR) and nuclear factors of activated T cells (NFAT) form heterodimers and regulate proinflammatory cytokine gene expression. Nucleic Acids Res. 2003;31:911–921. doi: 10.1093/nar/gkg186. [DOI] [PMC free article] [PubMed] [Google Scholar]
- 12.Cron RQ, Bandyopadhyay R, Genin A, Brunner M, Kersh GJ, Yin J, Finkel TH, Crow MK. Early growth response-1 is required for CD154 transcription. J Immunol. 2006;176:811–818. doi: 10.4049/jimmunol.176.2.811. [DOI] [PMC free article] [PubMed] [Google Scholar]
- 13.Lin JX, Leonard WJ. The immediate-early gene product Egr-1 regulates the human interleukin-2 receptor beta-chain promoter through noncanonical Egr and Sp1 binding sites. Mol Cell Biol. 1997;17:3714–3722. doi: 10.1128/mcb.17.7.3714. [DOI] [PMC free article] [PubMed] [Google Scholar]
- 14.Rengarajan J, Mittelstadt PR, Mages HW, Gerth AJ, Kroczek RA, Ashwell JD, Glimcher LH. Sequential involvement of NFAT and Egr transcription factors in FasL regulation. Immunity. 2000;12:293–300. doi: 10.1016/s1074-7613(00)80182-x. [DOI] [PubMed] [Google Scholar]
- 15.Safford M, Collins S, Lutz MA, Allen A, Huang CT, Kowalski J, Blackford A, et al. Egr-2 and Egr-3 are negative regulators of T cell activation. Nat Immunol. 2005;6:472–480. doi: 10.1038/ni1193. [DOI] [PubMed] [Google Scholar]
- 16.Harris JE, Bishop KD, Phillips NE, Mordes JP, Greiner DL, Rossini AA, Czech MP. Early growth response gene-2, a zinc-finger transcription factor, is required for full induction of clonal anergy in CD4+ T cells. J Immunol. 2004;173:7331–7338. doi: 10.4049/jimmunol.173.12.7331. [DOI] [PubMed] [Google Scholar]
- 17.Anderson PO, Manzo BA, Sundstedt A, Minaee S, Symonds A, Khalid S, Rodriguez-Cabezas ME, et al. Persistent antigenic stimulation alters the transcription program in T cells, resulting in antigen-specific tolerance. Eur J Immunol. 2006;36:1374–1385. doi: 10.1002/eji.200635883. [DOI] [PMC free article] [PubMed] [Google Scholar]
- 18.Russo MW, Sevetson BR, Milbrandt J. Identification of NAB1, a repressor of NGFI-A- and Krox20-mediated transcription. Proc Natl Acad Sci USA. 1995;92:6873–6877. doi: 10.1073/pnas.92.15.6873. [DOI] [PMC free article] [PubMed] [Google Scholar]
- 19.Svaren J, Sevetson BR, Apel ED, Zimonjic DB, Popescu NC, Milbrandt J. NAB2, a corepressor of NGFI-A (Egr-1) and Krox20, is induced by proliferative and differentiative stimuli. Mol Cell Biol. 1996;16:3545–3553. doi: 10.1128/mcb.16.7.3545. [DOI] [PMC free article] [PubMed] [Google Scholar]
- 20.Sevetson BR, Svaren J, Milbrandt J. A novel activation function for NAB proteins in EGR-dependent transcription of the luteinizing hormone beta gene. J Biol Chem. 2000;275:9749–9757. doi: 10.1074/jbc.275.13.9749. [DOI] [PubMed] [Google Scholar]
- 21.Collins S, Wolfraim LA, Drake CG, Horton MR, Powell JD. Cutting Edge: TCR-induced NAB2 enhances T cell function by coactivating IL-2 transcription. J Immunol. 2006;177:8301–8305. doi: 10.4049/jimmunol.177.12.8301. [DOI] [PubMed] [Google Scholar]
- 22.Kumbrink J, Gerlinger M, Johnson JP. Egr-1 induces the expression of its corepressor nab2 by activation of the nab2 promoter thereby establishing a negative feedback loop. J Biol Chem. 2005;280:42785–42793. doi: 10.1074/jbc.M511079200. [DOI] [PubMed] [Google Scholar]
- 23.Macian F, Garcia-Cozar F, Im SH, Horton HF, Byrne MC, Rao A. Transcriptional mechanisms underlying lymphocyte tolerance. Cell. 2002;109:719–731. doi: 10.1016/s0092-8674(02)00767-5. [DOI] [PubMed] [Google Scholar]
- 24.Shao H, Kono DH, Chen LY, Rubin EM, Kaye J. Induction of the early growth response (Egr) family of transcription factors during thymic selection. J Exp Med. 1997;185:731–744. doi: 10.1084/jem.185.4.731. [DOI] [PMC free article] [PubMed] [Google Scholar]
- 25.Tourtellotte WG, Milbrandt J. Sensory ataxia and muscle spindle agenesis in mice lacking the transcription factor Egr3. Nat Genet. 1998;20:87–91. doi: 10.1038/1757. [DOI] [PubMed] [Google Scholar]
- 26.Xi H, Kersh GJ. Early growth response gene 3 regulates thymocyte proliferation during the transition from CD4−CD8− to CD4+CD8+ J Immunol. 2004;172:964–971. doi: 10.4049/jimmunol.172.2.964. [DOI] [PubMed] [Google Scholar]
- 27.Huang CT, Workman CJ, Flies D, Pan X, Marson AL, Zhou G, Hipkiss EL, et al. Role of LAG-3 in regulatory T cells. Immunity. 2004;21:503–513. doi: 10.1016/j.immuni.2004.08.010. [DOI] [PubMed] [Google Scholar]
- 28.Powell JD. The induction and maintenance of T cell anergy. Clin Immunol. 2006;120:239–246. doi: 10.1016/j.clim.2006.02.004. [DOI] [PubMed] [Google Scholar]
- 29.Chen L, Rao A, Harrison SC. Signal integration by transcription-factor assemblies: interactions of NF-AT1 and AP-1 on the IL-2 promoter. Cold Spring Harb Symp Quant Biol. 1999;64:527–531. doi: 10.1101/sqb.1999.64.527. [DOI] [PubMed] [Google Scholar]
- 30.Heissmeyer V, Macian F, Im SH, Varma R, Feske S, Venuprasad K, Gu H, Liu YC, et al. Calcineurin imposes T cell unresponsiveness through targeted proteolysis of signaling proteins. Nat Immunol. 2004;5:255–265. doi: 10.1038/ni1047. [DOI] [PubMed] [Google Scholar]
- 31.Topilko P, Schneider-Maunoury S, Levi G, Baron-Van Evercooren A, Chennoufi AB, Seitanidou T, et al. Krox-20 controls myelination in the peripheral nervous system. Nature. 1994;371:796–799. doi: 10.1038/371796a0. [DOI] [PubMed] [Google Scholar]
- 32.Kirsch KH, Korradi Y, Johnson JP. Mader: a novel nuclear protein over expressed in human melanomas. Oncogene. 1996;12:963–971. [PubMed] [Google Scholar]
- 33.Huang CT, Huso DL, Lu Z, Wang T, Zhou G, Kennedy EP, Drake CG, et al. CD4+ T cells pass through an effector phase during the process of in vivo tolerance induction. J Immunol. 2003;170:3945–3953. doi: 10.4049/jimmunol.170.8.3945. [DOI] [PubMed] [Google Scholar]


