Abstract
♦ Background: Icodextrin, a glucose polymer with a polydispersity [ratio of weight-average molecular weight (Mw) to number-average molecular weight] of approximately 2.6, has been shown, compared with glucose, to provide superior ultrafiltration (UF) efficiency [ratio of UF to carbohydrate (CHO) absorbed] when used as an osmotic agent during a long-dwell peritoneal dialysis exchange. In an experimental rabbit model, we evaluated the effect of Mw on the UF and UF efficiency of glucose polymers with low polydispersity.
♦ Methods: A crossover trial in female New Zealand White rabbits (2.20 - 2.65 kg) with surgically implanted peritoneal catheters evaluated two glucose polymers at nominal concentrations of 7.5 g/dL: a 6K polymer (Mw: 6.4 kDa; polydispersity: 2.3) and a 19K polymer (Mw: 18.8 kDa; polydispersity: 2.0). Rabbits were randomized to receive either the 6K (n = 11) or the 19K (n = 12) solution during the first exchange (40 mL/kg body weight). The alternative solution was evaluated in a second exchange 3 days later. During each 4-hour dwell, the UF and total glucose polymer CHO absorbed were determined.
♦ Results: The UF was higher for the 6K (p < 0.0001) than for the 19K polymer (mean ± standard deviation: 73.6 ± 30.8 mL vs. 43.0 ± 20.2 mL), as was the amount of CHO absorbed (42.5% ± 9.8% vs. 35.7% ± 11.0%, p = 0.021). In spite of higher CHO absorption, an approximately 50% higher (p = 0.029) UF efficiency was achieved with the 6K polymer (28.3 ± 18.8 mL/g) than with the 19K polymer (19.0 ± 11.3 mL/g). The results were independent of the order of the experimental exchanges.
♦ Conclusions: Glucose polymers with low polydispersity are effective osmotic agents in a rabbit model. The low-Mw polymer was more effective at generating UF and had a higher UF efficiency, but those results came at the expense of the polymer being more readily absorbed from the peritoneal cavity.
Key words: Carbohydrate absorption, glucose polymer, molecular weight, polydispersity, rabbit, ultrafiltration
Icodextrin is an osmotic agent that is used in peritoneal dialysis (PD) solutions during a long-dwell exchange (1). This osmotic agent is not a single molecular entity; rather, it consists of a mixture of glucose polymers with a weight-average molecular weight between 12 kDa and 20 kDa and a number-average molecular weight between 5 kDa and 6.5 kDa. The ratio of the weight-average to the number-average molecular weight is a useful measure of the spread of polymer distribution (2). This ratio is often referred to as the polymer’s polydispersity, and it has been reported to be 2.6 for icodextrin (3). Early clinical studies by Mistry (4,5) demonstrated that a high-molecular-weight glucose polymer osmotic agent, similar to icodextrin, was superior to other glucose polymer osmotic agents of lower molecular weight and higher polydispersity.
Improved osmotic agents for long-dwell PD solutions have previously been proposed by several investigators. Some have advocated the use of a combination of icodextrin with glucose (6,7); others have suggested the use of monodisperse large-molecular-weight colloids based on theoretical calculations from the three-pore model of the peritoneum (8,9). For example, Rippe et al. (8) predicted that a 2-kDa monodisperse polymer osmotic agent at a concentration of 4% (g/dL) and a 10-kDa monodisperse polymer osmotic agent at a concentration of 6.5% would achieve ultrafiltration (UF) equivalent to that achieved with 3.86% glucose during a 10-hour dwell, and superior UF at dwell times greater than 10 hours. In a subsequent analysis, Rippe and Levin (9) predicted that the use of a 7.5% monodisperse glucose polymer (or dextrin) osmotic agent would provide approximately twice the amount of UF provided by commercial 7.5% icodextrin-based solution. Those theoretical analyses thus suggest that other glucose polymers may be superior to icodextrin as osmotic agents for PD solutions.
We hypothesized that glucose polymers with low polydispersity would be effective osmotic agents for use in PD solutions. In this report, we evaluate the effect of weight-average molecular weight on the UF characteristics of glucose polymers with low polydispersity (≤2.3) in an experimental rabbit model (10).
METHODS
SPECIAL MATERIALS
Experimental 6K and 19K glucose polymers with low polydispersity were obtained by additional fractionation of commercial icodextrin. The target polydispersity of these polymers was 2.0. The target weight-average molecular weights were 6 kDa and 19 kDa, respectively. The molecular weight averages of the glucose polymers were determined by size-exclusion chromatography.
EXPERIMENTAL PROCEDURES
Female New Zealand White rabbits with body weights ranging between 2.20 kg and 2.65 kg were used as experimental subjects. An intraperitoneal catheter (pediatric Tenckhoff catheter, Kendall-Quinton: Covidien, Mansfield, MA, USA) were surgically implanted in each rabbit by securing the first felt cuff on the catheter just outside the peritoneal cavity. The catheter was then guided through a subcutaneous tunnel exiting at the subcapsular region and secured with sutures. The rabbit was allowed to recover for 7 days before any solutions were infused into the peritoneal cavity.
This crossover study set out to evaluate differences in UF and solute transport characteristics when the experimental glucose polymers were used as osmotic agents (Figure 1). All rabbits received a daily infusion of 1.5% Dianeal (Baxter Healthcare Corporation, Deerfield, IL, USA) for 3 days (run-in phase). Each rabbit was then randomly assigned to undergo a dwell study using one of the glucose polymers; 3 days later, a dwell study with the alternative glucose polymer was performed. For the 2 days between the dwell studies, all rabbits received a daily infusion of 1.5% Dianeal (washout phase). The volume of each infusion or dwell was adjusted for body weight (40 mL/kg). The investigators were blinded to the identity of the two glucose polymer solutions during the experiments. Eleven rabbits completed the study protocol testing the 6K glucose polymer first, followed by the 19K glucose polymer (group A). Twelve rabbits completed the study protocol testing the 19K glucose polymer first, followed by the 6K glucose polymer (group B).
Figure 1.
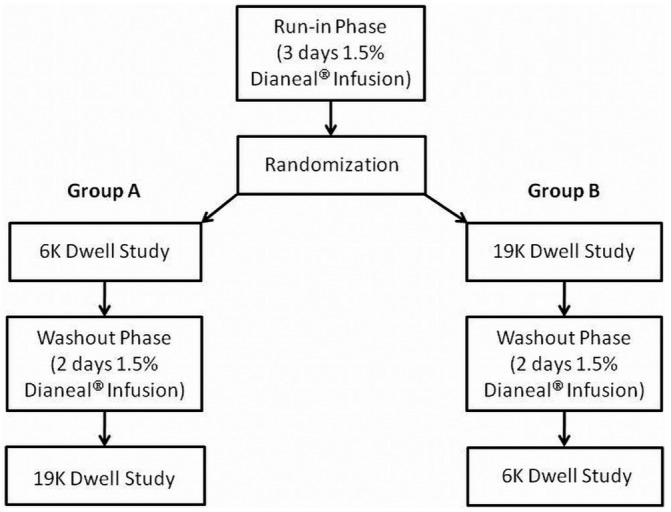
— Schematic diagram of the crossover study design.
Test solutions were prepared by adding approximately 7.5 g glucose polymer, 535 mg sodium chloride, 448 mg sodium lactate, 25.7 mg calcium chloride, and 5.08 mg magnesium chloride to make 100 mL solution. The endotoxin content of the glucose polymers was less than 0.05 EU/mL when tested using a Limulus amoebocyte lysate assay. The solutions were filtered using a 0.2 μm filter and heated to 37°C before use.
Tetramethylrhodamine (TMR)-dextran (70 kDa, molecular probe) is a large-molecular-weight compound that can be measured spectrophotometrically; it was added to each test solution at a concentration of 0.1 mg/mL before infusion in the peritoneal cavity to act as a volume marker. Unlabeled dextran 70 (Sigma, St. Louis, MO, USA) at a concentration of 0.9 mg/mL was also added to each solution to minimize tissue binding of the labeled dextran. After complete infusion of the test solution into the peritoneal cavity, 0.7 mL samples of dialysate were taken at 3, 30, 60, 90, 120, 180, and 240 minutes. Blood samples of 0.7 mL volume were taken at the beginning and end of each dwell. At the end of the 240-minute dwell, the peritoneal cavity was drained of approximately 75-100 mL, a volume that was measured gravimetrically. To ensure that all TMR-dextran concentrations remained within the calibration range, the peritoneal cavity was not completely drained at that time. Subsequently, 50 mL 1.5% Dianeal was added to the peritoneal cavity, and the contents of the peritoneal cavity were sampled after 5 minutes. The decrease in TMR-dextran concentration from the concentration measured after 240 minutes’ dwell time was used to calculate the residual fluid volume remaining in the peritoneal cavity at 240 minutes. The final volume of fluid within the peritoneal cavity was calculated as the sum of the drained and residual volumes, without correction for the volumes lost to sampling. The net UF volume was calculated as the final fluid volume minus the initial infused volume.
Plasma and dialysate urea nitrogen, creatinine, and alpha-amylase activity were measured using an autoanalyzer. Dialysate-to-plasma (D/P) concentration ratios were calculated at each dialysate sampling by dividing the instantaneous dialysate concentration by the average plasma concentration. Clearances for urea nitrogen and creatinine were calculated as the final volume multiplied by the D/P ratio divided by the dwell time (240 minutes). Dialysate osmolality was measured using freezing-point depression.
The glucose polymer carbohydrate (CHO) concentration was measured using a previously developed analytical method for icodextrin (11). The amount of glucose polymer CHO absorbed from the peritoneal cavity was calculated as the difference between the mass (concentration times volume) of glucose polymer CHO infused into the peritoneal cavity and the mass removed (concentration times final volume), expressed as a percentage of the original mass infused. The UF efficiency of each solution was calculated by dividing the net UF volume by the mass of glucose polymer CHO absorbed during the dwell.
STATISTICS
Comparisons between group A and B rabbits were performed using an unpaired Student t-test. Comparisons between dwell studies using the 6K and 19K glucose polymers were performed using a paired Student t-test, combining data from group A and B rabbits. No corrections were made for multiple comparisons when comparing D/P concentration ratios during the dwell studies.
RESULTS
Table 1 shows the weight-average and number-average molecular weights of the experimental glucose polymers. The target polydispersities and molecular weights were approximated, although the polydispersity of the 6K glucose polymer was higher than targeted. The molecular weight distribution of the glucose polymers was independently determined by García-López and colleagues (12-14); Figure 2 shows the results from those determinations.
TABLE 1.
Measured Weight-Average and Number-Average Molecular Weights of the Test Glucose Polymers
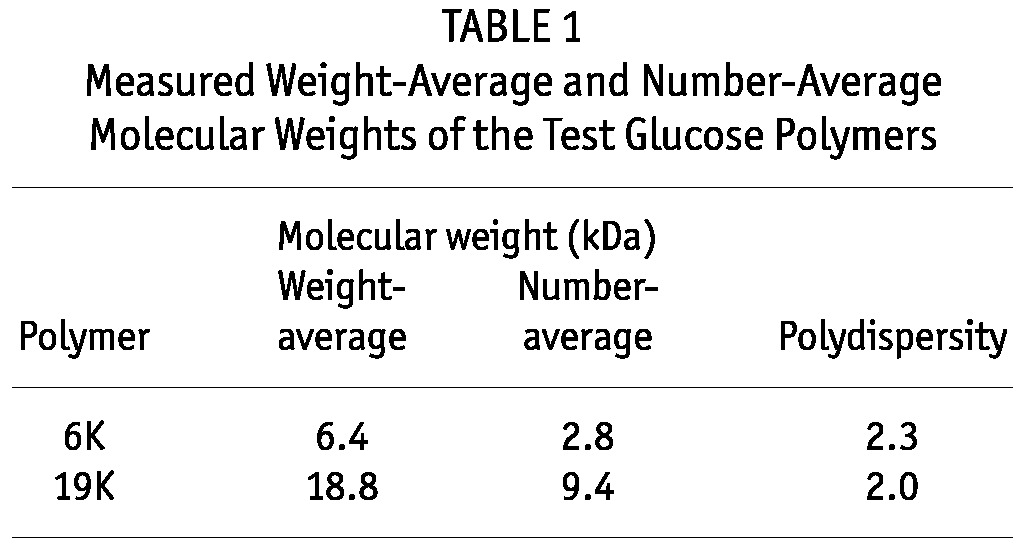
Figure 2.
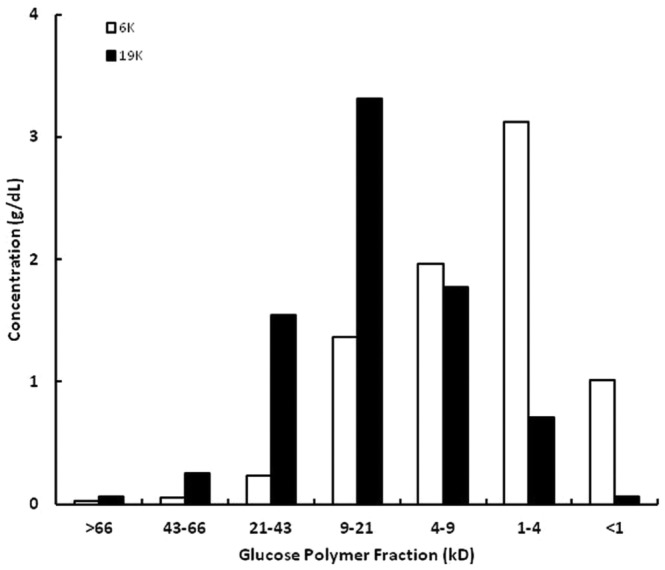
— Molecular weight distribution of the 6K and 19K glucose polymers as determined using methods previously described by García-López and Lindholm (12-14). Mean values from 4 separate determinations are shown.
Table 2 shows the characteristics of the group A and B rabbits at the beginning of each dwell study. No significant differences were observed between the group A and B rabbits, nor were there any noticeable carryover effects of the first dwell study on those measurements.
TABLE 2.
Characteristics of Group A and B Rabbits at the Beginning of Each Dwell Studya

Figure 3 shows the dependence of dialysate osmolality on dwell time for the 6K and 19K glucose polymers during this crossover study. Results are shown separately for the group A and B rabbits. The osmolality of the 6K glucose polymer was high initially and decreased during the first hour of the dwell. In contrast, the osmolality of the 19K glucose polymer was low initially and increased during the first 30 minutes of the dwell. The order of testing of the glucose polymers was of no significance. Those results were expected; the initial osmolality of each solution approached that of rabbit plasma during the dwell. (The range of serum osmolality for normal rabbits is 285 - 295 mOsm/kg.)
Figure 3.
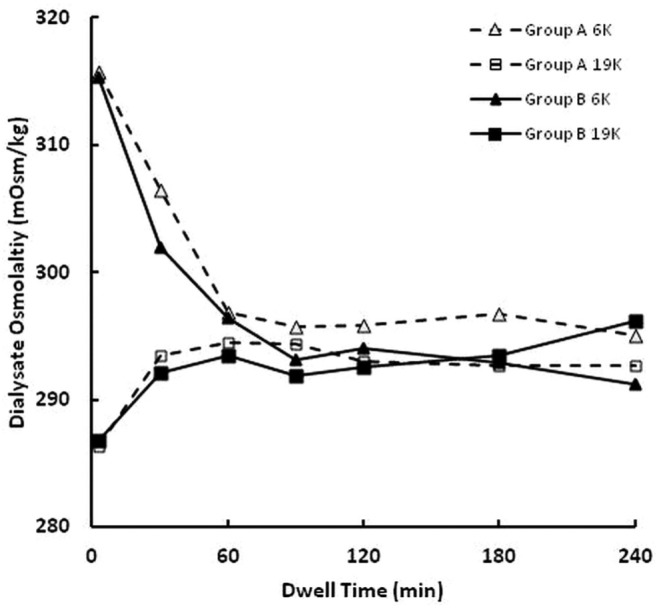
— Time dependence of dialysate osmolality. Dialysate osmolality was higher for the 6K than for the 19K glucose polymer at 3 minutes and 30 minutes (p < 0.001). The triangles (open = group A; closed = group B) denote results for the 6 K glucose polymer, and the squares (open = group A; closed = group B) denote results for the 19 K glucose polymer. Dashed lines denote group A rabbits (n = 11), and solid lines denote group B rabbits (n = 12).
Figures 4 and 5 show the dependences on dwell time of, respectively, D/P urea nitrogen and D/P creatinine. Statistically significant differences were observed in the D/P values for both solutes, but those differences were small, and equilibration was achieved during the 240-minute dwell under all conditions.
Figure 4.
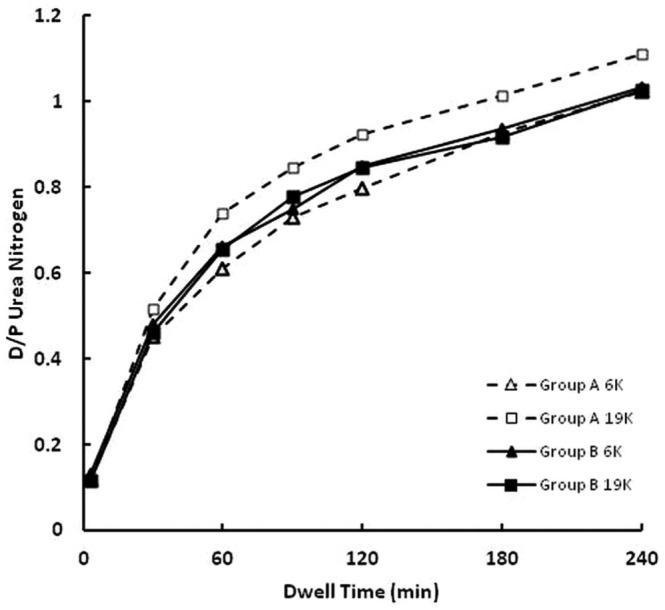
— Time dependence of the dialysate-to-plasma (D/P) concentration ratio of urea nitrogen. At 60, 90, and 120 minutes, D/P values were higher for the 19K than for the 6K glucose polymer (p < 0.05). The triangles (open = group A; closed = group B) denote results for the 6 K glucose polymer, and the squares (open = group A; closed = group B) denote results for the 19 K glucose polymer. Dashed lines denote group A rabbits (n = 11), and solid lines denote group B rabbits (n = 12).
Figure 5.
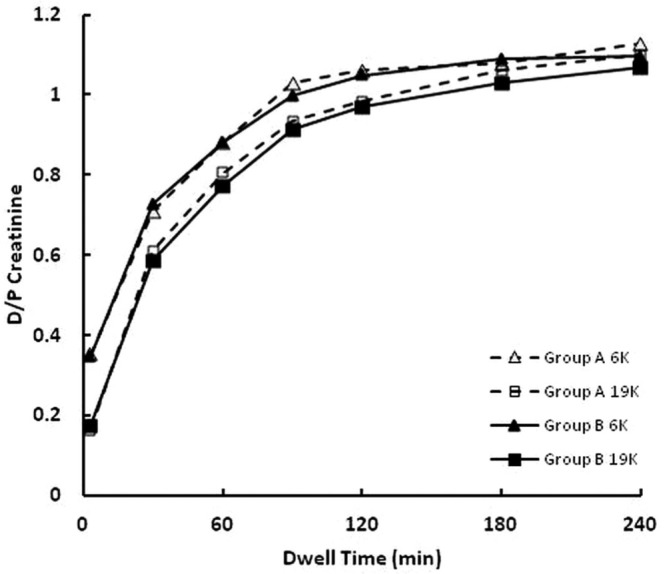
— Time dependence of the dialysate-to-plasma (D/P) concentration ratio of creatinine. At 3, 30, 60, 90, and 120 minutes, the D/P values were higher for the 6K than for the 19K glucose polymer (p < 0.001). The triangles (open = group A; closed = group B) denote results for the 6K glucose polymer, and the squares (open = group A; closed = group B) denote results for the 19K glucose polymer. Dashed lines denote group A rabbits (n = 11), and solid lines denote group B rabbits (n = 12).
Figure 6 shows net UF for the 6K and 19K glucose polymers; results are shown separately for group A and B rabbits. Net UF was higher for the 6K than for the 19K glucose polymer, independent of test order. Figure 7 shows the percentage CHO absorption for the 6K and 19K glucose polymers in a similar fashion. Percentage CHO absorption was higher for the 6K than the 19K glucose polymer, independent of the test order.
Figure 6.
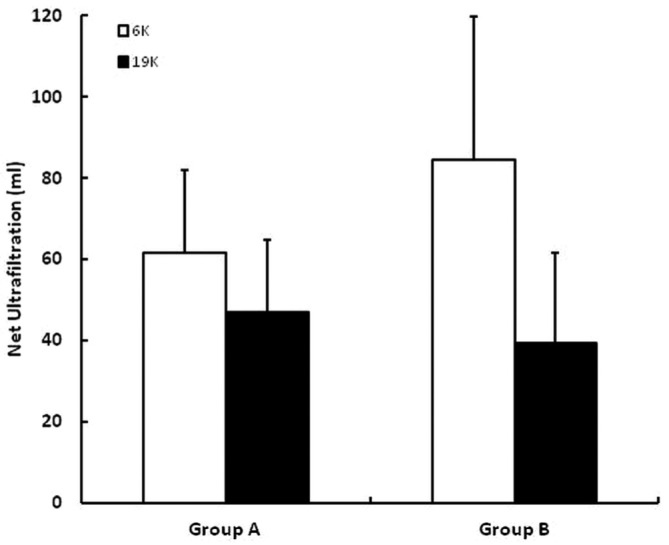
— Net ultrafiltration during dwells using the 6K glucose polymer (white bars) and the 19K glucose polymer (black bars). Results are shown separately for group A and B rabbits. The error bars denote 1 standard deviation.
Figure 7.
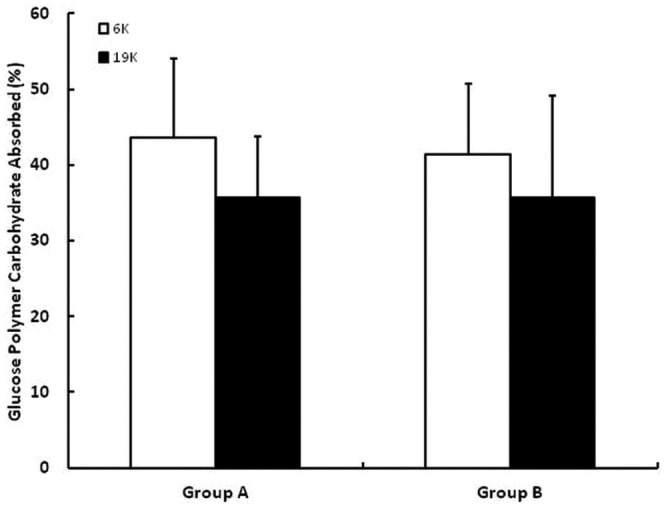
— Percent carbohydrate absorbed during dwells using the 6K glucose polymer (white bars) and the 19K glucose polymer (black bars). Results are shown separately for group A and B rabbits. The error bars denote 1 standard deviation.
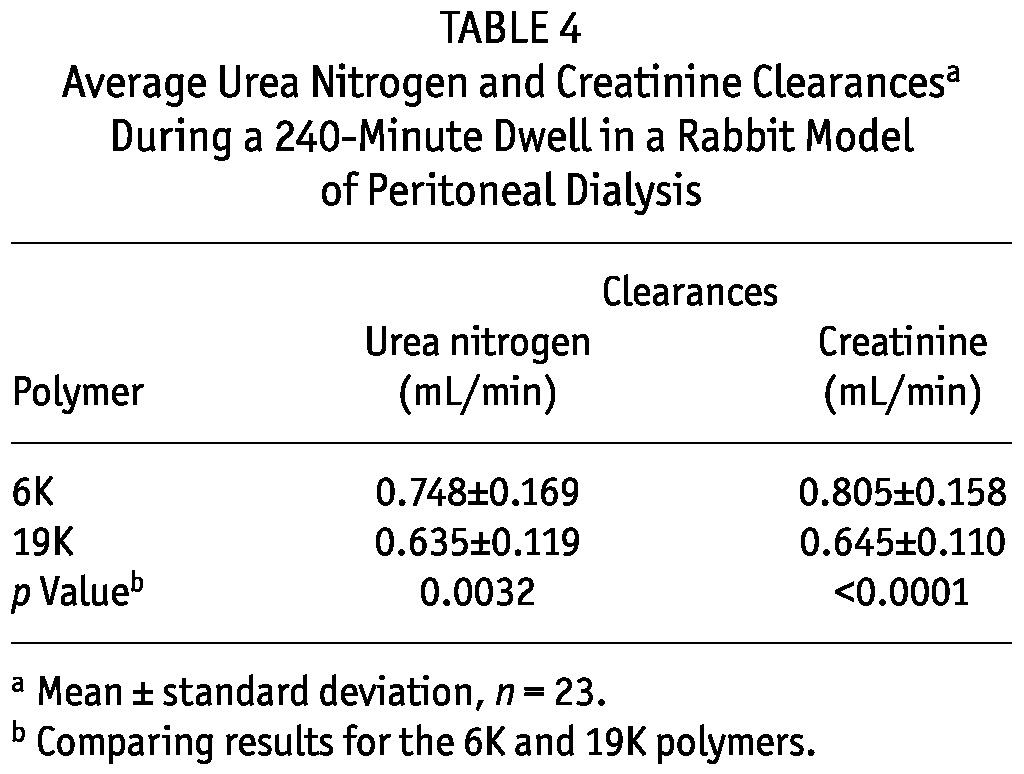
Table 3 summarizes the UF characteristics of the glucose polymer solutions for all 23 rabbits. The initial concentration of the 6K glucose polymer was slightly less than that of the 19K glucose polymer. In spite of that difference, the 6K glucose polymer induced higher net UF and CHO absorption than did the 19K glucose polymer. In spite of higher CHO absorption, an approximately 50% higher UF efficiency was seen with the 6K glucose polymer than with the 19K glucose polymer. Primarily because of differences in net UF, time-averaged urea nitrogen and creatinine clearances were higher for the 6K than for the 19K glucose polymer (Table 4).
TABLE 3.
Net Ultrafiltration, Carbohydrate Absorbed, and Ultrafiltration Efficiency of Glucose Polymers in a Rabbit Model of Peritoneal Dialysisa
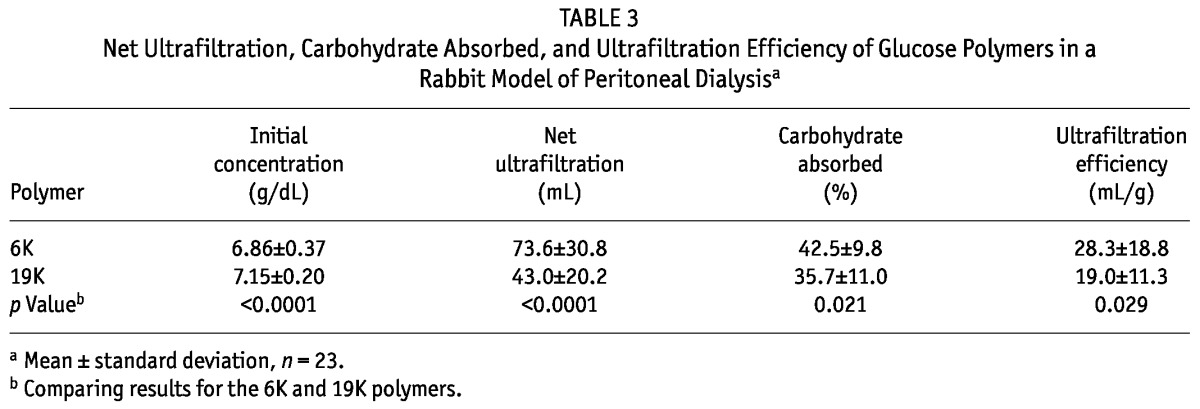
TABLE 4.
Average Urea Nitrogen and Creatinine Clearancesa During a 240-Minute Dwell in a Rabbit Model of Peritoneal Dialysis
Plasma alpha-amylase activity at the beginning and end of the dwell was measured in only 13 of 23 rabbits. Plasma activity was lower (p < 0.01) at the end of dwell, but did not differ in studies using the 6K glucose polymer (mean ± standard deviation: 211 ± 33 U/L at dwell start; 159 ± 25 U/L at dwell end) and the 19K glucose polymer (209 ± 34 U/L at dwell start; 164 ± 42 U/L at dwell end). Dialysate alpha-amylase activity at the end of the dwell was not different in studies using the 6K glucose polymer (35 ± 9 U/L) and the 19K glucose polymer (53 ± 73 U/L).
DISCUSSION
The results from this study demonstrate that differences in UF characteristics between solutions containing two experimental glucose polymers with low polydispersity can be revealed using a rabbit model of PD. Rabbit models have been used for decades to evaluate PD solutions and peritoneal transport (15-19), but no such evaluations of dialysis solutions containing glucose polymers as osmotic agents have been published, except for our previous work in abstract form (10). There are two advantages to using a rabbit model, compared with a rat model, to evaluate dialysis solutions containing glucose polymers as osmotic agents:
Rats have serum amylase levels that are 10 times those in rabbits (approximately 2000 U/L vs. approximately 200 U/L).
The kinetics of UF in rat models of PD using icodextrin as the osmotic agent have been reported to differ significantly from those in human PD (13,20-22).
It is well known that the kinetics of fluid and solute transport in animal models differ from those in PD patients because of differences in the ratios of the peritoneal surface area to the peritoneal cavity volume (23). Our previous work (10) and additional preliminary studies in the present rabbit model using radiolabeled albumin as a volume marker (24) have shown that, in the rabbit, a maximum in the peritoneal-volume-versus-time profile occurs after approximately 240 - 360 minutes’ dwell time when icodextrin is used as the osmotic agent. We therefore believe that dwell times of 240 minutes and more are relevant to the long dwell in PD patients.
The rabbit model used in this study is a simplified version of the model pioneered by Zweers et al. (19). Those investigators performed a daily exchange followed by an infusion in chronically catheterized rabbits; our model involved only a daily infusion of PD solution on days when experimental dwells were not performed. In the current model, we observed no evidence of peritonitis (no effluents were cloudy, and there was only occasional evidence of intraperitoneal bleeding). Moreover, the use of rabbits with chronic catheters in the current study allowed, for the first time, a crossover trial in rabbits to evaluate different PD solutions.
The reported differences in UF characteristics demonstrated by the glucose polymers are primarily a result of differences in their physical characteristics. In the present experiments, each glucose polymer was initially formulated at approximately 7.5 g/dL concentration (Table 3). The osmolality contributed by each polymer can be approximated by dividing the concentration by the number-average molecular weight of the polymer (because osmolality is a colligative property that is best characterized by the number-average molecular weight), namely 25 mOsm/kg (70 g/L divided by 2800 g/mol) for the 6K glucose polymer and 7 mOsm/kg (70 g/L divided by 9400 g/mol) for the 19K glucose polymer. Thus, most of the difference in initial osmolality between the test solutions (Figure 3) results from the different forces exerted by the glucose polymers.
The D/P concentration ratios for urea nitrogen and creatinine revealed small but statistically significant differences between the 6K and 19K glucose polymer solutions. Those differences may have been a result of inaccuracies in the analytical analyses and not to differences in solute transport across the peritoneal membrane. For example, the differences in D/P urea nitrogen and D/P creatinine were both reflected in their initial values at the time of solution infusion into the peritoneal cavity (time 0 samples). The time 0 D/P values for creatinine were 0.132 ± 0.009 for the 6K polymer solution and 0.004 ± 0.005 for the 19K glucose polymer solution. Those differences are highly statistically significant (p < 0.000001) and largely remained so throughout the remainder of the dwell (Figure 5). We believe that those differences may have been a result of specific interference in the creatinine assay of the presence of the 6K glucose polymer. It should also be noted that the dialysate concentrations of urea nitrogen between 3 and 60 minutes were often below the lower limit of quantification of the assay, suggesting that small differences observed during those time periods may not be reliable. Based on those limitations, we do not feel that the small differences in the D/P urea nitrogen and the D/P creatinine reflect true differences in solute transport across the peritoneal membrane when different glucose polymers are used as osmotic agents.
The UF characteristics of the glucose polymer solutions determined in this study are largely as expected theoretically if the glucose polymers are monodisperse polymers, as described previously by Rippe et al. (8). The smaller glucose polymer might be expected to generate higher UF because the number of polymer molecules is higher when the solutions are formulated at equal mass (or gram) concentration. The smaller glucose polymer would also be expected to diffuse more rapidly across the peritoneum such that its absorption would be higher. The current work demonstrates for the first time, however, that when glucose polymers are formulated at equal mass concentration, the relative increase in UF is greater than the relative increase in CHO absorption, resulting in the smaller glucose polymer having a higher UF efficiency (in milliliters per gram of absorbed glucose polymer). Further, the present studies demonstrate for the first time that differences in the UF characteristics of glucose polymers can be experimentally measured in an animal model.
Several additional limitations to this study require further discussion, especially concerning the use of a rabbit model of PD.
First, the plasma and dialysate alpha-amylase activity reported here is less than that reported in a rat model of PD (13), suggesting that, in dwell studies, glucose polymer metabolism is lower in the rabbit than in the rat. On the other hand, dialysate alpha-amylase activity in the rabbit significantly exceeded dialysate levels measured in PD patients (12). That observation suggests that icodextrin and other glucose polymers are more rapidly metabolized in the rabbit than in PD patients, a conclusion supported by noting that 35% - 45% of glucose polymers are absorbed from the peritoneal cavity in the rabbit during a 240-minute dwell (Figure 7) but that similar approximate percentages of icodextrin are absorbed in PD patients only after a 10- to 12-hour dwell (12,25). Part of this difference in polymer absorption from the peritoneal cavity may also be a result of the larger ratio of surface area to volume in the rabbit (23).
Second, it should be emphasized that the rabbit model used in the current study is nonuremic; that factor is advantageous in allowing a short “wash out” phase in a crossover trial design, but disadvantageous in that plasma concentrations of urea nitrogen and creatinine are low (that is, within the normal range; Table 2). The low plasma concentrations of those solutes magnify small biases in the analytic methods, making precise evaluation of small-solute transport across the peritoneum difficult, as noted earlier.
Third, the use of a 240-minute dwell may be considered somewhat arbitrary. As already mentioned, our unpublished data suggest that dwell studies between 240 and 480 minutes in the rabbit provide an approximate plateau in net UF, similar to that observed in PD patients from 10 hours to 14 hours (26).
Fourth, TMR-dextran was used as a volume marker in these studies; however, postmortem examinations made it apparent that significant amounts of the marker were absorbed into tissues surrounding the peritoneal cavity during the 240-minute dwell. It was not possible to quantitatively assess the extent of tissue absorption of the marker. Such measurements of the dialysate volume-versus-time profile can therefore be considered only semi-quantitative and are not reported here. In contrast, measurements of residual volume using TMR-dextran as a volume marker over a short 5-minute period during the assessment of residual volume should be relatively unaffected by minor tissue absorption.
Fifth, the use of surgically implanted catheters in the present study may have resulted in biofilm formation and tissue remodeling (27-29), and those foreign-body responses may have altered the transport characteristics of the rabbit peritoneum. Because the dependence of our findings on molecular weight is similar to the theoretical predictions (8), we believe that large changes in peritoneal transport because of biofilm formation were unlikely to have occurred in the present experiments.
Finally, the optimal characteristics of glucose polymers with low polydispersity cannot be determined from these experiments; further studies are required.
CONCLUSIONS
The results of the current crossover trial show that glucose polymers with low polydispersity are effective osmotic agents in a rabbit model. Although a low molecular weight glucose polymer is more effective at generating UF and produces a higher UF efficiency, those factors come at the expense of the polymer being more readily absorbed from the peritoneal cavity.
DISCLOSURES
All authors are employed by Baxter Healthcare Corporation with ownership interest.
Acknowledgments
All funds for this work were provided by Baxter Healthcare Corporation.
References
- 1. Blake PG. Icodextrin: fifteen years and counting. Introduction. Perit Dial Int 2009; 29:367–9 [PubMed] [Google Scholar]
- 2. Tanford C. Physical Chemistry of Macromolecules. New York, NY: John Wiley and Sons; 1961. [Google Scholar]
- 3. Vonesh EF, Story KO, Douma CE, Krediet RT. Modeling of icodextrin in PD Adequest 2.0. Perit Dial Int 2006; 26:475–81 [PubMed] [Google Scholar]
- 4. Mistry CD. Glucose polymer as an osmotic agent in continuous peritoneal dialysis [Thesis]. London, UK: University of London; 1988. [Google Scholar]
- 5. Mistry CD. The beginning of icodextrin. Perit Dial Int 2011; 31(Suppl 2):S49–52 [DOI] [PubMed] [Google Scholar]
- 6. Freida P, Wilkie M, Jenkins S, Dallas F, Issad B. The contribution of combined crystalloid and colloid osmosis to fluid and sodium management in peritoneal dialysis. Kidney Int Suppl 2008; (108):S102–11 [DOI] [PubMed] [Google Scholar]
- 7. Freida P, Issad B, Dratwa M, Lobbedez T, Wu L, Leypoldt JK, et al. A combined crystalloid and colloid PD solution as a glucose-sparing strategy for volume control in high-transport PD patients: a prospective multicenter study. Perit Dial Int 2009; 29:433–42 [PubMed] [Google Scholar]
- 8. Rippe B, Zakaria el-R, Carlsson O. Theoretical analysis of osmotic agents in peritoneal dialysis. What size is the ideal osmotic agent? Perit Dial Int 1996; 16(Suppl 1):S97–103 [PubMed] [Google Scholar]
- 9. Rippe B, Levin L. Computer simulations of ultrafiltration profiles for an icodextrin-based peritoneal fluid in CAPD. Kidney Int 2000; 57:2546–56 [DOI] [PubMed] [Google Scholar]
- 10. Hoff CM, Piscopo D, Carr S, Svatek J, Feldmann B, Arora N, et al. A rabbit model for the study of icodextrin peritoneal dialysis solutions [Abstract]. J Am Soc Nephrol 2007; 18:470A [Google Scholar]
- 11. Wang R, Moberly JB, Martis L, Shockley TR, Mongoven JW, Patel H, et al. A rapid assay for icodextrin determination in plasma and dialysate. Adv Perit Dial 2002; 18:91–5 [PubMed] [Google Scholar]
- 12. García-López E, Anderstam B, Heimbürger O, Amici G, Werynski A, Lindholm B. Determination of high and low molecular weight molecules of icodextrin in plasma and dialysate, using gel permeation chromatography, in peritoneal dialysis patients. Perit Dial Int 2005; 25:181–91 [PubMed] [Google Scholar]
- 13. García-López E, Pawlaczyk K, Anderstam B, Qureshi AR, Kuzlan-Pawlaczyk M, Heimbürger O, et al. Icodextrin metabolism and alpha-amylase activity in nonuremic rats undergoing chronic peritoneal dialysis. Perit Dial Int 2007; 27:415–23 [PubMed] [Google Scholar]
- 14. García-López E, Lindholm B. Icodextrin metabolites in peritoneal dialysis. Perit Dial Int 2009; 29:370–6 [PubMed] [Google Scholar]
- 15. Aune S. Peritoneal permeability studied by transperitoneal clearance of urea, PAH, inulin, and serum albumin in rabbits. Scand J Gastroenterol 1970; 5:85–97 [PubMed] [Google Scholar]
- 16. Maher JF, Cassetta M, Shea C, Hohnadel DC. Peritoneal dialysis in rabbits. A study of transperitoneal theophylline flux and peritoneal permeability. Nephron 1978; 20:18–23 [DOI] [PubMed] [Google Scholar]
- 17. Gotloib L, Crassweller P, Rodella H, Oreopoulos DG, Zellerman G, Ogilvie R, et al. Experimental model for studies of continuous peritoneal dialysis in uremic rabbits. Nephron 1982; 31:254–9 [DOI] [PubMed] [Google Scholar]
- 18. Leypoldt JK, Parker HR, Frigon RP, Henderson LW. Molecular size dependence of peritoneal transport. J Lab Clin Med 1987; 110:207–16 [PubMed] [Google Scholar]
- 19. Zweers MM, Douma CE, de Waart DR, van der Wardt AB, Ho-dac-Pannekeet MM, Krediet RT, et al. The standard peritoneal permeability analysis in the rabbit: a longitudinal model for peritoneal dialysis. Perit Dial Int 1999; 19:56–64 [PubMed] [Google Scholar]
- 20. Wang T, Heimbürger O, Cheng HH, Bergström J, Lindholm B. Peritoneal fluid and solute transport with different polyglucose formulations. Perit Dial Int 1998; 18:193–203 [PubMed] [Google Scholar]
- 21. Wang T, Cheng HH, Heimbürger O, Waniewski J, Bergström J, Lindholm B. Effect of peritonitis on peritoneal transport characteristics: glucose solution versus polyglucose solutions. Kidney Int 2000; 57:1704–12 [DOI] [PubMed] [Google Scholar]
- 22. de Waart DR, Zweers MM, Struijk DG, Krediet RT. Icodextrin degradation products in spent dialysate of CAPD patients and the rat, and its relation with dialysate osmolality. Perit Dial Int 2001; 21:269–74 [PubMed] [Google Scholar]
- 23. Rippe B. How to assess transport in animals? Perit Dial Int 2009; 29(Suppl 2):S32–5 [PubMed] [Google Scholar]
- 24. Hoff CM, Piscopo D, Carr S, Svatek JM, Holmes CJ, Wang R, et al. Evaluation of glucose and icodextrin-based bimodal peritoneal dialysis solutions in a rabbit model. In: EuroPD: 10th European Peritoneal Dialysis Meeting 2011. Book of Abstracts. 2011; 14 [Google Scholar]
- 25. Moberly JB, Mujais S, Gehr T, Hamburger R, Sprague S, Kucharski A, et al. Pharmacokinetics of icodextrin peritoneal dialysis patients. Kidney Int Suppl 2002; (81):S23–33 [DOI] [PubMed] [Google Scholar]
- 26. Jeloka TK, Ersoy FF, Yavuz M, Sahu KM, Camsari T, Utaş C, et al. What is the optimal dwell time for maximizing ultrafiltration with icodextrin exchange in automated peritoneal dialysis patients? Perit Dial Int 2006; 26:336–40 [PubMed] [Google Scholar]
- 27. Flessner MF, Credit K, Henderson K, Vanpelt HM, Potter R, He Z, et al. Peritoneal changes after exposure to sterile solutions by catheter. J Am Soc Nephrol 2007; 18:2294–302 [DOI] [PubMed] [Google Scholar]
- 28. Flessner MF, Credit K, Richardson K, Potter R, Li X, He Z, et al. Peritoneal inflammation after twenty-week exposure to dialysis solution: effect of solution versus catheter-foreign body reaction. Perit Dial Int 2010; 30:284–93 [DOI] [PubMed] [Google Scholar]
- 29. Yung S, Chan TM. Tissue remodeling and inflammation during peritoneal dialysis: catheter versus fluid. Perit Dial Int 2010; 30:274–6 [DOI] [PubMed] [Google Scholar]


