

Abstract
Background.
The association between obesity and dementia has been inconsistent, possibly due to changes in body composition often seen in old age. Leptin may be associated with better cognitive function. However, neuroprotection may be inhibited among obese subjects possibly due to leptin resistance. We sought to determine (i) if leptin is associated with risk of dementia or mild cognitive impairment (MCI) in a cohort of very old women, (ii) if this association is modified by obesity, and (iii) if leptin is a stronger risk factor compared with traditional anthropometric measures.
Methods.
We studied 579 older women (mean age 82.6 years) from the ongoing prospective cohort Study of Osteoporotic Fractures, who were dementia-free at year-16 examination (our study baseline). Leptin (ng/mL) was measured using year-16 frozen serum, and anthropometric measures were collected during the same visit. Diagnosis of dementia/MCI was determined at year-20 examination.
Results.
There was evidence for a multiplicative interaction between log leptin and categorical body mass index (p = .03). Among women with body mass index <25kg/m2 (n = 190), 1SD difference in log leptin (0.91ng/mL) was associated with 32% lower odds of dementia/MCI (OR = .68; 95% CI = .46, .99), after adjustment. The association was not significant among women with body mass index ≥25kg/m2 (n = 377). Traditional anthropometric measures such as weight, height, and body mass index were not associated with dementia/MCI.
Conclusions.
In this cohort of very old women, higher serum leptin was prospectively associated with lower odds of dementia/MCI in women with normal body mass index, but not in overweight or obese women. Leptin may be a better predictor of dementia/MCI than traditional anthropometric measures.
Key Words: Dementia, Elderly, Leptin, Obesity
With the rapidly aging population, dementia will become an ever greater public health concern (1,2). Identifying modifiable risk factors for prevention of cognitive impairment is thus extremely important. Body mass index (BMI) and waist circumference at mid-life may be associated with dementia (3–6). However, this association is more controversial in older adults, possibly due to age-related changes in body composition such as loss of lean mass and increases in fat mass (7–9). Indeed, the prospective associations of obesity measures, such as BMI and waist circumference, and dementia differed by age (<76 years vs ≥76 years) among the elderly population residing in northern Manhattan (10). Furthermore, the pooled association between high BMI and increased dementia risk was moderate (RR = 1.42; 95% CI = .93, 2.18), according to a recent meta-analysis (3). Therefore, the link between body composition and dementia risk in older adults is very complex. Additionally, the associations between traditional obesity risk factors and dementia risk may differ according to mean age of the baseline cohort such as a very old cohort versus a younger–older adult cohort.
Adipose tissue is a primary source for the production and secretion of leptin, a metabolic biomarker of body fat (11). Although leptin was originally considered an antiobesity protein because of its regulatory role in maintenance of body weight (12); a growing body of evidence suggests that leptin is implicated in cognitive decline and dementia processes. The majority of work has been limited to animal models (13–17). The few observational studies of older adults have reported that higher leptin was associated with less risk of cognitive decline and dementia (18–21). General obesity, measured by BMI, is a common risk factor for cognitive impairment (22). Subjects with high BMI often develop hyperleptinemia, ie, increased serum leptin concentration in proportion to body fat, and thus leptin resistance (23). Leptin resistance may interfere with the action of leptin on the brain (24,25), which may be a possible explanation for the lack of associations of leptin with risk of dementia and Alzheimer’s disease (AD) among participants of the Framingham study with high BMI and high waist-to-hip ratio (20).
We sought to explore the associations between leptin and risk of mild cognitive impairment (MCI) and dementia in a very old cohort of women enrolled in an ongoing study of aging. We also were interested in exploring whether overweight or obesity status modified this association, possibly due to leptin resistance.
Methods
Study Population
Participants were enrolled in the Study of Osteoporotic Fractures (SOF), a prospective cohort study of women aged 65 years and older at baseline (1986–1988). SOF is a multicenter prospective study with four sites across the United States: namely, Baltimore, Maryland; Minneapolis, Minnesota; Portland, Oregon; and Monongahela Valley, Pennsylvania. Study participants were followed for an average of 20 years. Every 2–4 years, biological and clinical data were collected from the participants who attended the clinics at the various sites. The study was approved by the appropriate committees on human research. All participants provided a written consent form. Further details on the study design and recruitment have been published elsewhere (26).
A total of 1,040 participants had serum leptin measured using frozen serum at year 16 (our study baseline). The 1,040 participants were randomly selected from those who completed the sleep ancillary study. Of these 1,040, a total of 250 were not examined at year 20 due to death (20.0%), termination (3.8%), or loss-to-follow up (0.2%). The 250 participants who were not examined at year 20 did not differ from the remaining 790 participants on the main covariates of interest such as BMI and leptin (data not shown). Of the remaining 790 participants, we excluded 15 participants because they had prevalent dementia at baseline based on a self-reported diagnosis of dementia or AD or use of AD medications. We further excluded 196 participants because they were not at the sites that participated in the cognitive assessment. A total of 579 participants thus constituted our analytic cohort.
Measures
Leptin level was measured at year 16 (2002–2004: our study baseline). Blood was drawn into tubes using the venipuncture technique. Collected blood was then centrifuged and stored in tubes at cold temperature of −20°C within 2 hours of collection. Frozen samples were then shipped to be analyzed at the University of Maryland Cytokine Core Laboratory (Baltimore, MD) using the DuoSet ELISA assay with a coefficient of variation of 5%. Leptin was measured in pg/mL and reported in ng/mL (1ng/mL = 1,000 pg/ml).
At year 20 examination (2006–2008), dementia/MCI diagnosis was determined using a two-stage process. First, participants were screened for cognitive impairment using an expanded neuropsychological test battery. Those who screened negative were considered cognitively normal. Those who screened positive were further clinically adjudicated by a panel of clinical experts. Criteria for a diagnosis of dementia were based on the Diagnostic and Statistical Manual of Mental Disorders (DSM-IV) (27) and that of MCI were based on the modified Peterson criteria (28). Further details on the two-stage process of dementia/MCI diagnosis and definition criteria have been published elsewhere (29).
At baseline (year 16), participants self-reported their age, education, race (white vs African American), marital status, smoking status, current alcohol consumption (defined as number of glasses/week), and physical activity (defined as number of blocks walked per day for exercise). Height and weight were measured, and BMI was calculated as weight divided by height squared (in kg/m2). BMI was categorized into normal (BMI <25kg/m2) versus overweight or obese (BMI ≥25kg/m2). Less than 1% of our study sample was underweight (BMI <18.5kg/m2). Participants self-reported whether they had ever been diagnosed by a physician with a variety of medical conditions including dementia or AD, diabetes, stroke or transient ischemic attack, and hypertension. Using the 15-item Geriatric Depression Scale, participants with a score of 6 or higher were considered to have elevated depressive symptoms (30).
Statistical Analysis
To meet the normality assumptions, we analyzed leptin on the log scale (natural logarithm). Analysis of variance and chi-square tests were used to test for the associations of baseline covariates with tertiles of leptin (Table 1). In regression models, we analyzed leptin as continuous. Logistic regression models were used to examine the associations of leptin (per standard deviation, SD) and anthropometric measures with risk of dementia/MCI status. We also tested for effect measure modification by BMI of the association between leptin and dementia/MCI by including an interaction term (BMI × leptin) in the statistical models. The interaction was statistically significant at an alpha level of .05 and therefore the multivariate results illustrated in the Figure 1 were stratified by BMI (<25kg/m2 vs ≥25kg/m2). At the multivariate level, we adjusted for covariates that were associated with leptin at the bivariate level at an alpha significance of .05, as shown in Table 1, except for weight due to colinearity with BMI. All statistical analyses were performed using SAS v.9.2 (31).
Table 1.
Baseline Characteristics of Participants, Stratified by Leptin Tertile
| Covariates | Overall (N = 579)Mean ± SD or N (%) | Leptin Tertile (ng/mL)*,† | |||
| Low | Medium | High | p value‡ | ||
| Age (y) | 82.6±3.1 | 83.1±3.1 | 82.3±3.2 | 82.4±3.1 | .02 |
| White | 516 (89) | 187 (97) | 169 (88) | 160 (83) | <.01 |
| Education (y) | 12.9±2.6 | 13.2±2.5 | 13.0±2.8 | 12.3±2.6 | <.01 |
| Married | 181 (31) | 66 (34) | 60 (31) | 55 (28) | .78 |
| Alcohol consumption (glasses/week) | 1.2±3.3 | 1.5±3.2 | 1.0±2.7 | 1.2±3.9 | .34 |
| Current smokers | 10 (2) | 3 (2) | 1 (1) | 6 (3) | .14 |
| Number of blocks walked/day for exercise | 10.3±8.7 | 11.4±10.3 | 10.0±7.3 | 8.6±7.1 | .15 |
| Weight | 66.5±11.3 | 59.1±9.2 | 68.0±9.7 | 72.9±10.3 | <.01 |
| Body mass index (BMI, kg/m2) | <.01 | ||||
| Overweight (25 ≤ BMI <30) | 235 (41) | 56 (29) | 96 (50) | 83 (43) | |
| Obese (BMI ≥ 30) | 139 (24) | 11 (6) | 46 (24) | 82 (43) | |
| Diabetes | 64 (11) | 16 (8) | 23 (12) | 25 (13) | .31 |
| Depression | 47 (8) | 14 (7) | 14 (7) | 19 (10) | .56 |
| Stroke | 50 (9) | 18 (9) | 14 (7) | 18 (9) | .70 |
| Hypertension | 340 (59) | 95 (49) | 111 (58) | 134 (69) | <.01 |
*The range of values for leptin tertiles (ng/ml) is: low (.7, 11.4); medium (11.5, 24.8); high (25.0, 123.9)
† Leptin was analyzed on the log scale
‡ Analysis of variance or chi-square tests
Figure 1.
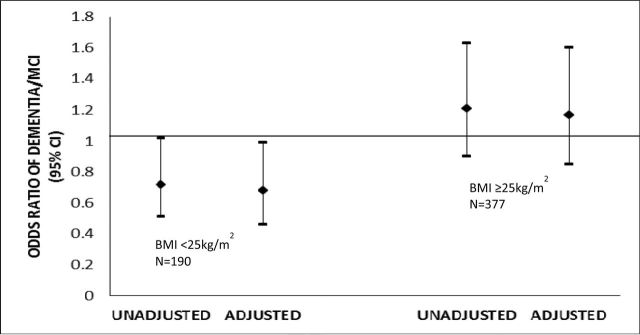
The association of 1 standard deviation (SD) difference in leptin with dementia/MCI, stratified by body mass index. This association was assessed in a logistic model, adjusted for age, race, education, and hypertension. Leptin (ng/mL) was analyzed on the log scale. 1SD log leptin = .91ng/mL. The overall p value for interaction between body mass index and log leptin was .03 in the adjusted model.
Results
Table 1 shows the descriptive characteristics for the overall sample and by leptin tertile. The mean age of women at baseline was 82.6 years (SD = 3.1), 89% were white and had a mean of 12.9 years of education, and slightly less than one third of them were married. Women consumed on average 1.2 glasses of alcohol per week and walked an average of 10 blocks per day. The majority of women did not smoke. A total of 35.4% of the participants had a normal BMI, 40.6% were overweight, and the remaining 24% were obese. Of the total sample, 11.1% reported a diagnosis of type 2 diabetes, 8.1% had depression, 8.6% reported a stroke, and more than half of the sample had hypertension. Compared with those in the lower leptin tertile, women in the higher leptin tertile were younger, non-white, less educated, and had higher BMI and hypertension. Being married, alcohol consumption, smoking, physical activity, and diagnoses of type 2 diabetes, depression, and stroke were not associated with leptin.
There were 236 dementia/MCI cases at year 20 (93 dementia and 143 MCI). Table 2 shows the associations of baseline log leptin and anthropometric risk factors with dementia/MCI. Log leptin, BMI, weight, and height were not associated with dementia/MCI in unadjusted models. The results remained similar after adjustment for age, race, education, and hypertension.
Table 2.
Association of Baseline Leptin and Anthropometric Characteristics with Dementia/MCI (N = 579)
| Unadjusted | Adjusted* | |||
| Variable | OR | 95% CI | OR | 95% CI |
| Body Mass Index (kg/m2) | ||||
| Normal (BMI <25) | 1.0 | – | 1.0 | – |
| Overweight (25 ≤ BMI <30) | .85 | .57, 1.25 | .77 | .51, 1.15 |
| Obese (BMI ≥30) | .92 | .59, 1.43 | .85 | .53, 1.38 |
| Weight (kg)‡ | .90 | .76, 1.06 | .99 | .97, 1.01 |
| Height (cm)‡ | .90 | .76, 1.06 | .99 | .96, 1.02 |
| Leptin (ng/mL)†‡ | .92 | .78, 1.08 | .87 | .72, 1.04 |
Notes: CI = confidence interval; OR = odds ratio.
*Adjusted for age, race, education, and hypertension.
†Leptin was analyzed on the log scale.
‡ Results are associated with 1SD difference in weight (SD = 11.3), height (SD = 5.4), and log leptin (SD = .91).
§There are 236 dementia/MCI cases: 93 cases of dementia and 143 cases of MCI.
The results from multivariate models examining the association between log leptin and dementia/MCI showed a significant statistical interaction between log leptin and categorical BMI (p value = .03), adjusting for age, race, education, and hypertension (data not shown). Thus, we further examined the associations between log leptin and dementia/MCI stratified by BMI (BMI <25kg/m2 and BMI ≥25kg/m2). In unadjusted models, 1 SD difference in log leptin was associated with lower odds of dementia/MCI for women with BMI <25kg/m2 (OR = .72; 95% CI .51–1.02) but not for women with BMI >25kg/m2 (OR = 1.21; 95% CI .90–1.63). After adjustment for age, race, education, and hypertension, the odds of dementia/MCI associated with 1 SD difference in log leptin was significant for women with normal BMI (OR = .68; 95% CI = .46, .99). After multivariate adjustment, the results remained nonsignificant for women with high BMI (OR = 1.17; 95% CI = .85, 1.60) (see Figure 1).
Discussion
We examined the relationship between leptin and the odds of dementia/MCI after a mean of 5 years of follow-up in a community-dwelling cohort of very old women. Traditional anthropometric measures including weight, height, and BMI did not predict the odds of dementia/MCI. However, leptin, a sensitive marker of adiposity, was associated with 32% lower odds of dementia/MCI among women with normal BMI <25kg/m2. Higher leptin was not associated with dementia/MCI among overweight or obese women.
Rodent studies shed light on several potential mechanisms through which leptin is suggested to influence brain structure and function. First, through its influence on the synaptic plasticity of the hippocampus, leptin was found to improve memory and learning functions (17,32). For example, dysfunction in leptin receptors has been associated with impaired performance on spatial memory tasks (13,33). Furthermore, when leptin was directly administered into the hippocampus of leptin-deficient or resistant rats, it was associated with enhanced memory and learning processes (15). Second, leptin was suggested to enhance N-methyl-d-aspartate receptor function, which modulates short-term potentiation into long-term potentiation in the hippocampus (14,17). Third, leptin was suggested to influence apolipoprotein-E-mediated uptake of beta-amyloid, a major genetic risk factor for AD (16).
Our findings are consistent with these experimental studies as well as with a few recent population-based observational studies demonstrating a protective effect of leptin on cognitive function and dementia. Cross-sectional results from a small case–control study have shown that patients with AD have lower levels of serum leptin than patients without AD (21). Recent cross-sectional findings from the National Health and Nutrition Examination Survey III have shown that participants <60 years old with the middle tertile of leptin have fewer number of errors on the symbol digit substitution test compared with those with the lowest tertile (18). The highest tertile of leptin was not associated with cognitive performance. Further results from a prospective study among older adults of Health, Aging, and Body Composition study (Health ABC) suggested an inverse relationship between serum levels of leptin and rate of cognitive decline, such that higher leptin level was associated with lower odds of cognitive impairment over 4 years of follow-up (19). Finally, results from the Framingham study also provided evidence for a prospective association between higher leptin and lower risks of dementia and AD (20).
Our results corroborate evidence suggesting that obesity may interfere with the neuroprotective effect of leptin on the brain, possibly by leptin resistance. Consequently, acquired leptin resistance may constitute a potential mechanism through which obesity influences cognitive function. Leptin resistance may result in compromised leptin transport across the blood–brain barrier as well as reduced leptin signaling (24,25,34,35) which in turn may interfere with the action of leptin on the brain. Furthermore, obesity is well recognized as a state of inflammation in which increased levels of inflammatory biomarkers may interfere with leptin receptors and inhibit the neuroprotective effect of leptin on the brain (36,37). Our findings are consistent with the results from the Framingham study in which higher leptin was associated with lower risk of dementia and AD among subjects who were not obese (BMI <30kg/m2 or with the lowest three quartiles of waist-to-hip ratio) but not if obese (20). Our results were not consistent with those from Health ABC, which found the association to be independent of BMI and percent body fat (19).
The association of obesity, as measured by BMI, with dementia risk is complex. Although high obesity in midlife has been associated with increased risk of dementia (4,5), studies that examined the association of late-life obesity with risk of dementia have yielded conflicting results (10,38,39). Recent findings from the Cardiovascular Health Study evaluated the association between BMI and the risk of dementia for the same subjects at two different life stages (40). The latter study found a u-shaped association between midlife BMI and risk of dementia and an inverse association between late-life BMI and risk of dementia. Thus, available evidence suggests that the association of BMI with dementia changes with age (10). At older ages, in particular, BMI may not be an accurate measure of adiposity. Therefore, the predictive ability of leptin at older ages, the level of which increases with adiposity, may present an opportunity to examine in a more accurate way the relation between adiposity and cognition.
This study has some limitations that are worth noting. Our study sample is primarily a white population (89.1%), which limits our ability to generalize our results to other racial or ethnic groups. Our sample comprised of women only and thus our findings may not be generalized to men. Although we adjusted for potential confounders, the possibility of residual confounding cannot be completely ruled out. However, this study has many strengths. Importantly, our results take advantage of a unique prospectively followed cohort of very old women who have been followed for nearly 20 years. Furthermore, clinical and biological data were collected and the diagnosis of dementia/MCI followed a thorough two-stage examination process.
In conclusion, in our community-dwelling cohort of very old women, higher levels of leptin were prospectively associated with lower odds of dementia/MCI for women with low BMI. Higher levels of leptin did not confer any neuroprotective benefit for overweight or obese women. We have provided evidence that leptin plays an important role in cognitive function and may constitute a potential pathway through which obesity influences cognitive function. This is of particular importance, given that anthropometric and obesity measures such as height, weight, and BMI may be inconsistent in their prediction of cognitive function among older adults. Further prospective studies need to confirm our results on the role of leptin and obesity in shaping cognitive function and dementia.
Funding
This work was supported by the National Institute on Aging (R01 AG026720 and K24 AG031155) and the Alzheimer’s Association (IIRG-08-88872). The Study of Osteoporotic Fractures (SOF) is supported by National Institutes of Health funding. The National Institute on Aging provides support under the following grant numbers: R01 AG005407, R01 AR35582, R01 AR35583, R01 AR35584, R01 AG005394, R01 AG027574, R01 AG027576, and R01 AG026720. Dr. Zeki Al Hazzouri was supported by the American Heart Association/American Stroke Association/American Brain Foundation Lawrence M. Brass, MD, Stroke Research Postdoctoral Fellowship.
References
- 1. Dewey ME, Saz P. Dementia, cognitive impairment and mortality in persons aged 65 and over living in the community: a systematic review of the literature. Int J Geriatr Psychiatry. 2001;16(8):751 761 [DOI] [PubMed] [Google Scholar]
- 2. Hendrie HC. Epidemiology of dementia and Alzheimer's disease. Am J Geriatr Psychiatr. 1998;6(2Suppl1):S3–S18 [DOI] [PubMed] [Google Scholar]
- 3. Beydoun MA, Beydoun HA, Wang Y. Obesity and central obesity as risk factors for incident dementia and its subtypes: a systematic review and meta-analysis. Obesity Rev. 2008;9(3):204 218 [DOI] [PMC free article] [PubMed] [Google Scholar]
- 4. Whitmer RA, Gunderson EP, Barrett-Connor E, Quesenberry CP, Jr., Yaffe K. Obesity in middle age and future risk of dementia: a 27 year longitudinal population based study. BMJ. 2005;330(7504):1360 [DOI] [PMC free article] [PubMed] [Google Scholar]
- 5. Whitmer RA, Gunderson EP, Quesenberry CP, Jr., Zhou J, Yaffe K. Body mass index in midlife and risk of Alzheimer disease and vascular dementia. Curr Alzheimer Res. 2007;4(2):103 109 [DOI] [PubMed] [Google Scholar]
- 6. Whitmer RA, Gustafson DR, Barrett-Connor E, Haan MN, Gunderson EP, Yaffe K. Central obesity and increased risk of dementia more than three decades later. Neurology. 2008;71(14):1057 1064 [DOI] [PubMed] [Google Scholar]
- 7. Wannamethee SG, Shaper AG, Lennon L, Whincup PH. Decreased muscle mass and increased central adiposity are independently related to mortality in older men. Am J Clin Nutr. 2007;86(5):1339 1346 [DOI] [PubMed] [Google Scholar]
- 8. Zafon C. Oscillations in total body fat content through life: an evolutionary perspective. Obesity Rev. 2007;8(6):525 530 [DOI] [PubMed] [Google Scholar]
- 9. Baumgartner RN. Body composition in healthy aging. Ann NY Acad Sci. 2000;904:437 448 [DOI] [PubMed] [Google Scholar]
- 10. Luchsinger JA, Patel B, Tang MX, Schupf N, Mayeux R. Measures of adiposity and dementia risk in elderly persons. Arch Neurol. 2007;64(3):392 398 [DOI] [PMC free article] [PubMed] [Google Scholar]
- 11. Elmquist JK, Maratos-Flier E, Saper CB, Flier JS. Unraveling the central nervous system pathways underlying responses to leptin. Nat Neurosci. 1998;1(6):445 450 [DOI] [PubMed] [Google Scholar]
- 12. Harvey J. Leptin: a multifaceted hormone in the central nervous system. Mol Neurobiol. 2003;28(3):245 258 [DOI] [PubMed] [Google Scholar]
- 13. Li XL, Aou S, Oomura Y, Hori N, Fukunaga K, Hori T. Impairment of long-term potentiation and spatial memory in leptin receptor-deficient rodents. Neuroscience. 2002;113(3):607 615 [DOI] [PubMed] [Google Scholar]
- 14. Shanley LJ, Irving AJ, Harvey J. Leptin enhances NMDA receptor function and modulates hippocampal synaptic plasticity. J Neurosci. 2001;21(24):RC186 [DOI] [PMC free article] [PubMed] [Google Scholar]
- 15. Farr SA, Banks WA, Morley JE. Effects of leptin on memory processing. Peptides. 2006;27(6):1420 1425 [DOI] [PubMed] [Google Scholar]
- 16. Fewlass DC, Noboa K, Pi-Sunyer FX, Johnston JM, Yan SD, Tezapsidis N. Obesity-related leptin regulates Alzheimer's Abeta. FASEB J. 2004;18(15):1870 1878 [DOI] [PubMed] [Google Scholar]
- 17. Harvey J, Solovyova N, Irving A. Leptin and its role in hippocampal synaptic plasticity. Prog Lipid Res. 2006;45(5):369 378 [DOI] [PMC free article] [PubMed] [Google Scholar]
- 18. Beydoun MA, Beydoun HA, Shroff MR, Kitner-Triolo MH, Zonderman AB. Serum leptin, thyroxine and thyroid-stimulating hormone levels interact to affect cognitive function among US adults: evidence from a large representative survey. Neurobiol Aging. 2012; 33(8):1730–1743.. [DOI] [PMC free article] [PubMed] [Google Scholar]
- 19. Holden KF, Lindquist K, Tylavsky FA, Rosano C, Harris TB, Yaffe K. Serum leptin level and cognition in the elderly: findings from the Health ABC Study. Neurobiol Aging. 2009;30(9):1483 1489 [DOI] [PMC free article] [PubMed] [Google Scholar]
- 20. Lieb W, Beiser AS, Vasan RS, et al. Association of plasma leptin levels with incident Alzheimer disease and MRI measures of brain aging. JAMA. 2009;302(23):2565 2572 [DOI] [PMC free article] [PubMed] [Google Scholar]
- 21. Power DA, Noel J, Collins R, O’Neill D. Circulating leptin levels and weight loss in Alzheimer's disease patients. Dement Geriatr Cogn Disord. 2001;12(2):167 170 [DOI] [PubMed] [Google Scholar]
- 22. Raji CA, Ho AJ, Parikshak NN, et al. Brain structure and obesity. Hum Brain Mapp. 2010;31(3):353 364 [DOI] [PMC free article] [PubMed] [Google Scholar]
- 23. Considine RV, Sinha MK, Heiman ML, et al. Serum immunoreactive-leptin concentrations in normal-weight and obese humans. N Engl J Med. 1996;334(5):292 295 [DOI] [PubMed] [Google Scholar]
- 24. Arch JR. Central regulation of energy balance: inputs, outputs and leptin resistance. Proc Nutr Soc. 2005;64(1):39 46 [DOI] [PubMed] [Google Scholar]
- 25. Banks WA, Coon AB, Robinson SM, et al. Triglycerides induce leptin resistance at the blood-brain barrier. Diabetes. 2004;53(5):1253 1260 [DOI] [PubMed] [Google Scholar]
- 26. Cummings SR, Nevitt MC, Browner WS, et al. Risk factors for hip fracture in white women. Study of Osteoporotic Fractures Research Group. N Engl J Med. 1995;332(12):767 773 [DOI] [PubMed] [Google Scholar]
- 27. American Psychiatric Association. Diagnostic and Statistical Manual of Mental Disorders, Fourth Edition (DSM-IV) Washington, DC: : American Psychiatric Association;1994. [Google Scholar]
- 28. Petersen RC, Doody R, Kurz A, et al. Current concepts in mild cognitive impairment. Arch Neurol. 2001;58(12):1985 1992 [DOI] [PubMed] [Google Scholar]
- 29. Yaffe K, Middleton LE, Lui LY, et al. Mild cognitive impairment, dementia, and their subtypes in oldest old women. Arch Neurol. 2011;68(5):631 636 [DOI] [PMC free article] [PubMed] [Google Scholar]
- 30. Lyness JM, Noel TK, Cox C, King DA, Conwell Y, Caine ED. Screening for depression in elderly primary care patients. A comparison of the Center for Epidemiologic Studies-Depression Scale and the Geriatric Depression Scale. Arch Intern Med. 1997;157(4):449 454 [PubMed] [Google Scholar]
- 31. SAS statistical software, release 9.2. [computer program] Cary, NC: SAS Institute; 2005. [computer program] [Google Scholar]
- 32. Harvey J, Shanley LJ, O’Malley D, Irving AJ. Leptin: a potential cognitive enhancer?. Biochem Soc Trans. 2005;33(Pt5):1029 1032 [DOI] [PubMed] [Google Scholar]
- 33. Gerges NZ, Aleisa AM, Alkadhi KA. Impaired long-term potentiation in obese zucker rats: possible involvement of presynaptic mechanism. Neuroscience. 2003;120(2):535 539 [DOI] [PubMed] [Google Scholar]
- 34. Feng GS. Shp2 as a therapeutic target for leptin resistance and obesity. Expert Opin Ther Targets. 2006;10(1):135 142 [DOI] [PubMed] [Google Scholar]
- 35. Steinberg GR, McAinch AJ, Chen MB, et al. The suppressor of cytokine signaling 3 inhibits leptin activation of AMP-kinase in cultured skeletal muscle of obese humans. J Clin Endocrinol Metabol. 2006;91(9):3592 3597 [DOI] [PubMed] [Google Scholar]
- 36. Myers MG, Cowley MA, Munzberg H. Mechanisms of leptin action and leptin resistance. Annu Rev Physiol. 2008;70:537 556 [DOI] [PubMed] [Google Scholar]
- 37. Chen K, Li F, Li J, et al. Induction of leptin resistance through direct interaction of C-reactive protein with leptin. Nat Med. 2006;12(4):425 432 [DOI] [PubMed] [Google Scholar]
- 38. Gustafson D, Rothenberg E, Blennow K, Steen B, Skoog I. An 18-year follow-up of overweight and risk of Alzheimer disease. Arch Intern Med. 2003;163(13):1524 1528 [DOI] [PubMed] [Google Scholar]
- 39. West NA, Haan MN. Body adiposity in late life and risk of dementia or cognitive impairment in a longitudinal community-based study. J Gerontol A Biol Sci Med Sci. 2009;64(1):103 109 [DOI] [PMC free article] [PubMed] [Google Scholar]
- 40. Fitzpatrick AL, Kuller LH, Lopez OL, et al. Midlife and late-life obesity and the risk of dementia: cardiovascular health study. Arch Neurol. 2009;66(3):336 342 [DOI] [PMC free article] [PubMed] [Google Scholar]