Abstract
Until recently the left atrium had been subordinate to the left ventricle, but cardiologists now recognize that left atrial (LA) function is indispensable to normal circulatory performance. Transthoracic two-dimensional (2D) and Doppler echocardiography can elucidate parameters of LA function non-invasively. Yet, with the advent of 2D speckle-tracking echocardiography, we are able to detect early LA dysfunction even before structural changes occur. This is pivotal in some common disease states, such as atrial fibrillation, hypertension, and heart failure, in which LA deformation parameters can influence clinical management. However, a unique standardized technique to investigate LA deformation needs to be validated.
Keywords: Left atrium, Mechanics, Strain, Electromechanical coupling
Introduction
Estimates of left atrial (LA) function can be obtained by two-dimensional (2D) echocardiography as well as Doppler analysis of the transmitral and pulmonary vein flow and tissue Doppler assessment of LA myocardial velocities. However, quantification of LA function remains a challenge. Evaluation of LA deformation parameters is a new promising approach for analyses of phasic LA mechanics and electromechanical coupling. Early detection of LA dysfunction is anticipated to provide new insight into pathophysiology and clinical management of several conditions such as atrial fibrillation (AF), hypertension, heart failure (HF), and valvular heart disease, in which atrial dysfunction has been identified and considered to some extent to be contributory.
Left atrial anatomy
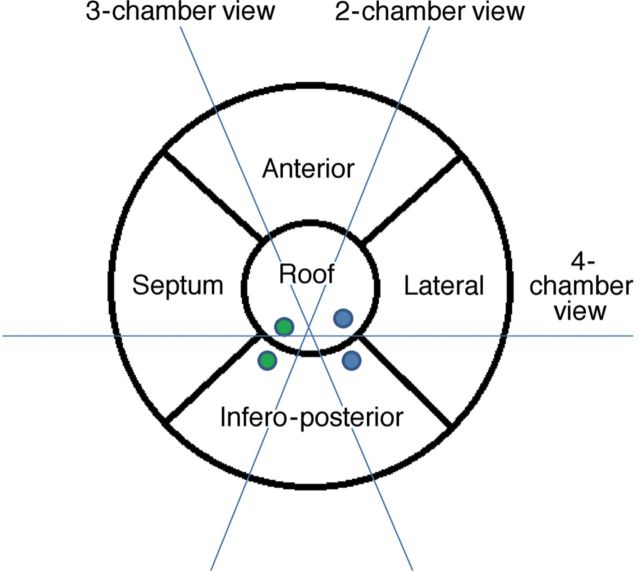
The LA cavity is located in the mediastinum, oriented leftward and posterior to the right atrium (RA). LA structure is characterized by a pulmonary venous component, a lateral finger-like appendage, an inferior vestibular component, which surrounds the mitral valve orifice, and a prominent body that shares the septum with the RA. The pulmonary venous component with venous orifices at each corner is situated posteriorly and superiorly, and directly confluent with the body.1 The walls of the LA can be described as superior (roof), posterior (infero-posterior), left lateral, septal, and anterior, as suggested by McAlpine2 (Figure 1). The majority of the atrium is relatively smooth, whereas the appendage is rough with pectinate muscles. The walls are composed of one or more overlapping layers of differently aligned myocardial fibres, with marked regional variations in thickness.3 Circular fibres are more or less parallel to the atrioventricular valve plane, whereas longitudinal fibres run nearly perpendicularly. Oblique fibres are those inclined between the two major axes.4
Figure 1.
Proposal of a five-segment model for left atrial segmentation by transthoracic two-dimensional echocardiography: The apical four-chamber view cuts the heart obliquely from the apex of the left ventricle. Conventionally, the interatrial septum is situated medially and the lateral wall on the opposite side, inferiorly the mitral annulus and superiorly the roof. The anterior and infero-posterior walls can be visualized in the apical two-chamber view. Only the infero-posterior wall can be observed, facing the aorta, in a three-chamber view. The green and blue solid dots represent right and left pulmonary veins (upper and lower), respectively.
Electrical impulse pathway
Electrical impulse propagation occurs through interatrial connections in the subepicardium of the LA; the most prominent, Bachmann's bundle, runs anteriorly across the interatrial grove. This and other connections, including along the coronary sinus musculature and posterior conducting bridges, all join the LA and RA electrically.1 This results in atrial electrical activation from the lateral RA wall through the interatrial septum to the inferior, anterior, and lateral LA walls during sinus rhythm. Changes in these conducting tracts can abolish or prolong interatrial conduction, and may create a substrate for AF.3,4
Left atrial size assessment
Left atrial size correlates with both LA and left ventricular (LV) function, and is a strong predictor of cardiovascular death and morbidity. The antero-posterior diameter, calculated with M-mode or 2D echocardiography, is no longer considered as adequately representative of the true LA dimension. For these reasons, the American Society of Echocardiography, in conjunction with the European Association of Echocardiography, recommends the measurement of LA volumes with either an ellipsoid model or the Simpson's method in four- and two-chamber apical views.5 Conventional echocardiography allows measurement of all LA volumes.
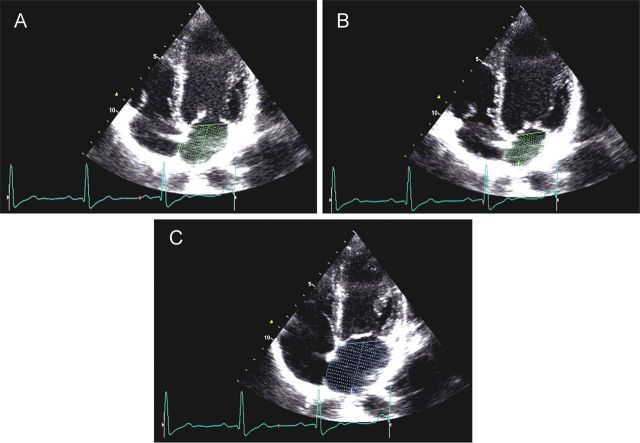
LA passive volumes consist of (Figure 2):
Preatrial contraction volume (VpreA), measured at the onset of the P-wave on an electrocardiogram (ECG);
Minimal LA volume (Vmin), measured at the closure of the mitral valve in end-diastole; and
Maximal LA volume (Vmax), measured just before the opening of the mitral valve in end-systole.
Figure 2.
Preatrial contraction volume (VpreA), measured at the onset of the P-wave on an electrocardiogram (A); minimal left atrial (LA) volume (Vmin), measured at the closure of the mitral valve in end diastole (B); and maximal LA volume (Vmax), measured just before the opening of the mitral valve in end-systole (C).
LA active volumes are:
LA reservoir volume (Vmax− Vmin)
LA conduit volume (LV total stroke volume− LA reservoir volume)
LA passive emptying volume (Vmax− VpreA)
LA contractile volume (VpreA− Vmin)
Left atrial function through the cardiac cycle: the atrial perspective
During the cardiac cycle, the LA acts as a reservoir, receiving pulmonary venous return during LV systole; as a conduit, passively transferring blood to the LV during early diastole; and as a pump, actively priming the LV in late diastole. In normal subjects, the reservoir, passive conduit, and pumping phases account for ∼40, 35, and 25%, of the atrial contribution to stroke volume, respectively.6
LV mechanical events occurring during the LA reservoir period, from mitral valve closure to opening, are isovolumic contraction (IVC), ejection, and isovolumic relaxation (IVR). The LA reservoir phase is essential for LV filling because the energy stored by the LA during ventricular systole is released after mitral valve opening, greatly contributing to LV stroke volume.7 The LA conduit phase spans early LV filling and diastasis. LA contractile phase performance depends on preload, afterload, intrinsic contractility, and electromechanical coupling. Echocardiography has become the established method for non-invasive evaluation of this triphasic nature.
Electromechanical coupling in normal subjects: non-invasive assessment
LA pump function depends on atrial electrical activation and electromechanical coupling. The latter is defined as the time between the onset of electrical and mechanical activation. The first attempt to perform non-invasive assessment of inter- and intra-atrial electromechanical delays (EMD) was carried out using one-dimensional echocardiography.8 Ultimately, pulsed-wave tissue Doppler echocardiography proved effective for assessing the atrial contraction sequence. Using this technique, atrial EMD is defined as the interval between the P-wave on ECG and onset of the late-diastolic wave (A′) (expression of LA mechanical activation).
The feasibility of non-invasive echocardiographic assessment of electromechanical coupling has been demonstrated by several investigators. Quintana et al.9 evaluated LA electromechanical coupling through tissue velocity echocardiography by determining several intervals (Figure 3):
p-Astart interval (from the onset of the P-wave to the onset of A′)
p-Apeak interval (from the onset of the P-wave to the peak of A′)
total electromechanical time (from the onset of the P-wave to the end of A′)
Figure 3.
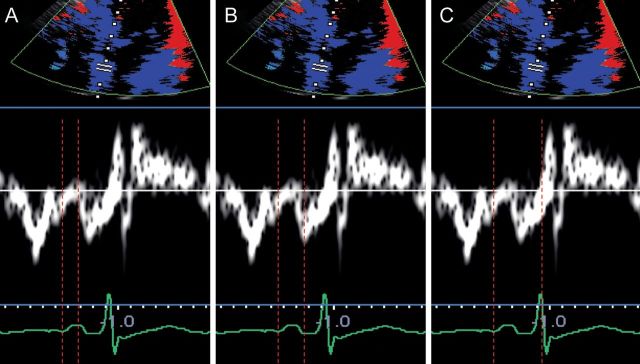
Left atrial electromechanical intervals measured through tissue Doppler imaging: p-A start interval, measured from the onset of the P-wave to the onset of A′ (A); p-Apeak interval, measured from the onset of the P-wave to the peak of A′ (B); total electromechanical time, measured from the onset of the P-wave to the end of A′ (C).
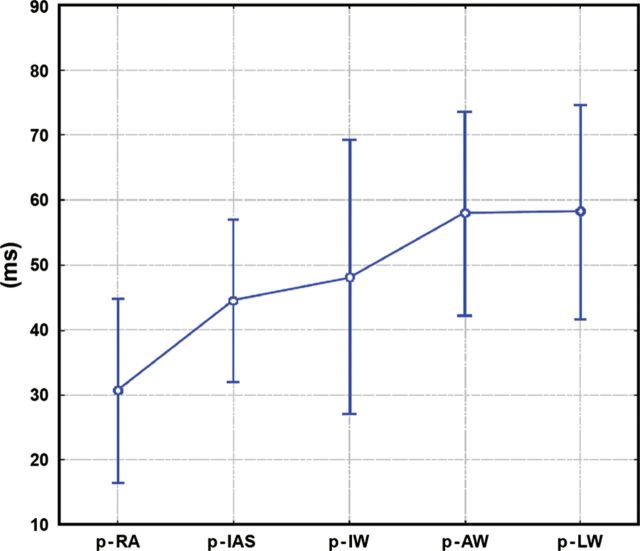
The p-Astart interval was shorter in the RA than for all LA walls (interatrial delay). Moreover, within the LA wall, p-Apeak interval was significantly shorter in the interatrial septum than in the anterior and lateral walls, as expected according to normal wavefront propagation. Dabrowska-Kugacka et al.4 demonstrated that, despite a homogenous onset of atrial mechanical wall motion, the contraction of the lateral LA wall was delayed when compared with the anterior and inferior LA walls (Figure 4).
Figure 4.
Atrial electromechanical sequence during sinus rhythm in a control group. Graph represents mean values ± standard deviation and 95% confidence interval. Interatrial dyssynchrony is defined as the absolute value of time difference between p-LW and p-RA; Intra-left atrial dyssynchrony is defined as the maximal time difference among p-LW, p-IW, p-AW, and p-IAS; Intra-right atrial dyssynchrony is defined as the absolute value of time difference between p- RA and p-IAS. p-RA, p-IAS, p-IW, p-AW, p-LW: time distance from the atrial pacing spike (p) till the beginning of the A′-wave assessed by pulsed-wave tissue Doppler echocardiography in the middle of the lateral right atrial wall and the middle of the interatrial septum, inferior, anterior, and lateral left atrial walls, respectively. (Reproduced from Ref.4 with permission from John Wiley and Sons.)
Strain and strain rate techniques: assessment of regional left atrial deformation in normal subjects
Although pulsed-wave tissue Doppler echocardiography is affected by myocardial tethering and acquisition angle, strain and strain rate (SR) imaging have been proposed as novel non-invasive echocardiographic techniques to quantify regional myocardial function independent of tethering. Strain represents myocardial deformation, whereas SR represents the speed at which myocardial deformation occurs (expressed in s−1).
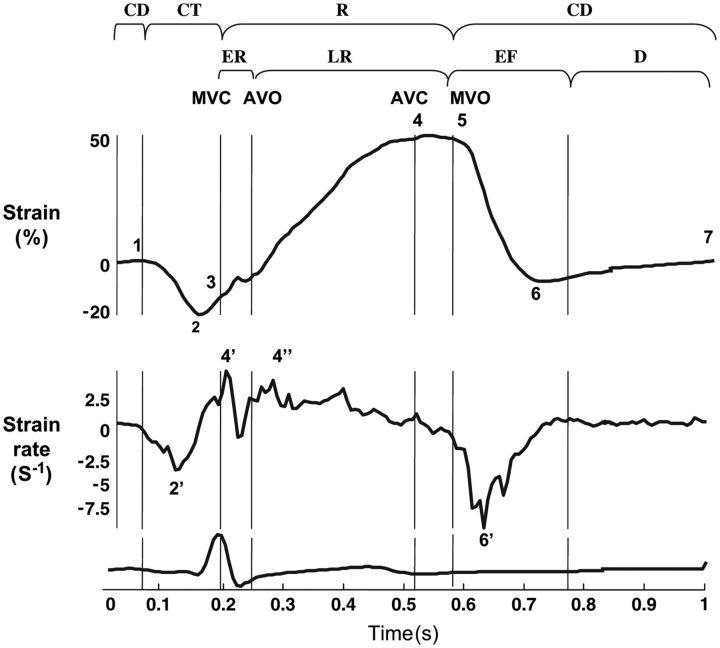
Myocardial shortening during the LA contractile phase results in SR values that are negative (Figures 5 and 6).7 Alternatively, strain and SR values during the reservoir phase are positive due to LA chamber dilatation and wall stretch (Figures 5 and 6). In the SR profile (Figures 5 and 6), two peaks subdivide the LA reservoir period into two phases: early, corresponding to the IVC period, and late, during the ejection and IVR periods.
Figure 5.
Extracted strain rate (SR) profiles for left atrial wall longitudinal deformation. MCV, mitral valve closure; AVO, aortic valve opening; AVC, aortic valve closure; MVO, mitral valve opening; CT, contractile period (1, onset; 2, peak ε; 2′, peak SR; 3, end); R, reservoir period (3, onset; 4, peak ε; 5, end); ER, early reservoir period (4′, peak SR); LR, late reservoir period (4″, peak SR); CD, conduit period (5, onset; 6, peak ε; 6′, peak SR; 7, end of LA wall deformation during diastasis); EF, early ventricular filling; D, diastasis. (Reproduced from Ref. 7 with permission from Oxford University Press.)
Figure 6.
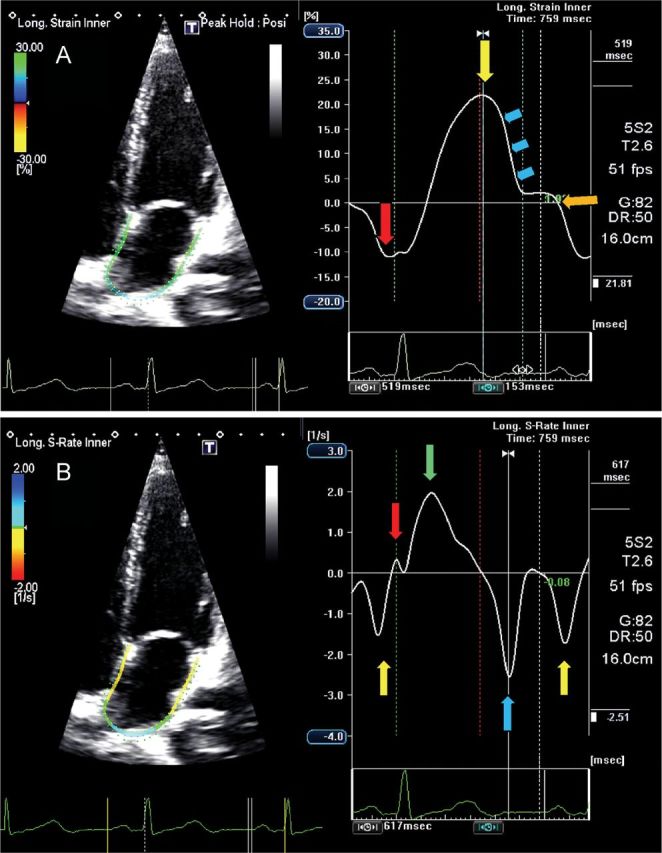
Four-chamber view showing global left atrial (LA) longitudinal strain (A) and strain rate (B) in a normal subject. The trigger is before the P-wave on the electrocardiogram. (A) The negative peak of the contractile phase (red arrow), the positive peak of the reservoir phase (yellow arrows) and the conduit phase, which includes early diastole (blue arrows) and diastases (orange arrow). (B) The peak of the LA contractile phase in late diastole (yellow arrow), the early (red arrow) and late peak (green arrow) of the reservoir phase during ventricular systole, and the conduit phase in early diastole (blue arrow).
The early peak largely reflects LA compliance, whereas the late peak occurs during LV ejection, suggesting a close correlation between reservoir function and the mitral annular descent from the cardiac base to the apex. Wakami et al.10 confirmed this hypothesis, finding a significant positive correlation between peak LA strain and LV systolic longitudinal strain. LA conduit function is dependent on LV relaxation and preload. The transfer of blood to the LV is accompanied by LA myocardium shortening, resulting in negative SR values (Figures 5 and 6). During diastasis, LA wall deformation ends and both the strain and SR profiles plateau (Figures 5 and 6). Regional LA analysis, conveyed through standard 15- or 12-segment models,11–15suggests significant regional differences for strain and SR values, though controversy remains (Figure 7A and B).11,12 Sirbu et al.7 observed the lowest SR peak values and significantly longer time-to-peak SR values in the inferior wall. Others have demonstrated maximum absolute values of strain and SR in the annular regions of the inferior wall and lowest values in the roof, where the heart is anchored to the mediastinum (Figure 7C and D).6
Figure 7.
Two-dimensional echocardiography apical four-chamber view (A) and apical two-chamber view (B) showing left atrial longitudinal strain in a normal subject. Longitudinal strain during the reservoir phase in the roof segment (C, pink line) shows lower absolute values when compared with the annular segment of the inferior wall (D, brown line).
Clinical application of two-dimensional speckle-tracking echocardiography
Electromechanical delay assessment through atrial longitudinal strain
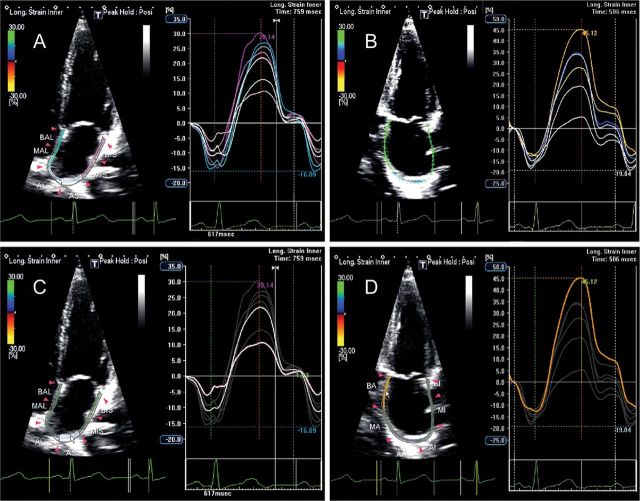
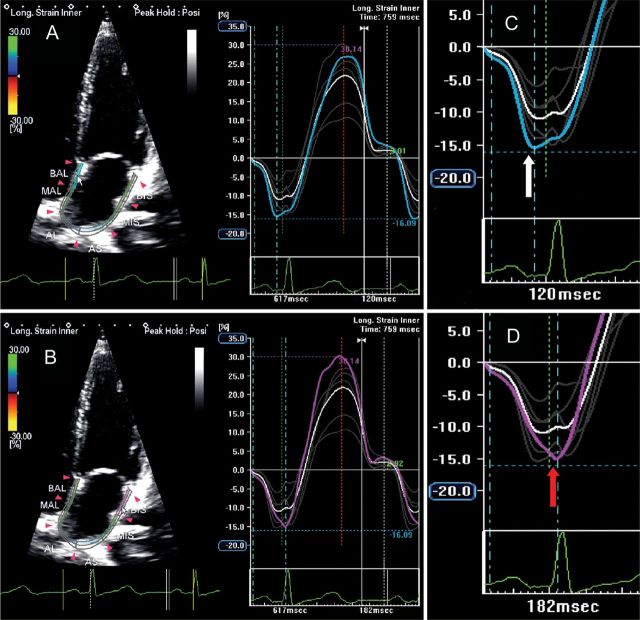
LA electromechanical coupling can be non-invasively evaluated through 2D speckle-tracking echocardiography by measuring the time from onset of the P-wave to the negative peak of the global longitudinal strain curve (Figure 8). Additionally, LA dyssynchrony can be assessed by measuring the delay between peak negative activation of the septum and lateral wall (Figure 9).
Figure 8.
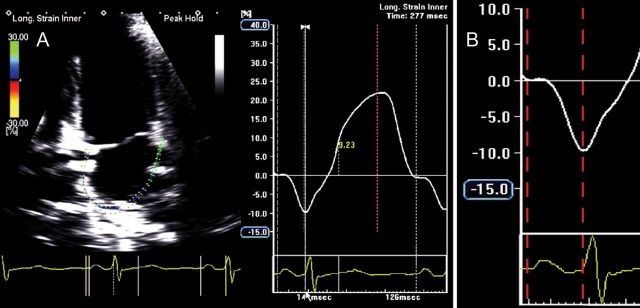
Global left atrial (LA) longitudinal strain (A) and detail of global LA longitudinal strain during the contractile phase (B) showing an atrial electromechanical delay of 126 ms, measured from the onset of the P-wave to the negative peak of the curve, in a normal subject. (Time interval depicted between the two red dotted lines.)
Figure 9.
Two-dimensional echocardiography apical four-chamber view showing left atrial longitudinal strain in a normal subject: the blue line (A) and the purple line (B) represent mechanical deformation of the interatrial septum and the lateral wall. As expected, the negative peak of interatrial septum (C, white arrow) occurs before the negative peak of lateral wall (D, red arrow), showing a delay of 60 ms between the two peaks.
Clinical application of electromechanical delay assessment
Common cardiovascular diseases, including HF,16 mitral stenosis,17 diabetes,18 obstructive sleep apnoea,19 and hypertension,20,21 particularly in association with diastolic dysfunction, are characterized by longer atrial electromechanical coupling, inter- and intra-atrial EMD measured with tissue Doppler imaging, and greater P-wave dispersion, which are well-known electrophysiological characteristics of the atria prone to fibrillation (Figure 10).
Figure 10.
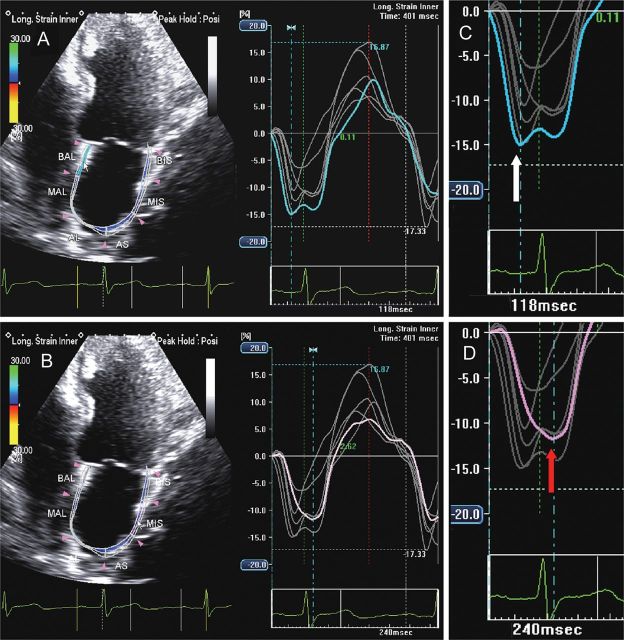
Two-dimensional echocardiography apical four-chamber view showing left atrial longitudinal strain in a patient with heart failure and P-wave prolongation: the blue line (A) and the purple line (B) represent mechanical deformation of the interatrial septum and the lateral wall. The negative peak of the interatrial septum (C, white arrow) occurs before the negative peak of the lateral wall (D, red arrow), but a prolonged intra-atrial electromechanical delay is demonstrated by an interval of 122 ms occurring between the two peaks.
From a purely mechanical perspective, LA dyssynchrony results in discordant activation. As a consequence, even with normal atrioventricular conduction, ventricular systole begins before completion of the LA contraction, resulting in aborted LA emptying, reduction in LV filling and stroke volume, and increased LA and pulmonary capillary wedge pressures. Thus, HF can result as a direct consequence of atrial dyssynchrony, and increased LA pressure related to this mechanism can secondarily lead to AF. Various atrial pacing techniques avoiding delayed intra-atrial conduction have demonstrated their ability to improve atrial electromechanical function, especially in patients with sinus rhythm, P-wave prolongation on ECG, and HF symptoms.4 Atrial resynchronization by anticipating LA activation could be considered a new therapeutic option for HF patients with demonstrated atrial dyssynchrony and aborted LA emptying.
Left atrial mechanics in common disease states
Left atrial mechanics and heart failure with preserved systolic function
An inverse relationship between both reservoir and conduit functions and Doppler parameters of LV diastolic dysfunction22 and LV end-diastolic pressure has been demonstrated in patients with HF.10
LA pump function presents a biphasic response: in early HF it is augmented to compensate for reduced early LV filling, whereas in late stages, as work mismatch progresses, LA contractile properties gradually deteriorate.7 LA longitudinal strain and stiffness are the most accurate indexes of diastolic HF and correlate with worse New York Heart Association functional class.22 These data suggest that the decrease in LA compliance expressed by a reduction in reservoir function might occur before structural remodelling, allowing identification of LV diastolic dysfunction in subjects with preserved ejection fraction earlier than overt structural changes (Figure 11).
Figure 11.
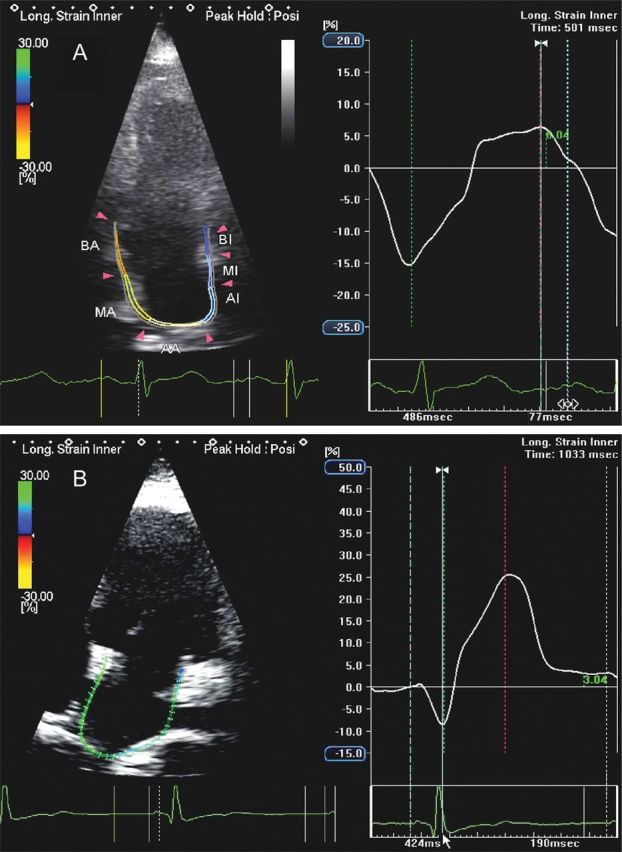
Apical four-chamber view in a patient with heart failure showing a severe reduction in left atrial (LA) reservoir function and a compensatory increase in LA contractile function (A) when compared with a normal subject (B).
Left atrial mechanics and hypertension
In 2007, Kokubu et al.23 reported that LA strain and SR values were lower in patients with hypertension when compared with normal subjects, irrespective of the presence of LA enlargement or LV hypertrophy. Moreover, deformation parameters tended to normalize after renin–angiotensin system inhibition, indicating a therapeutic effect on LA function. The pathophysiology of LA dysfunction in a hypertensive heart is attributed to elevated pressure to which the LA is chronically exposed during ventricular diastole, leading to a rise in LA pressure and a reduction in reservoir and conduit functions.12 In early hypertensive heart disease, LA stretching causes a temporary enhancement of LA pump function, which is necessary to maintain adequate ventricular filling. When compliance is lost and stiffness increases, eventually LA contractility suffers. According to the stage of the disease and the entity of organ damage, LA mechanics in hypertension can be depressed in all the three phases or characterized by a temporary augmentation of LA pump performance, especially during the earlier phases of the disease (Figure 12). When other comorbidities such as diabetes co-exist in the same patient, LA strain, and SR parameters during reservoir and conduit periods are further reduced, even in the presence of the normal LA size.24 When compared with normal age-matched controls and to a group of subjects with physiological hypertrophy, hypertensive patients experience reductions in strain and SR values in all three phases of atrial function, proportional to their exercise capacity.
Figure 12.
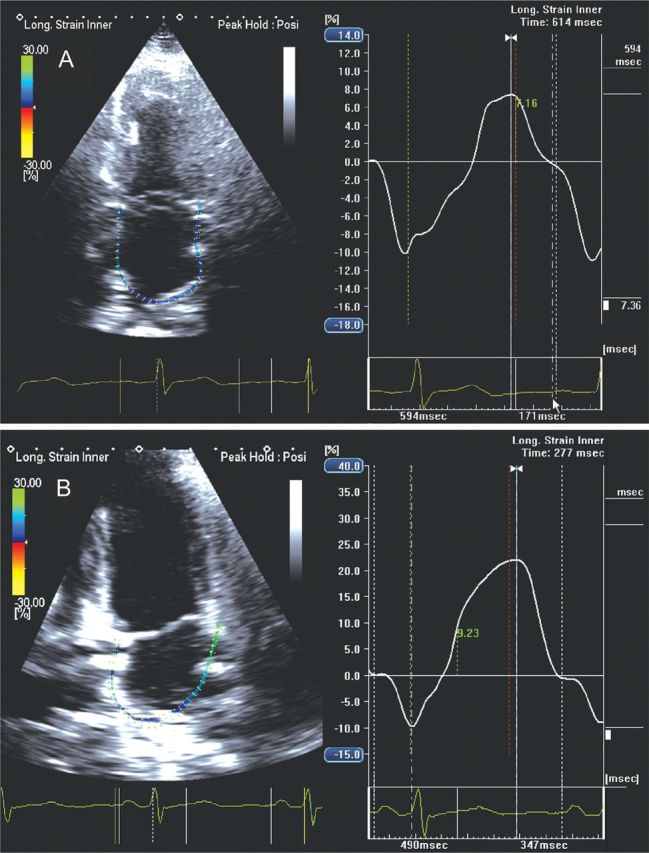
Apical four-chamber view in a hypertensive patient showing global left atrial (LA) longitudinal strain at initial state of the disease with a reduction in LA reservoir function (A) when compared with a normal subject (B) (7.36 vs. 21.99%).
Left atrial mechanics and atrial fibrillation
During AF, LA contractile function is lost while both reservoir and conduit functions are reduced, with demonstrable differences between paroxysmal and chronic persistent AF. The close correlation between LA stiffness and LA reservoir function can explain why an inverse relationship exists between LA structural and functional remodelling with a larger amount of LA fibrosis associated with lower values of mid-sagittal and mid-lateral wall strain, especially in patients with chronic AF.25
After cardioversion, strain and SR, as well as conventional parameters linked to atrial contractile function, are reduced due to LA stunning.26 Thomas et al.14 demonstrated a gradual recovery of atrial strain after cardioversion, with peak improvement within 4 weeks; in contrast, time-to-peak strain, which is typically prolonged in patients with AF, did not always normalize after cardioversion, indicating persistent atrial dysfunction despite restoration of sinus rhythm.
Schneider et al.27 studied a group of patients with both paroxysmal and chronic persistent AF before and after cardioversion; most of the patients that maintained sinus rhythm during a follow-up of 3 months had paroxysmal AF and showed good LA reverse remodelling expressed by higher strain values when compared with patients in whom AF recurred. Moreover, global LA strain has an incremental value when combined with CHADS2 risk score and indexed LA volume in the assessment of the burden of death and future hospitalization for cardiac causes.28 Average values of LA systolic strain and SR at baseline are now considered independent predictors of LA reverse remodelling and AF recurrence, with considerable implication in the management of antiarrhythmic drugs and in the selection of candidates for anticoagulant therapy.14 Further studies are needed to determine the independent prognostic power of atrial strain as a predictor of future cardiovascular events.
Left atrial mechanics and valvular heart disease
Aortic stenosis
In aortic stenosis, LA enlargement and dysfunction adversely affect outcomes. Some investigators29,30 studied the impact of aortic stenosis on LA phasic function and reported that all LA longitudinal strain values were reduced, and that LA booster pump function was particularly affected by the severity of aortic stenosis.
Mitral regurgitation
Increased LA volume overload in chronic mitral regurgitation (MR) causes remodelling and LA dilation. Higher values of LA strain in all phases of LA function along with elevated static and dynamic LA volumes have been demonstrated.31 However, others have observed a continuum of abnormalities affecting the LA and, in the latest stages of the disease, a deterioration of all LA deformation parameters.32 MR patients with a history of recurrent AF showed lower strain values when compared with patients affected by the same degree of MR without AF recurrence.33
Mitral stenosis
Atrial myocardial velocities and deformation indices are significantly compromised in patients with mitral stenosis, proportional to the severity of the disease. Moreover, a multivariate analysis showed that LA peak systolic SR average was the best predictor of adverse events in 3-year follow up.34
Future directions
3D echocardiographic methods for the analysis of left atrial shape and function
Real-time 3D echocardiography is a non-invasive imaging method for the analysis of LA shape, volume, and function that allows the evaluation of strain and volume changes, frame by frame, simultaneously from 3D images.35 In addition, 3D speckle-tracking echocardiography is becoming a clinical reality and is expected to extend the clinical armamentarium of spatial analyses of regional and global LA strains.
Echocardiographic particle image velocimetry for velocity vector field analysis
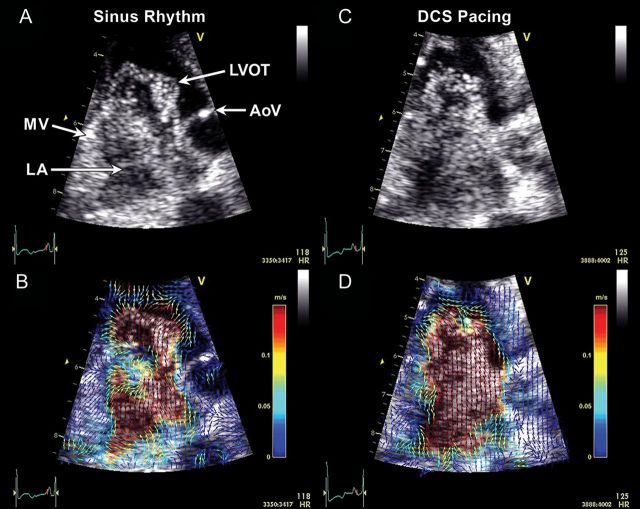
Echocardiographic particle image velocimetry (PIV)36 tracks the position of acoustic signatures from contrast microbubbles in the cardiovascular system, thus allowing local fluid dynamic assessments under various conditions and after therapeutic interventions.37 Our experience suggests that it affords new insights into LA physiology and distinguishes between various states, suggesting a role in early detection of disease states and responses to therapy (Figure 13, Supplementary data online, Videos S1 and S2). Future directions include establishing practical, quantitative parameters that measure changes in velocity vector fields of the blood flow and non-invasively provide new physiological information about the cardiac haemodynamic status, such as local flow pressure gradients or stresses. Multidimensional imaging with high temporal resolution will be needed to completely elucidate the complexity of haemodynamic patterns.
Figure 13.
Examples of left atrial (LA) microbubble contrast (A and C) and corresponding echocardiographic particle image velocimetry (PIV) (B and D) obtained in a three-chamber view. In sinus rhythm, a clockwise-rotating vortex within the LA followed by a strong early (i.e. before the P-wave) transmitral filling jet are visible (A, Supplementary data online, Video S1), and enhanced with colour-coded vector field depictions through PIV analysis (B, Supplementary data online, Video S2). During distal coronary sinus (DCS) pacing, which activates the LA in the opposite direction, the LA vortex appears to rotate in a counterclockwise direction compared with sinus rhythm. A strong early filling jet was not apparent and the majority of the transmitral filling flow appeared following the DCS stimulus (C, Supplementary data online, Video S2). PIV graphically depicts the direction and magnitude of velocities across the flow field (D, Supplementary data online, Video S2). A clockwise-rotating vortex also can be seen in the left ventricular outflow tract (LVOT) prior to ventricular ejection in both examples. AoV, aortic valve; MV, mitral valve.
Conclusion
Non-invasive echocardiography is rapidly advancing toward a clinically feasible method of choice for the quantitative analysis of LA mechanics in two or more dimensions. With the advent of echocardiographic PIV and methods for tracking of LA regional and global wall motion, echocardiography soon could provide a suite of experimental investigative and clinical diagnostic tools for the determination of LA morphological, electromechanical, and fluid-dynamic interactions.
Supplementary data
Supplementary data are available at European Heart Journal – Cardiovascular Imaging online.
Funding
A.J. is partially supported by National Heart Lung and Blood Institute grants (R01HL101240-04, R01HL089542-04).
Conflict of interest: none declared.
Supplementary Material
Acknowledgements
The authors gratefully acknowledge Barbara Danek, Joe Grundle, and Katie Klein of Aurora Cardiovascular Services for the editorial preparation of the manuscript, and Brian Miller and Brian Schurrer of Aurora Sinai Medical Center for their help in preparing figures. We also thank Eileen McMahon, PhD, of Mayo Clinic-Arizona for generating the echocardiographic particle image velocimetry video clips using a PIVlab—Time-Resolved Digital Particle Image Velocimetry Tool for MATLAB.
References
- 1.Ho SY, Anderson RH, Sánchez-Quintana D. Atrial structure and fibres: morphologic bases of atrial conduction. Cardiovasc Res. 2002;54:325–36. doi: 10.1016/s0008-6363(02)00226-2. [DOI] [PubMed] [Google Scholar]
- 2.McAlpine WA. Heart and Coronary Arteries: an Anatomical Atlas for Clinical Diagnosis, Radiological Investigation, and Surgical Treatment. Verlag, Berlin: Springer; 1975. pp. 58–9. [Google Scholar]
- 3.Markides V, Schilling RJ, Ho SY, Chow AW, Davies DW, Peters NS. Characterization of left atrial activation in the intact human heart. Circulation. 2003;107:733–9. doi: 10.1161/01.cir.0000048140.31785.02. [DOI] [PubMed] [Google Scholar]
- 4.Dabrowska-Kugacka A, Lewicka-Nowak E, Ruciński P, Zagozdzon P, Raczak G, Kutarski A. Atrial electromechanical sequence and contraction synchrony during single- and multisite atrial pacing in patients with brady-tachycardia syndrome. Pacing Clin Electrophysiol. 2009;32:591–603. doi: 10.1111/j.1540-8159.2009.02332.x. [DOI] [PubMed] [Google Scholar]
- 5.Lang RM, Bierig M, Devereux RB, Flachskampf FA, Foster E, Pellikka PA, et al. Recommendations for chamber quantification: a report from the American Society of Echocardiography's guidelines and standards committee and the chamber quantification writing group, developed in conjunction with the European Association of Echocardiography, a branch of the European Society of Cardiology. J Am Soc Echocardiogr. 2005;18:1440–63. doi: 10.1016/j.echo.2005.10.005. [DOI] [PubMed] [Google Scholar]
- 6.Cianciulli TF, Saccheri MC, Lax JA, Bermann AM, Ferreiro DE. Two-dimensional speckle tracking echocardiography for the assessment of atrial function. World J Cardiol. 2010;2:163–70. doi: 10.4330/wjc.v2.i7.163. [DOI] [PMC free article] [PubMed] [Google Scholar]
- 7.Sirbu C, Herbots L, D'hooge J, Claus P, Marciniak A, Langeland T, et al. Feasibility of strain and strain rate imaging for the assessment of regional left atrial deformation: a study in normal subjects. Eur J Echocardiogr. 2006;7:199–208. doi: 10.1016/j.euje.2005.06.001. [DOI] [PubMed] [Google Scholar]
- 8.Wang K, Xiao HB, Fujimoto S, Gibson DG. Atrial electromechanical sequence in normal subjects and patients with DDD pacemakers. Br Heart J. 1995;74:403–7. doi: 10.1136/hrt.74.4.403. [DOI] [PMC free article] [PubMed] [Google Scholar]
- 9.Quintana M, Lindell P, Saha SK, del Furia F, Lind B, Govind S, et al. Assessment of atrial regional and global electromechanical function by tissue velocity echocardiography: a feasibility study on healthy individuals. Cardiovasc Ultrasound. 2005;3:4. doi: 10.1186/1476-7120-3-4. [DOI] [PMC free article] [PubMed] [Google Scholar]
- 10.Wakami K, Ohte N, Asada K, Fukuta H, Goto T, Mukai S, et al. Correlation between left ventricular end-diastolic pressure and peak left atrial wall strain during left ventricular systole. J Am Soc Echocardiogr. 2009;22:847–51. doi: 10.1016/j.echo.2009.04.026. [DOI] [PubMed] [Google Scholar]
- 11.Vianna-Pinton R, Moreno CA, Baxter CM, Lee KS, Tsang TS, Appleton CP. Two-dimensional speckle-tracking echocardiography of the left atrium: feasibility and regional contraction and relaxation differences in normal subjects. J Am Soc Echocardiogr. 2009;22:299–305. doi: 10.1016/j.echo.2008.12.017. [DOI] [PubMed] [Google Scholar]
- 12.Cameli M, Caputo M, Mondillo S, Ballo P, Palmerini E, Lisi M, et al. Feasibility and reference values of left atrial longitudinal strain imaging by two-dimensional speckle tracking. Cardiovasc Ultrasound. 2009;7:6. doi: 10.1186/1476-7120-7-6. [DOI] [PMC free article] [PubMed] [Google Scholar]
- 13.Kim DG, Lee KJ, Lee S, Jeong SY, Lee YS, Choi YJ, et al. Feasibility of two-dimensional global longitudinal strain and strain rate imaging for the assessment of left atrial function: a study in subjects with a low probability of cardiovascular disease and normal exercise capacity. Echocardiography. 2009;26:1179–87. doi: 10.1111/j.1540-8175.2009.00955.x. [DOI] [PubMed] [Google Scholar]
- 14.Thomas L, McKay T, Byth K, Marwick TH. Abnormalities of left atrial function after cardioversion: an atrial strain rate study. Heart. 2007;93:89–95. doi: 10.1136/hrt.2006.088609. [DOI] [PMC free article] [PubMed] [Google Scholar]
- 15.Inaba Y, Yuda S, Kobayashi N, Hashimoto A, Uno K, Nakata T, et al. Strain rate imaging for noninvasive functional quantification of the left atrium: comparative studies in controls and patients with atrial fibrillation. J Am Soc Echocardiogr. 2005;18:729–36. doi: 10.1016/j.echo.2004.12.005. [DOI] [PubMed] [Google Scholar]
- 16.Cho GY, Jo SH, Kim MK, Kim HS, Park WJ, Choi YJ, et al. Left atrial dyssynchrony assessed by strain imaging in predicting future development of atrial fibrillation in patients with heart failure. Int J Cardiol. 2009;134:336–41. doi: 10.1016/j.ijcard.2008.08.019. [DOI] [PubMed] [Google Scholar]
- 17.Ozer N, Yavuz B, Can I, Atalar E, Aksöyek S, Ovünç K, et al. Doppler tissue evaluation of intra-atrial and interatrial electromechanical delay and comparison with P-wave dispersion in patients with mitral stenosis. J Am Soc Echocardiogr. 2005;18:945–8. doi: 10.1016/j.echo.2005.01.015. [DOI] [PubMed] [Google Scholar]
- 18.Acar G, Akcay A, Sokmen A, Ozkaya M, Guler E, Sokmen G, et al. Assessment of atrial electromechanical delay, diastolic functions, and left atrial mechanical functions in patients with type 1 diabetes mellitus. J Am Soc Echocardiogr. 2009;22:732–8. doi: 10.1016/j.echo.2009.03.028. [DOI] [PubMed] [Google Scholar]
- 19.Cagirci G, Cay S, Gulsoy KG, Bayindir C, Vural MG, Firat H, et al. Tissue Doppler atrial conduction times and electrocardiogram interlead P-wave durations with varying severity of obstructive sleep apnea. J Electrocardiol. 2011;44:478–82. doi: 10.1016/j.jelectrocard.2011.03.009. [DOI] [PubMed] [Google Scholar]
- 20.Elsherbiny IA. Arterial stiffness is associated with tissue Doppler atrial conduction times and P wave dispersion in hypertensive patients. Intern Med. 2012;51:147–53. doi: 10.2169/internalmedicine.51.6345. [DOI] [PubMed] [Google Scholar]
- 21.Eicher JC, Laurent G, Mathé A, Barthez O, Bertaux G, Philip JL, et al. Atrial dyssynchrony syndrome: an overlooked phenomenon and a potential cause of ‘diastolic’ heart failure. Eur J Heart Fail. 2012;14:248–58. doi: 10.1093/eurjhf/hfr169. [DOI] [PubMed] [Google Scholar]
- 22.Morris DA, Gailani M, Vaz Pérez A, Blaschke F, Dietz R, Haverkamp W, et al. Left atrial systolic and diastolic dysfunction in heart failure with normal left ventricular ejection fraction. J Am Soc Echocardiogr. 2011;24:651–62. doi: 10.1016/j.echo.2011.02.004. [DOI] [PubMed] [Google Scholar]
- 23.Kokubu N, Yuda S, Tsuchihashi K, Hashimoto A, Nakata T, Miura T, et al. Noninvasive assessment of left atrial function by strain rate imaging in patients with hypertension: a possible beneficial effect of renin-angiotensin system inhibition on left atrial function. Hypertens Res. 2007;30:13–21. doi: 10.1291/hypres.30.13. [DOI] [PubMed] [Google Scholar]
- 24.Mondillo S, Cameli M, Caputo ML, Lisi M, Palmerini E, Padeletti M, et al. Early detection of left atrial strain abnormalities by speckle-tracking in hypertensive and diabetic patients with normal left atrial size. J Am Soc Echocardiogr. 2011;24:898–908. doi: 10.1016/j.echo.2011.04.014. [DOI] [PubMed] [Google Scholar]
- 25.Kuppahally SS, Akoum N, Burgon NS, Badger TJ, Kholmovski EG, Vijayakumar S, et al. Left atrial strain and strain rate in patients with paroxysmal and persistent atrial fibrillation: relationship to left atrial structural remodeling detected by delayed-enhancement MRI. Circ Cardiovasc Imaging. 2010;3:231–9. doi: 10.1161/CIRCIMAGING.109.865683. [DOI] [PubMed] [Google Scholar]
- 26.Kaya EB, Tokgözoglu L, Aytemir K, Kocabas U, Tülümen E, Deveci OS, et al. Atrial myocardial deformation properties are temporarily reduced after cardioversion for atrial fibrillation and correlate well with left atrial appendage function. Eur J Echocardiogr. 2008;9:472–7. doi: 10.1016/j.euje.2007.07.003. [DOI] [PubMed] [Google Scholar]
- 27.Schneider C, Malisius R, Krause K, Lampe F, Bahlmann E, Boczor S, et al. Strain rate imaging for functional quantification of the left atrium: atrial deformation predicts the maintenance of sinus rhythm after catheter ablation of atrial fibrillation. Eur Heart J. 2008;29:1397–409. doi: 10.1093/eurheartj/ehn168. [DOI] [PubMed] [Google Scholar]
- 28.Saha SK, Anderson PL, Caracciolo G, Kiotsekoglou A, Wilansky S, Govind S, et al. Global left atrial strain correlates with CHADS2 risk score in patients with atrial fibrillation. J Am Soc Echocardiogr. 2011;24:506–12. doi: 10.1016/j.echo.2011.02.012. [DOI] [PubMed] [Google Scholar]
- 29.O'Connor K, Magne J, Rosca M, Piérard LA, Lancellotti P. Left atrial function and remodelling in aortic stenosis. Eur J Echocardiogr. 2011;12:299–305. doi: 10.1093/ejechocard/jer006. [DOI] [PubMed] [Google Scholar]
- 30.O'Connor K, Magne J, Rosca M, Piérard LA, Lancellotti P. Impact of aortic valve stenosis on left atrial phasic function. Am J Cardiol. 2010;106:1157–62. doi: 10.1016/j.amjcard.2010.06.029. [DOI] [PubMed] [Google Scholar]
- 31.Borg AN, Pearce KA, Williams SG, Ray SG. Left atrial function and deformation in chronic primary mitral regurgitation. Eur J Echocardiogr. 2009;10:833–40. doi: 10.1093/ejechocard/jep085. [DOI] [PubMed] [Google Scholar]
- 32.Cameli M, Lisi M, Giacomin E, Caputo M, Navarri R, Malandrino A, et al. Chronic mitral regurgitation: left atrial deformation analysis by two-dimensional speckle tracking echocardiography. Echocardiography. 2011;28:327–34. doi: 10.1111/j.1540-8175.2010.01329.x. [DOI] [PubMed] [Google Scholar]
- 33.Cameli M, Lisi M, Righini FM, Focardi M, Alfieri O, Mondillo S. Left atrial speckle tracking analysis in patients with mitral insufficiency and history of paroxysmal atrial fibrillation. Int J Cardiovasc Imaging. 2011 doi: 10.1007/s10554-011-9987-y. (Epub ahead of print Dec. 1) [DOI] [PubMed] [Google Scholar]
- 34.Caso P, Ancona R, Di Salvo G, Comenale Pinto S, Macrino M, Di Palma V, et al. Atrial reservoir function by strain rate imaging in asymptomatic mitral stenosis: prognostic value at 3 year follow-up. Eur J Echocardiogr. 2009;10:753–9. doi: 10.1093/ejechocard/jep058. [DOI] [PubMed] [Google Scholar]
- 35.Ammar KA, Paterick TE, Khandheria BK, Jan MF, Kramer C, Umland MM, et al. Myocardial mechanics: understanding and applying three-dimensional speckle tracking echocardiography in clinical practice. Echocardiography. 2012 doi: 10.1111/j.1540-8175.2012.01712.x. (Epub ahead of print May 17) [DOI] [PubMed] [Google Scholar]
- 36.Kim HB, Hertzberg J, Lanning C, Shandas R. Noninvasive measurement of steady and pulsating velocity profiles and shear rates in arteries using echo PIV: in vitro validation studies. Ann Biomed Eng. 2004;32:1067–76. doi: 10.1114/b:abme.0000036643.45452.6d. [DOI] [PubMed] [Google Scholar]
- 37.Sengupta PP, Khandheria BK, Korinek J, Jahangir A, Yoshifuku S, Milosevic I, et al. Left ventricular isovolumic flow sequence during sinus and paced rhythms: new insights from use of high-resolution Doppler and ultrasonic digital particle imaging velocimetry. J Am Coll Cardiol. 2007;49:899–908. doi: 10.1016/j.jacc.2006.07.075. [DOI] [PubMed] [Google Scholar]
Associated Data
This section collects any data citations, data availability statements, or supplementary materials included in this article.


