

Abstract
Background
Trichoderma is a genus of mycotrophic filamentous fungi (teleomorph Hypocrea) which possess a bright variety of biotrophic and saprotrophic lifestyles. The ability to parasitize and/or kill other fungi (mycoparasitism) is used in plant protection against soil-borne fungal diseases (biological control, or biocontrol). To investigate mechanisms of mycoparasitism, we compared the transcriptional responses of cosmopolitan opportunistic species and powerful biocontrol agents Trichoderma atroviride and T. virens with tropical ecologically restricted species T. reesei during confrontations with a plant pathogenic fungus Rhizoctonia solani.
Results
The three Trichoderma spp. exhibited a strikingly different transcriptomic response already before physical contact with alien hyphae. T. atroviride expressed an array of genes involved in production of secondary metabolites, GH16 ß-glucanases, various proteases and small secreted cysteine rich proteins. T. virens, on the other hand, expressed mainly the genes for biosynthesis of gliotoxin, respective precursors and also glutathione, which is necessary for gliotoxin biosynthesis. In contrast, T. reesei increased the expression of genes encoding cellulases and hemicellulases, and of the genes involved in solute transport. The majority of differentially regulated genes were orthologues present in all three species or both in T. atroviride and T. virens, indicating that the regulation of expression of these genes is different in the three Trichoderma spp. The genes expressed in all three fungi exhibited a nonrandom genomic distribution, indicating a possibility for their regulation via chromatin modification.
Conclusion
This genome-wide expression study demonstrates that the initial Trichoderma mycotrophy has differentiated into several alternative ecological strategies ranging from parasitism to predation and saprotrophy. It provides first insights into the mechanisms of interactions between Trichoderma and other fungi that may be exploited for further development of biofungicides.
Keywords: Hypocrea, T. atroviride, T. virens, T. reesei, Mycoparasitism, Gene expression, Biocontrol, Transcriptomics
Background
Mycoparasitism describes the type of biotrophic interactions in which organisms benefit at the expense of the fungi [1]. In a broad sense this property is most proliferated within the fungal family Hypocreaceae, and the ability to antagonize, parasitize or even kill other fungi (necrotrophic hyperparasitism, mycotrophy) is particularly common in the genus Trichoderma (teleomorph Hypocrea, Hypocreales, Dikarya) [1]. The biochemistry and genetics of mycoparasitism has been most thoroughly investigated in only a few species of Trichoderma such as Trichoderma harzianum sensu lato, T. atroviride (teleomorph Hypocrea atroviridis), T. virens (teleomorph H. virens), T. asperellum and T. asperelloides[1-3] because of their application as agents of biological control of pests (biocontrol) in agriculture. Consequently, several enzymes and other effectors involved in the recognition of a fungus and in the mycoparasitic responses itself have been identified [4-7]. Expressed-sequence-tag (EST) libraries obtained of different Trichoderma strains cultivated under various conditions have contributed significantly to the large-scale identification of genes required for the interaction [8-12]. DNA microarrays have been used to study the interaction of Trichoderma with plants [13]. So far, however, only two studies used high throughput transcriptomic tools to investigate mechanisms of Trichoderma mycoparasitism [5,11].
A comparative analysis of the genome inventory of T. atroviride, T. virens and T. reesei revealed that mycoparasitism is the innate property of the genus Trichoderma[1,4]. It has been suggested that the evolutionary more recent species T. reesei adapted to a certain ecological niche and thereby partially lost the strength of its mycoparasitic potential [1,4]. A comparison of genome wide gene expression in vigorous and moderate mycoparasitic Trichoderma species may therefore lead to the identification of mechanisms involved in the interaction.
In this study we have applied oligonucleotide tiling microarrays to obtain transcriptional profiles of T. atroviride IMI 206040, T. virens Gv29-8 and T. reesei QM 6a (which were used for genome sequencing) interaction with the plant pathogenic fungus Rhizoctonia solani (teleomorph Thanatephorus, Basidiomycota). Our data highlight the differences in the mechanisms of these interactions between Trichoderma species and emphasize the existence of alternative strategies employed by these fungi.
Results
Confrontation assays and Trichoderma mode of action
In order to identify the genes that are involved in T. atroviride (Ta), T. virens (Tv) and T. reesei (Tr) interaction with R. solani, we performed dual confrontation assays. R. solani, a plant pathogenic fungus was chosen as a model prey fungus because several biocontrol formulations based on Trichoderma target various plant diseases caused by this fungus [14] and as it makes severe agricultural damages on a wide range of crops worldwide [15]. The three Trichoderma spp. revealed essential differences in their response to confrontation with R. solani (Figure 1): Tr was at first unable to stop the growth of R. solani, and the growth of the latter one was even stimulated for 21% more than when confronted to itself. However, after 10 days at the borderline between the two cultures there was a clear barrage zone that was later consequently overgrown by Tr (Figure 1). Tv inhibited the growth of R. solani by 9%, but it was able to fully overgrow R. solani colony and finally killed it. In contrast, at 10th day Ta did not stop the growth of R. solani, but it straightforwardly overgrew it almost completely (86%, Figure 1). Thus, in terms of this experiment, Tv and Ta expressed interactions best described as predation (immediate kill and consumption) and parasitism respectively. Tr showed neutral reaction with signs of weak mycoparasitism.
Figure 1.
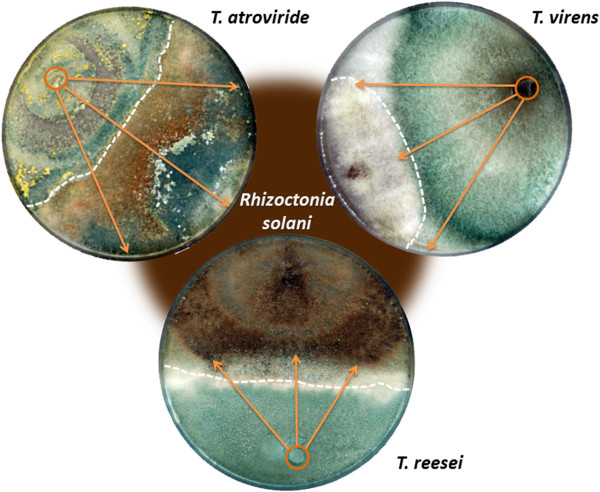
Mycoparasitism of Trichoderma spp. in dual confrontations assays with Rhizoctonia solani. Fungi were incubated for 10 days on PDA at 25°C and 12 hours cyclic illumination. Arrows indicate overgrowth of R. solani by Trichoderma spp.
Transcriptional response of Trichoderma to the interaction with R. solani
The tiling microarray data of Ta, Tv and Tr were analyzed at three stages of the interaction: (1) before contact with alien hyphae (BC), (2) during the initial contact with the hyphae (C), and (3) when the interaction has been established (after contact; AC) (Figure 2). After data normalization we applied the linear modeling approach and the Bayes statistics implemented in the LIMMA package (http://bioinf.wehi.edu.au/limma/, [16]) to the biological replicates as described in Materials and Methods. In total more than 60% of the genes present in the three genomes were found to be transcribed. Among them 651, 303 and 424 genes were found to be differentially regulated (larger/smaller than log2 (ratio) = 1.5) in Ta, Tv and Tr, respectively (Table 1; Additional file 1: Tables S1-S3) and thus involved in the interaction. All of up- and down-regulated genes were annotated and categorized as described in the Materials and Methods section. In addition, Functional Catalogue (FunCat, http://mips.helmholtz-muenchen.de/proj/funcatDB/) protein families were assigned to those genes for which a function could be predicted (Table 2). 66, 70 and 62% of the significantly expressed genes of Ta, Tv and Tr, respectively, encoded genes with significant similarity to other fungal proteins (blastp E < e-100; Table 1). The remaining genes were annotated as unknown (when orthologues were found in other fungal genera but no function was assigned) or orphan (unique; present only in Trichoderma spp.) proteins (see Materials and Methods for definition). The latter comprised only 0.5-0.7% of all transcripts for the three Trichoderma species (Table 1). Statistical analysis revealed that the transcriptomic profiles of three investigated species were significantly different (ANOVA, p < 0.001). The majority of involved genes in Tr and Tv (63 and 84% respectively) were down-regulated, whereas the up- and down-regulated genes in Ta occurred in approximately equal proportions (52% up- and 48% down-regulated). However, in all species the pattern of up- and down-regulation depended on the confrontation stages (Figure 3).
Figure 2.
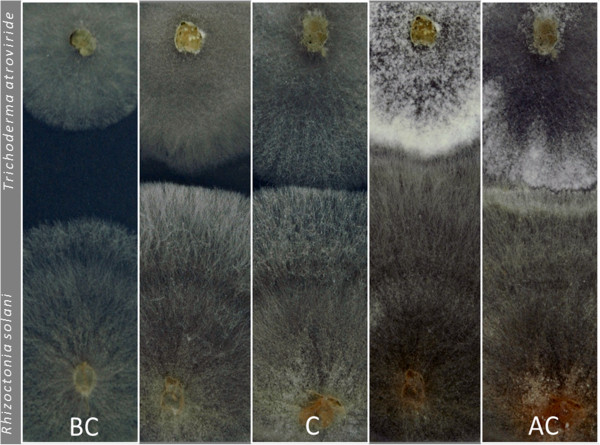
Development of mycoparasitic reaction of Trichoderma atroviride against Rhizoctonia solani. The mycelium was sampled before contact (BC), at the contact (C) and after the contact (=overgrowth, AC) with R. solani.
Table 1.
Numbers of transcripts that are either up- or down-regulated during the mycoparasitic response of T. reesei, T. atroviride and T. virens
| Species | Section | Genes |
Transcripts |
Proteins |
||||||
|---|---|---|---|---|---|---|---|---|---|---|
|
With identified function |
Unknown |
Orphan |
||||||||
| Total | Up/down (%*) | Total | Up/down (%) | Total | Up/down (%) | Total | Up/down (%) | |||
|
T. reesei |
Longibrachiatum |
9 143 |
424 |
36.6/63.4 |
264 |
44.7/55.3 |
137 |
23.4/76.6 |
23 |
21.7/78.3 |
|
T. atroviride |
Trichoderma |
11 865 |
651 |
53.1/46.9 |
432 |
52.1/47.9 |
173 |
58.4/41.6 |
46 |
43.5/56.5 |
| T. virens | Pachybasium | 12 428 | 303 | 15.5/84.5 | 211 | 19.4/80.6 | 71 | 8.5/91.5 | 21 | 0/100 |
*the percentages of up- and down regulated genes are calculated based on the total number of transcripts found within each group of genes; bold fond highlights larger values.
Table 2.
Protein groups (FunCat) that exhibited significant up- and/or down-regulation during mycoparasitic interaction in at least one of the three Trichoderma spp.*
| FunCat category | FunCat number | Annotation |
T. atroviride |
T. virens |
T. reesei |
|||||||||
|---|---|---|---|---|---|---|---|---|---|---|---|---|---|---|
|
11 865 genes |
12 428 genes |
9 143 genes |
||||||||||||
| Total involved | Up down | Up/down (%) | Total involved | Up down | Up/down (%) | Total involved | Up down | Up/down (%) | ||||||
| metabolism |
01_05_01_01_09 |
2-oxoglutarate dependent dioxygenase |
3 |
0 |
3 |
0 |
1 |
1 |
0 |
n.a. |
0 |
0 |
0 |
n.a. |
| |
01_04 |
acid phosphatase |
4 |
4 |
0 |
n.a. |
1 |
1 |
0 |
n.a. |
1 |
1 |
0 |
n.a. |
| |
01_20_05_11 |
PKS |
5 |
2 |
3 |
0.7 |
1 |
0 |
1 |
0 |
4 |
2 |
2 |
1 |
| |
01_20_35_01_05 |
flavonol reductase |
4 |
4 |
0 |
n.a. |
1 |
0 |
1 |
0 |
0 |
0 |
0 |
|
| |
01_20_35_01_05 |
isoflavon reductase |
2 |
2 |
0 |
n.a. |
0 |
0 |
0 |
0 |
1 |
0 |
1 |
0 |
| |
01_20_36 |
NRPS |
2 |
0 |
2 |
0 |
4 |
0 |
4 |
0 |
2 |
0 |
2 |
0 |
| |
01_25_01 |
GH glycosyl hydrolase |
51 |
10 |
41 |
0.2 |
5 |
4 |
1 |
4 |
36 |
34 |
2 |
17 |
| |
01_25_03 |
protease |
15 |
13 |
2 |
6.5 |
3 |
1 |
2 |
0.5 |
5 |
2 |
3 |
0.7 |
| |
01_25_07 |
lipase/esterase |
6 |
2 |
4 |
0.5 |
2 |
0 |
2 |
0 |
3 |
1 |
2 |
0.5 |
| |
01_25_07 |
CE carbohydrate esterase |
3 |
1 |
2 |
0.5 |
0 |
0 |
0 |
0 |
3 |
3 |
0 |
n.a. |
| transcription |
11_02_03_04 |
C2H2 transcriptional regulator |
5 |
2 |
3 |
0.7 |
5 |
0 |
5 |
0 |
9 |
3 |
6 |
0.5 |
| 11_02_03_04 |
transcription factor |
8 |
1 |
7 |
0.1 |
0 |
0 |
0 |
n.a. |
0 |
0 |
0 |
n.a. |
|
| 11_02_03_04 |
Zn2Cys6 transcriptional regulator |
11 |
3 |
8 |
0.4 |
3 |
0 |
3 |
0 |
5 |
2 |
3 |
0.7 |
|
| protein fate |
14_07_04 |
GCN5-N-acetyltransferase |
6 |
3 |
3 |
1 |
2 |
1 |
1 |
1 |
1 |
1 |
0 |
n.a. |
| 14_07_09 |
SAM-dependent methyltransferase |
4 |
4 |
0 |
n.a. |
3 |
0 |
3 |
0 |
3 |
2 |
1 |
2 |
|
| protein with binding functions |
16_01 |
ankyrin |
2 |
1 |
0 |
n.a. |
2 |
0 |
2 |
0 |
0 |
0 |
0 |
n.a. |
| 16_21 |
cytochrome P450 subfamily |
8 |
6 |
2 |
3 |
9 |
0 |
9 |
0 |
5 |
4 |
1 |
4 |
|
| 16_21 |
FAD-dependent monooxygenase |
11 |
8 |
3 |
2.7 |
3 |
2 |
1 |
2 |
2 |
0 |
2 |
0 |
|
| 16_21_07 |
GMC oxidoreductase |
2 |
2 |
0 |
n.a. |
2 |
0 |
2 |
0 |
1 |
0 |
1 |
0 |
|
| 16_21_07 |
short chain dehydrogenase/reductase |
8 |
5 |
3 |
1.7 |
11 |
0 |
11 |
0 |
6 |
0 |
6 |
0 |
|
| cellular transport |
20_01_01 |
oligopeptide transporter |
8 |
3 |
5 |
0.6 |
1 |
1 |
0 |
n.a. |
3 |
1 |
2 |
0.5 |
| 20_01_01_01_01 |
iron permease |
2 |
2 |
0 |
n.a. |
0 |
0 |
0 |
n.a. |
0 |
0 |
0 |
n.a. |
|
| 20_01_01_07 |
inorganic phosphate transporter |
4 |
4 |
0 |
n.a. |
1 |
1 |
0 |
n.a. |
1 |
1 |
0 |
n.a. |
|
| 20_01_03 |
monocarboxylate transporter |
3 |
3 |
0 |
n.a. |
0 |
0 |
0 |
n.a. |
0 |
0 |
0 |
n.a. |
|
| 20_01_07 |
amino acid permease |
5 |
1 |
4 |
0.3 |
3 |
3 |
0 |
n.a. |
4 |
3 |
1 |
3 |
|
| 20_03 |
MFS (major facilitator superfamily) (12 TMH) |
51 |
15 |
36 |
0.4 |
7 |
4 |
3 |
1.3 |
17 |
9 |
8 |
1.1 |
|
| signal transduction mechanism |
30_05_02_24 |
GPCR, G-protein coupled receptor |
6 |
1 |
5 |
0.2 |
0 |
0 |
0 |
n.a. |
2 |
0 |
2 |
0 |
| 30_05_02_24 |
PTH11-type GPCR |
11 |
9 |
2 |
4.5 |
2 |
0 |
2 |
0 |
2 |
1 |
1 |
1 |
|
| cell rescue and defense |
32_01_05 |
chaperone/heat shock protein |
0 |
0 |
0 |
n.a. |
5 |
5 |
0 |
n.a. |
4 |
0 |
4 |
0 |
| 32_07 |
AAA + −type ATPase |
4 |
2 |
2 |
1 |
8 |
0 |
8 |
0 |
2 |
1 |
1 |
1 |
|
| 32_07_05 |
PDR-type multidrug transporter |
3 |
3 |
1 |
3 |
0 |
0 |
0 |
n.a. |
2 |
1 |
1 |
1 |
|
| 32_07_05 |
ABC transporter |
0 |
0 |
0 |
n.a. |
2 |
0 |
2 |
0 |
2 |
0 |
2 |
0 |
|
| 32_07_05 |
MDR (multidrug resistance-associated protein) |
0 |
0 |
0 |
n.a. |
2 |
0 |
2 |
0 |
1 |
0 |
1 |
0 |
|
| 32_07_07_03 |
glutathione S-transferase |
3 |
3 |
0 |
n.a. |
4 |
0 |
4 |
0 |
2 |
0 |
2 |
0 |
|
| subcellular localization |
70_01 |
cell wall protein |
5 |
0 |
5 |
0 |
2 |
0 |
2 |
0 |
4 |
2 |
2 |
1 |
| 70_27 |
SSCR (small secreted cysteine rich protein) |
8 |
8 |
0 |
n.a. |
6 |
0 |
6 |
0 |
0 |
0 |
0 |
n.a. |
|
| cell fate | 40 | HET protein | 2 | 2 | 0 | n.a. | 0 | 0 | 0 | n.a. | 1 | 0 | 1 | 0 |
*ratio values cannot be given when denominator is zero; n.a. means not applicable.
Figure 3.

Averaged regulation of all genes (|log2 (ratio)| > 1.5) involved in mycoparasitsm of T. reesei, T. atroviride and T. virens during the three confrontation stages with R. solani (BC, C and AC). Vertical bars denote 0.95 confidence intervals. The same letters above the bars indicate the statistical significance (ANOVA) between the stages of each species: for m–n–r p < 0.005; s–t p < 0.02; u–z p < 0.001. The plot shows different trends of gene expression kinetics between the species and does not reflect the gene regulation intensity differences among the species.
Interestingly, the majority of significantly up-regulated genes were represented by genes for which orthologues in other Trichoderma species are present (Figure 4). In addition, 88 of these genes were shared only between Tv and Ta. Thus 93.2, 74.4 and 84.8% of all genes that were significantly expressed in either Tr, Ta or Tv, respectively, were orthologues or at least conserved in Ta and Tv. In contrast, among those most of genes involved in mycoparasitic response were only found in one species. Only nine orthologuous genes were up-regulated in all three species (Figure 4) when confronted with R. solani, and 29 genes were significantly expressed only in the two mycoparasitic species Ta and Tv; they comprised 16 unknown, three putative MFS transporters, two orphan and two unknown transcriptional activators genes.
Figure 4.

The Venn diagram showing the number of orthologous genes of T. reesei, T. atroviride and T. virens that are involved in mycoparasitic response against Rhizoctonia solani (at all stages of confrontation). The total number of orthologous genes per species is given below the respective species name.
The most significant differences were evident at the pre-contact stage (ANOVA, p < 0.001): in Tr, the majority of differentially regulated genes were up-regulated, whereas in Tv and in Ta genes in this stage were mostly down-regulated and showed only a small response (Figure 3). At contact with hyphal tips of R. solani, Tr and Ta displayed only a low transcriptomic response, whereas Tv showed significant down-regulation of most of its genes (ANOVA, p < 0.001). During overgrowth of the prey, expression of most of genes increased in Ta and Tv, but were down-regulated in Tr. However, in general transcriptional response in this stage was significantly different between Ta and the other two species (ANOVA, p < 0.001).
To confirm the microarray results, quantitative Real-Time-PCR (qPCR) was performed on a subset of the genes from Tv and Ta. They were chosen from gene families that showed abundant up-regulation during confrontation with R. solani, such as GH16 glucanases, proteases, PKS and SSCPs (see below). Expression of these genes correlated well with the data of the microarray (Additional file 1: Table S4). We therefore conclude that the results of tiling microarray analysis indeed reflect differences in the function of genes involved in mycoparasitism.
The enrichment for the major functional categories (FunCat) was assessed for each category (Table 2) separately. To reveal the common (shared by all three species) and species-specific mechanisms acting at every stage of interaction between Trichoderma and R. solani we performed the statistical analysis of the respective FunCats. In general, all three species showed significantly different FunCat profiles indicating the presence of alternative interaction strategies (MANOVA; p < 0.05). Shifts in gene expression between BC, C and AC stages of the interaction were also strongly species-specific (Figure 5): only a minor portion of genes became down-regulated in C compared to BC and at AC compared to C (ANOVA < p < 0.001). However the massive differences were observed in Ta when a large group of genes became up-regulated at AC compared to BC and C (Figure 5A).
Figure 5.

Scatter plots of all regulated genes in each stage for (A) T. atroviride, (B) T. virens and (C) T. reesei, respectively. The log2 (ratio) regulation for the genes at contact (C, circles) and after the contact (AC, squares) stages are plotted against the genes regulated prior the contact (BC). The genes, for which a stage-specific difference was found, are indicated by their functional names.
Statistical analysis of the global comparison of FunCat categories for the three stages for Tr, Tv and Ta, revealed that most categories broadly scattered both in the up- and down-regulated areas (Table 2). However, some specific features were observed: in Tr, genes involved in metabolism and transport were all up-regulated and the latter also in Tv; expression of proteins with binding function was increased in Ta during the contact phase and proteins involved in self-defense decreased in Tr during overgrowth. It is also apparent that during overgrowth regulation of all genes was much more comparable (as indicated by less scattering of values), and only few categories also included up-regulated genes.
Genes up-regulated in interaction with R. solani
A comparison of the protein families [Pfam, http://pfam.sanger.ac.uk/] assigned for up-regulated genes in the above analysis revealed very little common responses among the three Trichoderma spp., and also between the two opportunistic and strong mycoparasitic species. In fact only a few gene families shared a common trend in all three Trichoderma spp. (proteases, heat shock proteins, cytochrome C peroxidase, proline oxidase, ER-bound glutathione-S-transferases, ABC efflux transporters, the pleiotropic drug resistance (PDR) transporters, multidrug resistance MDR-type transporters and nitrilases), indicating that stress response connected with detoxification of potentially hazardous metabolites is a general reaction of Trichoderma during antagonism (see the Discussion below).
In addition to the genes named above, all three Trichoderma spp. had distinct specific responses. Thus, in addition to expression of the highest number of several protease families (dominated by subtilisin-like and aspartyl proteases), Ta increased the transcription of oligopeptide transporters, C-type lectins, small secreted cysteine-rich proteins (SSCPs), PTH11-receptors and ß-glucanases of the GH16 family (Table 2; Additional file 1: Tables S1-S3). In contrast, Tv mainly increased the expression of genes for gliotoxin biosynthesis including the genes for its precursors, and genes encoding heat shock proteins. The minor additional responses in Tv included increased up-regulation of chaperone proteins, and several dehydrogenases and monooxygenases and significant down-regulation of AAA + −type ATPases and transcriptional regulators. However, it was conspicuous that both strongly opportunistic and mycoparasitic species expressed all these genes already at a stage before hyphal contact with R. solani, and were not expressed anymore after the contact with the prey (Figure 5B).
Ta also largely relied on antibiosis: one polyketide synthase (PKS) of the reducing (lovastatin/citrinin) clade I (Triat2:134224; [17]) was expressed at all stages of interaction, and peaked at C. A second PKS gene (Triat2:85006; [17]) from the reducing clade I was expressed only at contact but not at BC and AC. Interestingly, Ta also expressed genes encoding two KP4-like killer-toxins that have so far not been described for filamentous fungi. In addition, the up-regulation of genes encoding macrophomate synthases, isoflavone reductases and pyoverdin dioxygenases was notable. These genes may be involved in the formation of yet unknown secondary metabolites of Trichoderma. Finally, a gene encoding a lipoxygenase (Triat2:33350), which is absent in Tr and Tv, was up-regulated at C stage. It may be involved in the biosynthesis of γ-pentylpyrone (see details in the Discussion).
In contrast, the transcriptome of Tr before contact revealed unique response to the presence of R. solani. It showed a massive up-regulation of cellulolytic and hemicellulolytic CAZymes, and ribosomal proteins (Table 2). Furthermore, several transporter proteins (MSF permeases, inorganic phosphate, oligopeptide and amino acid transporters) as well one PKS (Trire2:60118) were up-regulated at this stage. Interestingly, Tr also up-regulated subtilisin proteases but none of the aspartyl proteases that were active in Ta. At C stage Tr significantly reduced the total gene expression, and only genes encoding a multidrug transporter, a stress-responsive protein (RDS1) and another PKS were induced and may indicate defense reaction rather than an attack. The AC stage was characterized by an increased activity of the genes encoding ribosomal proteins, while genes for cellulolytic and hemicellulolytic CAZymes were not expressed anymore.
Genes down-regulated in interaction with R. solani
Some gene families were consistently down-regulated in all three species during confrontation with R. solani, particularly already at BC stage. These comprised short-chain dehydrogenases/reductases, transcriptional regulators of the fungal-specific Zn(2)Cys(6) family, non-ribosomal peptide synthases, and AAA + −domain proteases.
The only species-specific response was detected for Ta, which showed the opposite expression pattern of genes involved in polysaccharide and lipid hydrolysis and solute uptake to Tr, as it strongly down-regulated all these genes already prior the contact (BC).
Genomic distribution of genes involved in mycoparasitism
We also investigated whether the genes expressed during interaction with R. solani would be clustered in the genome. Our approach was based on the consideration that under random distribution of transcribed genes, we should (on the average) find them once in batches of 18, 42 and 22 subsequent genes in Ta, Tv and Tr, respectively. These values arise by division of the total number of genes in the Ta, Tv and Tr (11865, 12518, and 9143, respectively) by the number of genes significantly expressed by them in this study (651, 303 and 424, respectively). To detect significant deviations from these expectations, we manually screened the three genomes for genes that occurred within the vicinity of each other at an at least 3-fold lower value than the above calculated average distributions, as was also done by Seiboth, Aghcheh et al. [18]. We detected that the distribution of about one third of the genes (36.9, 34.7 and 37.2% in Ta, Tv and Tr, respectively) was not random (Pearson coefficient >0.25) (Table 3). About a third of them were located at the ends of the respective scaffolds implying that they are situated either at the ends of chromosomes or nearby repetitive regions.
Table 3.
Clusters of nonrandomly distributed genes in T. atroviride, T. virens and T. reesei that are involved in mycoparasitism
| Scaffold |
T. atroviride |
T. virens |
T. reesei |
|||
|---|---|---|---|---|---|---|
| Gene area* | Density** | Gene area* | Density** | Gene area* | Density** | |
|
1 |
44-47 |
3/4 |
583-618 |
6/36 |
62-68 |
3/7 |
| |
69-87 |
7/19 |
974-990 |
4/17 |
129-135 |
4/7 |
| |
1111-1119 |
4/9 |
|
|
439-452 |
4/14 |
| |
1331-1340 |
3/10 |
|
|
632-639 |
3/8 |
| |
1717-1726 |
3/10 |
|
|
734-753 |
5/20 |
|
2 |
85-93 |
3/9 |
3-27 |
7/25 |
43-55 |
4/13 |
| |
306-313 |
3/8 |
134-148 |
3/15 |
|
|
| |
649-663 |
6/15 |
253-274 |
4/22 |
|
|
| |
936-942 |
3/7 |
665-695 |
4/31 |
|
|
| |
998-1000 |
3/3 |
|
|
|
|
| |
1031-1039 |
3/9 |
|
|
|
|
| |
1039-1054 |
6/16 |
|
|
|
|
|
3 |
140-143 |
4/4 |
788-792 |
4/5 |
4-27 |
5/24 |
| |
189-201 |
10/13 |
|
|
333-342 |
3/10 |
| |
691-698 |
3/8 |
|
|
406-411 |
4/6 |
| |
771-773 |
3/3 |
|
|
|
|
|
4 |
37-45 |
4/9 |
20-24 |
4/5 |
34-45 |
3/12 |
| |
340-349 |
3/10 |
242-255 |
3/14 |
333-339 |
3/7 |
| |
593-614 |
6/20 |
327-346 |
3/20 |
|
|
|
5 |
12 - 24 |
7/13 |
252-262 |
3/11 |
209-226 |
4/14 |
| |
97-104 |
3/8 |
|
|
235-248 |
4/14 |
| |
286-302 |
5/17 |
|
|
448-463 |
5/16 |
| |
389-412 |
8/22 |
|
|
|
|
| |
425-427 |
3/3 |
|
|
|
|
|
6 |
264-268 |
4/5 |
2-21 |
3/20 |
24-51 |
6/28 |
| |
354-357 |
3/4 |
|
|
128-139 |
3/12 |
| |
461-483 |
7/23 |
|
|
|
|
|
7 |
178-187 |
4/10 |
6-9 |
3/4 |
59-72 |
5/14 |
| |
404-408 |
3/5 |
|
|
286-292 |
3/7 |
| |
484-509 |
8/26 |
|
|
|
|
| |
524-532 |
5/9 |
|
|
|
|
| |
546-559 |
4/14 |
|
|
|
|
|
8 |
117-129 |
6/13 |
|
|
276-290 |
3/15 |
| |
155-165 |
6/11 |
|
|
|
|
| |
185-189 |
3/5 |
|
|
|
|
|
9 |
173-188 |
6/16 |
|
|
26-44 |
4/19 |
| |
198-212 |
4/15 |
|
|
|
|
| |
489-498 |
4/10 |
|
|
|
|
|
10 |
|
|
242-262 |
3/21 |
74-83 |
3/10 |
| |
|
|
|
|
185-187 |
3/3 |
| |
|
|
|
|
262-272 |
3/11 |
| |
|
|
|
|
316-344 |
5/29 |
|
11 |
399-411 |
5/13 |
|
|
|
|
| |
462-477 |
9/16 |
|
|
|
|
|
12 |
386-391 |
3/6 |
|
|
7-11 |
3/5 |
| |
466-468 |
3/3 |
|
|
160-174 |
3/15 |
|
13 |
77-85 |
3/9 |
277-281 |
3/5 |
|
|
| |
132-139 |
3/8 |
|
|
|
|
| |
275-281 |
3/7 |
|
|
|
|
| |
|
|
219-229 |
3/11 |
1-14 |
3/15 |
|
15 |
20-25 |
4/6 |
|
|
|
|
| |
169-174 |
3/6 |
|
|
|
|
|
16 |
55-61 |
3/7 |
|
|
|
|
|
17 |
78-85 |
3/8 |
|
|
59-86 |
6/28 |
| |
165-175 |
4/11 |
|
|
|
|
|
18 |
45-62 |
6/18 |
1-7 |
5/7 |
|
|
| |
135-138 |
3/4 |
|
|
|
|
|
19 |
4 of 12 |
3/9 |
107-113 |
4/7 |
32-37 |
3/6 |
| |
68-82 |
6/15 |
|
|
|
|
| |
141-155 |
4/15 |
|
|
|
|
|
20 |
2-11 |
5/10 |
|
|
94/100 |
3/7 |
|
21 |
|
|
21-41 |
3/21 |
116-120 |
4/5 |
| |
|
|
100-109 |
3/10 |
|
|
|
22 |
|
|
101-114 |
4/15 |
80-109 |
7/30 |
|
24 |
|
|
|
|
29-41 |
4/13 |
|
26 |
|
|
53-63 |
4/11 |
|
|
|
27 |
|
|
|
|
40-56 |
4/17 |
|
28 |
|
|
32-51 |
3/20 |
68-74 |
3/7 |
| |
|
|
|
|
98-122 |
5/25 |
|
29 |
|
|
|
|
68-79 |
3/12 |
| |
|
|
|
|
99-113 |
6/13 |
|
32 |
|
|
|
|
55-62 |
3/8 |
|
34 |
|
|
3-13 |
10/11 |
26-30 |
3/5 |
|
35 |
|
|
32-51 |
4/20 |
|
|
|
45 |
|
|
|
|
7-20 |
3/14 |
| 54 | 1-8 | 5/8 | ||||
* indicates the area on the scaffold in which the cluster was identified, given by the numbers of the first and the last genes on the scaffold. ** the ratio of significantly up- or down-regulated genes to the total number of genes in the cluster.
Discussion
Although a wide range of Trichoderma spp. have been described as mycoparasites [1], detailed studies on the molecular physiology of this trait have been performed mostly with T. harzianum CECT 2413 or the T. atroviride strains P1 and IMI 206040 [2,3,19]. Based on these studies, it is commonly believed that the expression of cell wall lytic enzymes (particularly chitinases but also ß-glucanases and proteases) and secondary metabolites are the major determinants for success in this process. The present comparison of the two mycoparasites T. atroviride and T. virens with T. reesei, which was unable to efficiently besiege R. solani, changes this view in two important aspects: first, the role of induction of hydrolytic enzymes and secondary metabolites must be revisited; and second, the two mycoparasites display completely different strategies to antagonize their host/prey.
The latter claim is nicely reflected by the findings that – although the majority of significantly expressed genes in the three Trichoderma spp. belong to the gene inventory present in all of them – most of these genes are specific for only in one of the species. This implies that rather the regulation of gene expression than the availability of specific “mycoparasitic” genes is the key for successful antagonism. The molecular basis for this has not yet been studied: it could be the enhanced number of transcription factors in Ta and Tv[4] which may have resulted in a more refined transcription pattern of genes related to mycoparasitism. The other reason could be the occurrence of many of these genes in nonsyntenic regions of the genome (at the ends of chromosomes or nearby repetitive regions; vide supra), which could have changed the transcriptional environment of these genes.
We have previously reported that T. atroviride is able to sense the presence of its host from a distance [20]. This ability to sense the other fungus seems to be a property of all Trichoderma species, as all three show a significant and specific expression of a number of genes already before contact. However, the types of genes expressed distinguished T. atroviride and T. virens from T. reesei: while the former two species express a number of genes for which a function in antagonism can be interpreted, T. reesei mainly expresses genes for nutrient acquisition. Interestingly, the expression of the same cellulase and hemicellulase genes was strongly down-regulated in T. atroviride and highly induced in T. reesei, T. virens remained unaffected. One interpretation of this observation would be that – upon sensing a potential prey – T. atroviride changes gene expression towards an attack, whereas T. reesei attempts to compete with the other fungus by faster acquisition of nutrients. Likewise, it is possible that the sensing of a basidiomycete fungus signals the availability of pre-degraded wood to T. reesei, in accordance with the model that T. reesei became an efficient saprotroph on dead wood by following wood-degrading fungi into their habitat [1,20,21]. This implies that components from the host/prey are able to stimulate this process, and the role of the general cellulase regulator XYR1 [22] therefore warrants examination. The fact that cellulase gene expression came to an immediate stop when T. reesei arrived at physical contact with R. solani does not contradict this explanation, because cellulases and hemicellulases are secreted into the medium where they have a half-life of 40 and more hours. Thus the cellulases secreted by T. reesei before contact may suffice for nutrient acquisition throughout the whole process of interaction observed.
The two strong mycoparasitic species also differed in the tools that they used for combating and killing R. solani. T. virens straightforwardly headed for predation by poisoning R. solani with gliotoxin. Earlier studies [23-27] have already suggested that gliotoxin formation is the main antifungal principle of a subset of T. virens strains, so called “Q-strains” (such as Gv29-8). Our data are consistent with this claim, but it must be noted that they may not apply to “P-strains” as they do not produce gliotoxin [25,26]. In our experiments it was evident from the up-regulation of almost all genes required for gliotoxin biosynthesis, i.e. a two module non-ribosomal peptide synthetase (gliP); thioredoxin reductase (gliT); O-methyl transferase (gliM); a methyl transferase with unknown specificity (gliN); glutathione S-transferase (gliG); cytochrome P450 monooxygenases (gliC); amino cyclopropane carboxylate synthase (gliI); and a dipeptidase (gliJ). This coordinated expression is also supported by the genomic clustering of these genes (Figure 6). However, it was of interest to note that also genes involved in the provision of the precursor of gliotoxin, L-phenylalanine, and of the glutathione required for the formation of the central disulfide bond were induced during one or more of the three stages. Provision of sulfur for cysteine and subsequently glutathione biosynthesis appeared to be an essential requirement already before contact, as indicated by the up-regulation of two sulfate permeases, one sulfatase, the cysteine biosynthesis genes ATP-sulfurylase and PAPS reductase, and of SCON2, an ubiquitin-ligase involved in regulating sulfur metabolism under conditions of low sulfate supply [28]. Most of these genes were up-regulated only before contact, suggesting that T. virens could later fulfill the sulfur requirement by feeding on R. solani. In contrast, a shortage in L-phenylalanine appears to take place only during overgrowth as illustrated by the increased expression of 3-deoxy-D-arabino-heptulosonate-7-phosphate synthase, the first enzyme involved in the biosynthesis of aromatic amino acids, and also the regulatory target for this pathway [29].
Figure 6.

Gliotoxin and gliotoxin precursor biosynthesis in T. virens during mycoparasitism with R. solani. A) Only enzymes, whose genes are up-regulated are shown, marked as blue, yellow and green arrows for gene up-regulation before contact (BC), at the contact (C) and after the contact (AC), respectively. B) The arrows show the gliotoxin gene cluster including gene nomenclature, protein numbers and their regulation (blue, yellow and green arrows marking up-regulation BC, at C and AC, respectively) during mycoparasitic reaction with R. solani.
It is interesting to note that the genes of the gliotoxin gene cluster that are present in Tr[23] were not at all expressed during confrontation with R. solani, whereas the gliotoxin cluster is absent in Ta[23].
T. atroviride, in contrast, appeared to follow a strategy that involved antibiosis as well as the action of hydrolytic enzymes indicating a rather parasitic interaction that does not directly aims to kill the host. With respect to the latter, T. atroviride up-regulated almost only ß-1,3/1,4-D-glucanases of the GH16 family, of which some also contained a carbohydrate-binding domain of the lectin superfamily (SCOP link 49899). Unfortunately their properties have not been studied in sufficient detail to offer an interpretation why T. atroviride overexpressed just this battery of ß-glucanases and not one of the several others that are present in its genome [4].
Proteases, on the other hand, were up-regulated in all three species, although only the aspartyl proteases were consistently up-regulated in the two strong mycoparasites and down-regulated in T. reesei. This confirms our earlier conclusion [30] that the proteases play an important role in mycoparasitism.
Up-regulation of genes for secondary metabolite production in T. atroviride most conspicuously comprised two PKS genes of the reducing (lovastatin/citrinin-like) clade I [17]. One of them (Triat1:134224) was in fact one of the most up-regulated genes before and at contact with R. solani. However, there is indirect evidence for yet more secondary metabolite formation: T. atroviride has been reported to produce α–pentyl-pyrone, a volatile component with antifungal activity that is not formed by T. reesei and T. virens[31]. Its biosynthesis has been suggested to occur via linoleic acid, in analogy to jasmon synthesis by plants in which the necessary hydroxyl group originates from an oxidation by lipoxygenase [32]. A lipoxygenase gene was indeed present in T. atroviride (protein ID 33350) but not the two other species, and was significantly up-regulated in T. atroviride during contact with R. solani. In addition, the up-regulated genes putatively encoding macrophomate synthase, pyoverdin dioxygenase and of isoflavone reductase may be involved in the biosynthesis of so far unknown secondary metabolites. Two PKS (Trire2:60118, Trire2:82208; the first of the same type as the two of T. atroviride, and the second belonging to the nonreducing PKS clade I), were also up-regulated in T. reesei before and at contact respectively. However, no other genes with potential relationship to secondary metabolism were observed in T. reesei. Interestingly, genes encoding nonribosomal peptide synthases (NRPS) – including the two encoding peptaibol synthases, which have been emphasized as important antifungal components from Trichoderma[33] – were found to be down-regulated in all three species. Similar findings have been reported recently for T. atroviride by Reithner et al. [5].
Another notable finding with T. atroviride was the up-regulation of several genes encoding members of GPCR PTH11 class [34], of lectins and of small secreted cysteine rich proteins. PTH11 encoding genes were also among those up-regulated in the mycoparasite Coniothyrium minitans during colonization of Sclerotinia sclerotiorum[35], thus rendering them candidates for a function in mycoparasitism. Interestingly, a PTH11 receptor of Botrytis cinerea is not involved in plant pathogenicity but regulates the expression of a glutathione-S-transferase gene [36]. The lectins also included a gene encoding cyanovirin, a mannose-binding lectin [37]. Lectins have been suggested to be involved in coiling of Trichoderma around hyphae of the fungi they attack [38]. SSCPs are abundant in Trichoderma[4] and the high expression of several of them in T. atroviride suggests a potential role in mycoparasitism. They are involved in the mutualistic behavior of the ectomycorrhizal symbiont of plants Laccaria bicolor and are active in some plant pathogenic fungi [39].
Only a few gene families shared a common trend: all three Trichoderma spp. also displayed an oxidative response in confrontation with R. solani (expression of heat shock proteins, cytochrome C peroxidase, proline oxidase, and ER-bound glutathione-S-transferases). Likewise, genes for detoxification processes (ABC efflux transporters, the pleiotropic drug resistance (PDR) transporters and the multidrug resistance MDR-type transporters) were induced. R. solani uses radical oxygen species as signaling molecules during sclerotia formation [40], and excretes antifungal components [41], both of which could act in our experiments and may have elicited this response. An ABC-transporter from T. atroviride (TAABC2) is involved in biocontrol of R. solani[42].
A cyanide hydratase gene with high similarity to corresponding proteins from other ascomycetes was one of the most strongly induced genes in all three Trichoderma spp. at all stages of the interaction. The fungal cyanide hydratases form a functionally specialized subset of the nitrilases which catalyze the hydrolysis of cyanide to formamide [43]. One could argue that this nitrilase serves defend against cyanide produced by R. solani, but this has not yet been proven so far. On the other hand, bacteria like Pseudomonas spp. [44] produce cyanide. Since this gene was expressed by all three Trichoderma spp., its expression may be a general response of Trichoderma towards the presence of any host, but this clearly needs further investigations.
A significant portion of the genes responding to the presence of R. solani, were non-randomly distributed in the genome of all three Trichoderma spp. In ascomycetes clustering is primarily known for genes involved in secondary metabolite synthesis [45]. In T. reesei the genes encoding cellulases, hemicellulases and other proteins of the CAZome also occur in clusters [46], and we have recently shown that the genes regulated during conidiation also are clustered in the genome [47]. In Fusarium graminearum (teleomorph: Gibberella zeae) [48] and Neurospora crassa (anamorph: Chrysonilia crassa) [49], clustering occurs in subtelomeric regions and contains particularly fast evolving genes, such encoding secreted proteins and orphan genes related to ecological success of an organism. In this context, it is reasonable that the genes related to mycoparasitism are clustered in organisms that have specialized on this trait. In Aspergillus spp., expression of genes from such clusters is controlled by the putative methyltransferase LaeA [50], a component of the Velvet protein complex [51]. In this regards, we have recently shown that cellulase formation and conidiation in T. reesei are in fact regulated by the orthologue LAE1 [18]. Another component of the Velvet protein complex, VEL1 (VeA) controls mycoparasitism in T. virens[52]. We were recently able to show that LAE1 indeed is a regulator of mycoparasitism in T. atroviride (R.K. Aghcheh, I.S. Druzhinina and C.P. Kubicek, unpublished data).
Conclusions
The present comparison of the two opportunistic and strongly mycoparasitic species T. atroviride and T. virens with T. reesei, which is unable to besiege R. solani, reveals different responses of Trichoderma spp. to the presence of another fungus. It also demonstrates that there is no common mechanism by which a mycoparasite attacks and kills its host, but that alternative strategies are used. Finally, the observation of a nonrandom distribution of the transcribed genes suggests the possible involvement of epigenetic regulation of mycoparasitism.
Methods
Comparative transcriptomics analysis
For mycoparasitism confrontation assays T. virens Gv29-8, T. atroviride IMI 206040 and T. reesei QM 6a were grown on potato dextrose agar plates (BD Dicfo, Franklin Lakes, NJ, USA), covered with cellophane, at 25°C and 12 hours cyclic illumination and harvested when the mycelia were ca. 5 mm apart, at contact of the mycelia and after Trichoderma had overgrown the host fungus Rhizoctonia solani by ca. 5 mm. As control, the respective strain of Trichoderma was confronted with itself and harvested at contact. Peripheral hyphal zones from each confrontation stage were sampled and shock frozen in liquid nitrogen. Mycelia were ground to a fine powder under liquid nitrogen and total RNA was isolated using the guanidinium thiocyanate method [53]. For cDNA synthesis, RNA was treated with DNase I (Fermentas, Burlington, Canada) and purified with the RNeasy MiniElute Cleanup Kit (Qiagen, Valencia, CA, USA). 5 μg RNA/reaction were reverse transcribed using the SuperScript™ III Reverse Transcriptase (Invitrogen, Carlsbad, CA, USA) and a mixture of provided random hexamer primer and oligo(dT) primer.
We designed T. virens, T. atroviride and T. reesei tiling array with 60mer oligonucleotides (oligo length) each 93 bp apart (oligo distance), using the unmasked fasta file of the genomes of T. atroviride [http://genome.jgi.doe.gov/Triat2/Triat2.info.html], T. virens [http://genome.jgi-psf.org/Trive1/Trive1.home.html] and T. reesei [http://genome.jgi-psf.org/Trire2/Trire2.home.html]. The design was done with Teolenn [54] using a maximum prefix length match set to 30 for the uniqueness calculation made by genome tools. Complexity is evaluated using the masked genome by counting the number of masked bases for each probe. Tm values are calculated using the nearest neighbor thermodynamic model. No filters were applied after probe parameter calculations. In order to obtain the probe quality score, the calculated parameters were weighted as follows: 0.4 for Tm, 0.3 for uniqueness, 0.2 for GC content, and 0.1 for complexity. To get final oligonucleotide scores, a weighting of 0.75 was assigned to quality scores, and a weighting of 0.25 was assigned to position scores. Teolenn software designed 415373, 387105 and 359089 final probes respectively for T. atroviride, T. virens, and T. reesei. Oligonucleotides were loaded on Agilent eArray software and 2 × 400 k microarrays were obtained from Agilent. The microarray data and related protocols are available at the GEO web site [http://www.ncbi.nlm.nih.gov/geo/] under accession number GSE23438. Briefly, the RNAs of two independent biological replicates for each condition (which in turn consisted of pooled RNA preparations from at least three separate cultivations) were reverse-transcribed and labeled with Cy3 or Cy5 dye using the indirect labeling procedure. Dye bias was eliminated using dye switch labeling protocol. We then hybridized 1.5 μg of labeled cDNA with the 2x400k DNA chip (Agilent). The array was read using an Agilent G2505C DNA microarray scanner and the TIFF images extracted with the Agilent Feature Extraction software (version 10.5.1.1) using the 20bit coding ability. Data pre-treatment was applied on each result file to discard flagged spots by Feature Extraction software. The data were normalized without background subtraction by the global Lowess method performed with the Goulphar software [55]. For each experimental condition, the two file results were merged together. For each probe the hybridization ratio was linked to genome annotation coming from the DOE JGI website for a respective genome. The final ratio for each transcript was obtained by averaging the detected hybridization values from all probes located inside the coding sequence on the matching strand. Transcripts with no or only one probe marked as detected were discarded from further analysis. Finally we kept only transcript with a final hybridization ratio greater than log2 (ratio) = 1.5 or lower than log2 (ratio) = −1.5. The list of statistically significant differentially expressed genes was obtained by applying the linear modeling approach implemented in lmFit package for Python and the empirical Bayes statistics implemented by eBayes from the limma R package (http://bioinf.wehi.edu.au/limma/; [16]).
Gene identification
The genomes of T. reesei QM6a, T. atroviride IMI 206040 and T. virens Gv29-8 have been annotated [4] and were used as a source for identification of the genes found in this study. A gene was considered to encode a homologue of an already identified protein if it had the Expect value (E) in blastp of < e-100 with the next Sordariomycetes member. All unknown and orphan (unique) proteins were subjected to blastp search (May, 2012) to check whether any of them has been identified for another fungus since the Trichoderma annotations. Orphan proteins were defined as such that did not occur in any other Pezizomycotina with an E-value > e-20. All other proteins, for which no function could be predicted, were termed as unknown.
Statistical data evaluation
Statistical analyses of microarray data were performed using Statistica 6.1 (StatSoft, Inc., Tulsa, OK, USA). For this purpose the cumulative matrix has been assembled (Additional file 1: Table S1-S3). In this matrix every gene was considered as a case and the following grouping variable (predictors) were integrated: protein ID, gene annotation, species, protein family (Pfam), gene regulation (up-regulated/down-regulated), fold gene regulation prior, at and after the contact, and functional category (FunCat). Data were explored by means of descriptive statistics (mean values and standard deviations were calculated for each predictor). Hypotheses were tested using one-way main effects or factorial ANOVA analyses with post-hoc comparisons with Tukey honest significant difference tests (Tukey HSD).
Mycoparasitic potential
The antagonistic potential was evaluated for each species based on dual confrontation plate assay carried out as described for the RNA extraction, except the plate were not covered with cellophane. The evaluation of the plates was carried out after 10 days of incubation (see Figure 1) and the growth of Trichoderma against itself was set up as a zero inhibition rate. The growth inhibition of R. solani was calculated implying that the distance between the plugs of both fungi is 100%. The inhibition of growth was calculated as a percentage of Trichoderma growth subtracted for a correction of the growth against itself. Overgrowth of the prey was calculated similarly using the distance between the R. solani plug and the confrontation zone with Trichoderma as 100%, and the growth of Trichoderma over the R. solani mycelium was then calculated as a percentage of overgrowth.
Real Time PCR quantification of transcripts
T. atroviride and T. virens were cultivated and harvested as described for the microarrays. DNase treated (DNase I, RNase free; Fermentas) RNA (5 μg) was reverse transcribed with the RevertAid™ First Strand cDNA Kit (Fermentas) according to the manufacturer’s protocol with a combination of the provided oligo(dT) and random hexamer primers.
All real-time PCR experiments were performed on a Bio-Rad (Hercules, CA) iCycler IQ. For the reaction the IQ SYBR Green Supermix (Bio-Rad, Hercules, CA) was prepared for 25 μl assays with standard MgCl2 concentration (3 mM) and a final primer concentration of 100 nM each. Primers used are given in Additional file 1: Table S4. The amplification protocol consisted of an initial denaturation step (3 min at 95°C) followed by 40 cycles of denaturation (15 sec at 95°C), annealing (20 sec at 52 and 52.5°C for T. virens and T. atroviride respectively) and extension (72°C for 10 sec for both species). Tef1 gene which maintained constant over all conditions (± 20 relative %) was used as the normalizer. Determination of the PCR efficiency was performed using triplicate reactions from a dilution series of cDNA (1, 0.1, 10-2 and 10-3). Amplification efficiency was then calculated from the given slopes in the IQ5 Optical system Softwarev2.0. The qPCR were performed with the cDNA of 5 pooled biological replicates for each species and condition. Expression ratios were calculated using Livak test model [56] and are given in the Additional file 1: Table S4. Zero values for qPCR indicate the expression levels between |log2 (ratio)| > 1.5 as these were not treated as significantly regulated in the microarray analysis.
Competing interests
The authors declare that they have no competing interests.
Authors’ contributions
LA performed the experiments with Tr and Ta, carried out qPCR, did the statistical data evaluation, prepared some figures and supplementary materials and participated in ms writing. SLC and FC made microarrays. SG made experiments with Tv. VS participated in the design of the study and gene annotation. CPK and ISD designed the study, evaluated the data and wrote the manuscript. ISD prepared some figures and supplementary materials. All authors read and approved the manuscript.
Supplementary Material
List of Trichoderma reesei genes, which expression has been significantly changed in response to mycoparasitism to R. solani.Table S2. List of Trichoderma virens genes, which expression has been significantly changed in response to mycoparasitism to R. solani.Table S3. List of Trichoderma atroviride genes, which expression has been significantly changed in response to mycoparasitism to R. solani.Table S4. Real Time PCR quantification of selected genes.
Contributor Information
Lea Atanasova, Email: lea.atanasova@tuwien.ac.at.
Stephane Le Crom, Email: lecrom@biologie.ens.fr.
Sabine Gruber, Email: grubers@mail.tuwien.ac.at.
Fanny Coulpier, Email: culpier@biologie.ens.fr.
Verena Seidl-Seiboth, Email: vseidl@mail.tuwien.ac.at.
Christian P Kubicek, Email: ckubicek@mail.zserv.tuwien.ac.at.
Irina S Druzhinina, Email: irina.druzhinina@tuwien.ac.at.
Acknowledgements
This study was supported by Austrian Science Found (FWF): project number P21266 to CPK and 17895 to ISD. SLC and FC were supported by the Infrastrutures en Biologie Santé et Agronomie (IBISA). Authors are thankful to Dr. Ekaterina Shelest for valuable advises on bioinformatic data analysis, to Mrs. R. Karimi Aghcheh for providing qPCR primers for Ta and to Mr. A. Kopchinskiy for his aid in sequence annotation.
References
- Druzhinina IS, Seidl-Seiboth V, Herrera-Estrella A, Horwitz BA, Kenerley CM, Monte E, Mukherjee PK, Zeilinger S, Grigoriev IV, Kubicek CP. Trichoderma: the genomics of opportunistic success. Nat Rev Microbiol. 2011;9(10):749–759. doi: 10.1038/nrmicro2637. [DOI] [PubMed] [Google Scholar]
- Benítez T, Rincón AM, Limón MC, Codón AC. Biocontrol mechanisms of Trichoderma strains. Int Microbiol. 2004;7:249–260. [PubMed] [Google Scholar]
- Howell CR. Mechanisms employed by Trichoderma species in the biological control of plant diseases: the history and evolution of current concepts. Plant Dis. 2003;87:4–10. doi: 10.1094/PDIS.2003.87.1.4. [DOI] [PubMed] [Google Scholar]
- Kubicek CP, Herrera-Estrella A, Seidl-Seiboth V, Martinez DA, Druzhinina IS, Thon M, Zeilinger S, Casas-Flores S, Horwitz BA, Mukherjee PK, Mukherjee M, Kredics L, Alcaraz LD, Aerts A, Antal Z, Atanasova L, Cervantes-Badillo MG, Challacombe J, Chertkov O, McCluskey K, Coulpier F, Deshpande N, von Döhren H, Ebbole DJ, Esquivel-Naranjo EU, Fekete E, Flipphi M, Glaser F, Gómez-Rodríguez EY, Gruber S. Comparative genome sequence analysis underscores mycoparasitism as the ancestral life style of Trichoderma. Genome Biol. 2011;12(4):R40. doi: 10.1186/gb-2011-12-4-r40. [DOI] [PMC free article] [PubMed] [Google Scholar]
- Reithner B, Ibarra-Laclette E, Mach RL, Herrera-Estrella A. Identification of mycoparasitism-related genes in Trichoderma atroviride. Appl Environ Microbiol. 2011;77(13):4361–4370. doi: 10.1128/AEM.00129-11. [DOI] [PMC free article] [PubMed] [Google Scholar]
- Omann MR, Lehner S, Escobar Rodríguez C, Brunner K, Zeilinger S. The seven-transmembrane receptor Gpr1 governs processes relevant for the antagonistic interaction of Trichoderma atroviride with its host. Microbiology. 2012;158(Pt 1):107–118. doi: 10.1099/mic.0.052035-0. [DOI] [PMC free article] [PubMed] [Google Scholar]
- Catalano V, Vergara M, Hauzenberger JR, Seiboth B, Sarrocco S, Vannacci G, Kubicek CP, Seidl-Seiboth V. Use of a non-homologous end-joining-deficient strain (delta-ku70) of the biocontrol fungus Trichoderma virens to investigate the function of the laccase gene lcc1 in sclerotia degradation. Curr Genet. 2011;57(1):13–23. doi: 10.1007/s00294-010-0322-2. [DOI] [PMC free article] [PubMed] [Google Scholar]
- Liu PG, Yang Q. Identification of genes with a biocontrol function in Trichoderma harzianum mycelium using the expressed sequence tag approach. Res Microbiol. 2005;156(3):416–423. doi: 10.1016/j.resmic.2004.10.007. [DOI] [PubMed] [Google Scholar]
- Vizcaíno JA, Redondo J, Suárez MB, Cardoza RE, Hermosa R, González FJ, Rey M, Monte E. Generation, annotation, and analysis of ESTs from four different Trichoderma strains grown under conditions related to biocontrol. Appl Microbiol Biotechnol. 2007;75(4):853–862. doi: 10.1007/s00253-007-0885-0. [DOI] [PubMed] [Google Scholar]
- Suárez MB, Vizcaíno JA, Llobell A, Monte E. Characterization of genes encoding novel peptidases in the biocontrol fungus Trichoderma harzianum CECT 2413 using the TrichoEST functional genomics approach. Curr Genet. 2007;51:331–342. doi: 10.1007/s00294-007-0130-5. [DOI] [PubMed] [Google Scholar]
- Samolski I, de Luis A, Vizcaíno JA, Monte E, Suárez MB. Gene expression analysis of the biocontrol fungus Trichoderma harzianum in the presence of tomato plants, chitin, or glucose using a high-density oligonucleotide microarray. BMC Microbiol. 2009;9:217. doi: 10.1186/1471-2180-9-217. [DOI] [PMC free article] [PubMed] [Google Scholar]
- Liu Z, Yang X, Sun D, Song J, Chen G, Juba O, Yang Q. Expressed sequence tags-based identification of genes in a biocontrol strain Trichoderma asperellum. Mol Biol Rep. 2010;37(8):3673–3681. doi: 10.1007/s11033-010-0019-0. [DOI] [PubMed] [Google Scholar]
- Rubio MB, Hermosa R, Reino JL, Collado IG, Monte E. Thctf1 transcription factor of Trichoderma harzianum is involved in 6-pentyl-2H-pyran-2-one production and antifungal activity. Fungal Genet Biol. 2009;46(1):17–27. doi: 10.1016/j.fgb.2008.10.008. [DOI] [PubMed] [Google Scholar]
- Ogoshi A. Ecology and pathogenicity of anastomosis and intraspecific groups of Rhizoctonia solani Kuhn. Annu Rev Phytopathol. 1987;25:125–143. doi: 10.1146/annurev.py.25.090187.001013. [DOI] [Google Scholar]
- Dean R, VAN Kan JA, Pretorius ZA, Hammond-Kosack KE, DI Pietro A, Spanu PD, Rudd JJ, Dickman M, Kahmann R, Ellis J, Foster GD. The Top 10 fungal pathogens in molecular plant pathology. Mol Plant Pathol. 2012;13(4):414–430. doi: 10.1111/j.1364-3703.2011.00783.x. [DOI] [PMC free article] [PubMed] [Google Scholar]
- Smyth GK. Linear models and empirical Bayes methods for assessing differential expression in microarray experiments. Stat Appl Genet Mol Biol. 2004;3:Article 3. doi: 10.2202/1544-6115.1027. [DOI] [PubMed] [Google Scholar]
- Baker SE, Perrone G, Richardson NM, Gallo A, Kubicek CP. Phylogenomic analysis of polyketide synthase-encoding genes in Trichoderma. Microbiology. 2012;158(Pt 1):147–154. doi: 10.1099/mic.0.053462-0. [DOI] [PubMed] [Google Scholar]
- Seiboth B, Aghcheh RK, Phatale PA, Linke R, Hartl L, Sauer DG, Smith KM, Baker SE, Freitag M, Kubicek CP. The putative protein methyltransferase LAE1 controls cellulase gene expression in Trichoderma reesei. Mol Microbiol. 2012;84(6):1150–1164. doi: 10.1111/j.1365-2958.2012.08083.x. [DOI] [PMC free article] [PubMed] [Google Scholar]
- Lorito M, Woo SL, Harman GE, Monte E. Translational research on Trichoderma: from 'omics to the field. Annu Rev Phytopathol. 2010;48:395–417. doi: 10.1146/annurev-phyto-073009-114314. [DOI] [PubMed] [Google Scholar]
- Seidl V, Song LF, Lindquist EA, Gruber S, Koptchinskiy A, Zeilinger S, Schmoll M, Martinez P, Sun J, Grigoriev I, Herrera-Estrella A, Baker SE, Kubicek CP. Transcriptomic response of the mycoparasitic fungus Trichoderma atroviride to the close presence of a fungal prey. BMC Genomics. 2009;10:567. doi: 10.1186/1471-2164-10-567. [DOI] [PMC free article] [PubMed] [Google Scholar]
- Rossmann AY, Samuels GJ, Rogerson CT, Lowen R. Genera of Bionectriaceae, Hypocreaceae and Nectriaceae (Hypocreales, Ascomycetes) Stud Mycol. 1999;42:1–83. [Google Scholar]
- Stricker AR, Grosstessner-Hain K, Würleitner E, Mach RL. Xyr1 (xylanase regulator 1) regulates both the hydrolytic enzyme system and D-xylose metabolism in Hypocrea jecorina. Eukaryot Cell. 2006;5(12):2128–2137. doi: 10.1128/EC.00211-06. [DOI] [PMC free article] [PubMed] [Google Scholar]
- Patron NJ, Waller RF, Cozijnsen AJ, Straney DC, Gardiner DM, Nierman WC, Howlett BJ. Origin and distribution of epipolythiodioxopiperazine (ETP) gene clusters in filamentous ascomycetes. BMC Evol Biol. 2007;7:174. doi: 10.1186/1471-2148-7-174. [DOI] [PMC free article] [PubMed] [Google Scholar]
- Wilhite SE, Lumsden RD, Straney DC. Mutational analysis of gliotoxin production by the biocontrol fungus Gliocladium virens in relation to suppression of Pythium damping-off. Phytopathology. 1994;84:816–821. doi: 10.1094/Phyto-84-816. [DOI] [Google Scholar]
- Lumsden RD, Locke JC. Biological control of damping-off caused by Pythium ultimum and Rhizoctonia solani with Gliocladium virens in soilless mix. Phytopathology. 1989;79:361–366. doi: 10.1094/Phyto-79-361. [DOI] [Google Scholar]
- Lumsden RD, Locke JC, Adkins ST, Walter JF, Ridout CJ. Isolation and localization of the antibiotic gliotoxin produced by Gliocladium virens from alginate prill in soil and soilless media. Phytopathology. 1992;82:230–235. doi: 10.1094/Phyto-82-230. [DOI] [Google Scholar]
- Wilhite SE, Straney DC. Timing of gliotoxin biosynthesis in the fungal biological control agent Gliocladium virens (Trichoderma virens) Appl Microbiol Biotechnol. 1996;45:513–518. [Google Scholar]
- Kumar A, Paietta JV. The sulfur controller-2 negative regulatory gene of Neurospora crassa encodes a protein with beta-transducin repeats. Proc Natl Acad Sci U S A. 1995;92(8):3343–3347. doi: 10.1073/pnas.92.8.3343. [DOI] [PMC free article] [PubMed] [Google Scholar]
- Helmstaedt K, Strittmatter A, Lipscomb WN, Braus GH. Evolution of 3-deoxy-D-arabino-heptulosonate-7-phosphate synthase-encoding genes in the yeast Saccharomyces cerevisiae. Proc Natl Acad Sci U S A. 2005;102:9784–9789. doi: 10.1073/pnas.0504238102. [DOI] [PMC free article] [PubMed] [Google Scholar]
- Seidl V, Gamauf C, Druzhinina IS, Seiboth B, Hartl L, Kubicek CP. The Hypocrea jecorina (Trichoderma reesei) hypercellulolytic mutant RUT C30 lacks a 85 kb (29 gene-encoding) region of the wild-type genome. BMC Genomics. 2008;11(9):327. doi: 10.1186/1471-2164-9-327. [DOI] [PMC free article] [PubMed] [Google Scholar]
- Reino JL, Guerrero RF, Hernández-Galan R, Collado IG. Secondary metabolites from species of the biocontrol agent Trichoderma. Phytochem Rev. 2008;7:89–123. [Google Scholar]
- Serrano-Carreon L, Hathout Y, Bensoussan M, Belin JM. Metabolism of Linoleic Acid or Mevalonate and 6-Pentyl-α-Pyrone Biosynthesis by Trichoderma Species. Appl Environ Microbiol. 1993;59:2945–2950. doi: 10.1128/aem.59.9.2945-2950.1993. [DOI] [PMC free article] [PubMed] [Google Scholar]
- Mukherjee PK, Horwitz BA, Kenerley CM. Secondary metabolism in Trichoderma - a genomic perspective. Microbiol. 2012;158:35–45. doi: 10.1099/mic.0.053629-0. [DOI] [PubMed] [Google Scholar]
- Kulkarni RD, Thon MR, Pan H, Dean RA. Novel G-protein-coupled receptor-like proteins in the plant pathogenic fungus Magnaporthe grisea. Genome Biol. 2005;6(3):R24. doi: 10.1186/gb-2005-6-3-r24. [DOI] [PMC free article] [PubMed] [Google Scholar]
- Muthumeenakshi S, Sreenivasaprasad S, Rogers CW, Challen MP, Whipps JM. Analysis of cDNA transcripts from Coniothyrium minitans reveals a diverse array of genes involved in key processes during sclerotial mycoparasitism. Fungal Genet Biol. 2007;44(12):1262–1284. doi: 10.1016/j.fgb.2007.07.011. [DOI] [PubMed] [Google Scholar]
- Gronover CS, Schumacher J, Hantsch P, Tudzynski B. A novel seven-helix transmembrane protein BTP1 of Botrytis cinerea controls the expression of GST-encoding genes, but is not essential for pathogenicity. Mol Plant Pathol. 2005;6(3):243–256. doi: 10.1111/j.1364-3703.2005.00278.x. [DOI] [PubMed] [Google Scholar]
- Xiong S, Fan J, Kitazato K. The antiviral protein cyanovirin-N: the current state of its production and applications. Appl Microbiol Biotechnol. 2010;86(3):805–812. doi: 10.1007/s00253-010-2470-1. [DOI] [PubMed] [Google Scholar]
- Neethling D, Nevalainen H. Mycoparasitic species of Trichoderma produce lectins. Can J Microbiol. 1996;42(2):141–146. doi: 10.1139/m96-022. [DOI] [PubMed] [Google Scholar]
- Plett JM, Martin F. Poplar root exudates contain compounds that induce the expression of MiSSP7 in Laccaria bicolor. Plant Signal Behav. 2012;7(1):12–15. doi: 10.4161/psb.7.1.18357. [DOI] [PMC free article] [PubMed] [Google Scholar]
- Papapostolou I, Georgiou CD. Superoxide radical induces sclerotial differentiation in filamentous phytopathogenic fungi: a superoxide dismutase mimetics study. Microbiol. 2010;156:960–966. doi: 10.1099/mic.0.034579-0. [DOI] [PubMed] [Google Scholar]
- Aliferis KA, Jabaji S. Metabolite composition and bioactivity of Rhizoctonia solani sclerotial exudates. J Agric Food Chem. 2010;58:7604–7615. doi: 10.1021/jf101029a. [DOI] [PubMed] [Google Scholar]
- Ruocco M, Lanzuise S, Vinale F, Marra R, Turrà D, Woo SL, Lorito M. Identification of a new biocontrol gene in Trichoderma atroviride: the role of an ABC transporter membrane pump in the interaction with different plant-pathogenic fungi. Mol Plant Microbe Interact. 2009;22:291–301. doi: 10.1094/MPMI-22-3-0291. [DOI] [PubMed] [Google Scholar]
- Basile LJ, Willson RC, Sewell BT, Benedik MJ. Genome mining of cyanide-degrading nitrilases from filamentous fungi. Appl Microbiol Biotechnol. 2008;80:427–435. doi: 10.1007/s00253-008-1559-2. [DOI] [PubMed] [Google Scholar]
- Michelsen CF, Stougaard P. Hydrogen cyanide synthesis and antifungal activity of the biocontrol strain Pseudomonas fluorescens In5 from Greenland is highly dependent on growth medium. Can J Microbiol. 2011;58:381–390. doi: 10.1139/w2012-004. [DOI] [PubMed] [Google Scholar]
- Palmer JM, Keller NP. Secondary metabolism in fungi: does chromosomal location matter? Curr Opin Microbiol. 2010;13:431–436. doi: 10.1016/j.mib.2010.04.008. [DOI] [PMC free article] [PubMed] [Google Scholar]
- Martinez D, Berka RM, Henrissat B, Saloheimo M, Arvas M, Baker SE, Chapman J, Chertkov O, Coutinho PM, Cullen D, Danchin EG, Grigoriev IV, Harris P, Jackson M, Kubicek CP, Han CS, Ho I, Larrondo LF, de Leon AL, Magnuson JK, Merino S, Misra M, Nelson B, Putnam N, Robbertse B, Salamov AA, Schmoll M, Terry A, Thayer N, Westerholm-Parvinen A. Genome sequencing and analysis of the biomass-degrading fungus Trichoderma reesei (syn. Hypocrea jecorina) Nat Biotechnol. 2008;26:553–560. doi: 10.1038/nbt1403. [DOI] [PubMed] [Google Scholar]
- Metz B, Seidl-Seiboth V, Haarmann T, Kopchinskiy A, Lorenz P, Seiboth B, Kubicek CP. Expression of biomass-degrading enzymes is a major event during conidium development in Trichoderma reesei. Eukaryot Cell. 2011;10(11):1527–1535. doi: 10.1128/EC.05014-11. [DOI] [PMC free article] [PubMed] [Google Scholar]
- Cuomo CA, Güldener U, Xu JR, Trail F, Turgeon BG, Di Pietro A, Walton JD, Ma LJ, Baker SE, Rep M, Adam G, Antoniw J, Baldwin T, Calvo S, Chang YL, Decaprio D, Gale LR, Gnerre S, Goswami RS, Hammond-Kosack K, Harris LJ, Hilburn K, Kennell JC, Kroken S, Magnuson JK, Mannhaupt G, Mauceli E, Mewes HW, Mitterbauer R, Muehlbauer G. The Fusarium graminearum genome reveals a link between localized polymorphism and pathogen specialization. Science. 2007;317:1400–1402. doi: 10.1126/science.1143708. [DOI] [PubMed] [Google Scholar]
- Kasuga T, Mannhaupt G, Glass NL. Relationship between phylogenetic distribution and genomic features in Neurospora crassa. PLoS One. 2009;4:e5286. doi: 10.1371/journal.pone.0005286. [DOI] [PMC free article] [PubMed] [Google Scholar]
- Strauss J, Reyes-Dominguez Y. Regulation of secondary metabolism by chromatin structure and epigenetic codes. Fungal Genet Biol. 2011;48:62–69. doi: 10.1016/j.fgb.2010.07.009. [DOI] [PMC free article] [PubMed] [Google Scholar]
- Bayram O, Braus GH. Coordination of secondary metabolism and development in fungi: the velvet family of regulatory proteins. FEMS Microbiol Rev. 2012;36(1):1–24. doi: 10.1111/j.1574-6976.2011.00285.x. [DOI] [PubMed] [Google Scholar]
- Mukherjee PK, Kenerley CM. Regulation of morphogenesis and biocontrol properties in Trichoderma virens by a VELVET protein, Vel1. Appl Environ Microbiol. 2010;76(7):2345–2352. doi: 10.1128/AEM.02391-09. [DOI] [PMC free article] [PubMed] [Google Scholar]
- Chirgwin JM, Przybyla AE, MacDonald RJ, Rutter WJ. Isolation of biologically active ribonucleic acid from sources enriched in ribonuclease. Biochemistry. 1979;18(24):5294–5299. doi: 10.1021/bi00591a005. [DOI] [PubMed] [Google Scholar]
- Jourdren L, Duclos A, Brion C, Portnoy T, Mathis H, Margeot A, Le Crom S. Teolenn: an efficient and customizable workflow to design high-quality probes for microarray experiments. Nucleic Acids Res. 2010;38:e117. doi: 10.1093/nar/gkq110. [DOI] [PMC free article] [PubMed] [Google Scholar]
- Lemoine S, Combes F, Servant N, Le Crom S. Goulphar: Rapid access and expertise for standard two-color microarray normalization methods. BMC Bioinformatics. 2006;7:467. doi: 10.1186/1471-2105-7-467. [DOI] [PMC free article] [PubMed] [Google Scholar]
- Livak KJ, Schmittgen TD. Analysis of relative gene expression data using real-time quantitative PCR and the 2(−Delta Delta C(T)) Method. Methods. 2001;25(4):402–408. doi: 10.1006/meth.2001.1262. [DOI] [PubMed] [Google Scholar]
Associated Data
This section collects any data citations, data availability statements, or supplementary materials included in this article.
Supplementary Materials
List of Trichoderma reesei genes, which expression has been significantly changed in response to mycoparasitism to R. solani.Table S2. List of Trichoderma virens genes, which expression has been significantly changed in response to mycoparasitism to R. solani.Table S3. List of Trichoderma atroviride genes, which expression has been significantly changed in response to mycoparasitism to R. solani.Table S4. Real Time PCR quantification of selected genes.