

Abstract
Background
Metabolic syndrome (coexisting visceral obesity, dyslipidemia, hyperglycemia, and hypertension) is a prominent risk factor for cardiovascular morbidity and mortality, however, its effect on cardiac gene expression pattern is unclear. Therefore, we examined the possible alterations in cardiac gene expression pattern in male Zucker Diabetic Fatty (ZDF) rats, a model of metabolic syndrome.
Methods
Fasting blood glucose, serum insulin, cholesterol and triglyceride levels were measured at 6, 16, and 25 wk of age in male ZDF and lean control rats. Oral glucose tolerance test was performed at 16 and 25 wk of age. At week 25, total RNA was isolated from the myocardium and assayed by rat oligonucleotide microarray for 14921 genes. Expression of selected genes was confirmed by qRT-PCR.
Results
Fasting blood glucose, serum insulin, cholesterol and triglyceride levels were significantly increased, glucose tolerance and insulin sensitivity were impaired in ZDF rats compared to leans. In hearts of ZDF rats, 36 genes showed significant up-regulation and 49 genes showed down-regulation as compared to lean controls. Genes with significantly altered expression in the heart due to metabolic syndrome includes functional clusters of metabolism (e.g. 3-hydroxy-3-methylglutaryl-Coenzyme A synthase 2; argininosuccinate synthetase; 2-amino-3-ketobutyrate-coenzyme A ligase), structural proteins (e.g. myosin IXA; aggrecan1), signal transduction (e.g. activating transcription factor 3; phospholipase A2; insulin responsive sequence DNA binding protein-1) stress response (e.g. heat shock 70kD protein 1A; heat shock protein 60; glutathione S-transferase Yc2 subunit), ion channels and receptors (e.g. ATPase, (Na+)/K+ transporting, beta 4 polypeptide; ATPase, H+/K+ transporting, nongastric, alpha polypeptide). Moreover some other genes with no definite functional clusters were also changed such as e.g. S100 calcium binding protein A3; ubiquitin carboxy-terminal hydrolase L1; interleukin 18. Gene ontology analysis revealed several significantly enriched functional inter-relationships between genes influenced by metabolic syndrome.
Conclusions
Metabolic syndrome significantly alters cardiac gene expression profile which may be involved in development of cardiac pathologies in the presence of metabolic syndrome.
Keywords: Metabolic syndrome, Diabetes mellitus type 2, Hyperlipidemia, Myocardium, DNA microarray, Heart, GO analysis
Introduction
It is well established that metabolic syndrome is a major risk factor for cardiovascular diseases [1-4]. Metabolic syndrome is defined as the coexistence of visceral obesity, dyslipidemia, hyperglycemia, and hypertension [5,6]. Most individuals with metabolic syndrome have abdominal obesity and develop insulin resistance, therefore the prevalence of metabolic syndrome and pre-diabetes overlap [7,8]. In addition, metabolic syndrome can be considered as a direct precursor state of diabetes mellitus type 2 [7,9] and cardiovascular diseases [7,10]. Moreover, the efficacy of cardioprotective interventions (i.e. pre- and postconditioning) seems to be diminished in the presence of pathological conditions associated with metabolic syndrome [11-13] such as obesity [14], diabetes [15-18] or dyslipidemia [19,20]. Metabolic syndrome affects a large population including all ages from children to elderly and both sexes worldwide [21-23]. According to the Third National Health and Nutrition Examination Survey (NHANES III) criteria, about 47 million people (approximately 24% of the US adult population) had metabolic syndrome in the USA in 2002 [24]. Its prevalence is raising both in developed [21,24], and in developing countries [21,24]. In addition, patients suffering from metabolic syndrome have an approximate 5-fold increase in diabetes risk compared with persons without metabolic syndrome [7,25]. The effect of metabolic syndrome on gene expression pattern in various tissue types has been investigated in a few studies. In insulin sensitive tissues (liver, skeletal muscle and adipose tissue) [26] and pancreatic β-cells [27] obtained from the well-known metabolic syndrome model (Zucker Diabetic Fatty rat, ZDF), altered gene expression pattern were shown when compared to their controls. However, the effect of metabolic syndrome on the gene expression pattern of the heart has not been investigated yet.
Therefore, our aim was in the present study to investigate the effect of metabolic syndrome on cardiac gene expression pattern in male ZDF rats.
Materials and methods
This investigation conforms to the National Institutes of Health Guide for the Care and Use of Laboratory Animals (NIH Pub. No. 85-23, Revised 1996) and was approved by the Animal Research Ethics Committee of the University of Szeged.
Male Zucker Diabetic Fatty (ZDF/Gmi-fa/fa) rats and their lean controls were obtained from Charles River Laboratories at the age of 5 weeks and were housed at 22±2°C with a 12:12-h light-dark cycle. The rats received Purina 5008 chow and water ad libitum for 20 weeks after their arrival.
The Zucker diabetic fatty (ZDF) rat with a point mutation in the leptin receptor is a recognized model of obesity, hyperlipidemia, hyperglycemia and hypertension [28-30]. In the present study, only male rats were used, since female ZDF rats are less prone to the development of metabolic syndrome [31,32]. Male ZDF rats develop an age-dependent obese and hyperglycemic phenotype at 10-12 weeks of age accompanied by a metabolic state of obesity, dyslipidemia, hyperinsulinemia and insulin resistance [33,34] which develops to a hyperglycemic insulin-deficient state [33]. The metabolic features manifested in this animal model are in many ways similar to the pathogenesis of metabolic syndrome in humans [33,35]. Therefore, the ZDF rat is an ideal model for investigation of cardiac gene expression pattern changes related to human metabolic syndrome.
Experimental setup
Body weight, serum glucose, insulin, cholesterol and triglyceride levels and homeostasis model assessment-estimated insulin resistance (HOMA-IR) were determined at 6, 16 and 25 weeks of age in order to monitor the basic parameters of glucose and lipid metabolism and insulin resistance in ZDF and lean rats (Figure 1). Oral glucose tolerance test (OGTT) was performed at week 16 and 25 in order to further characterize glucose homeostasis in ZDF and lean rats (Figure 1). At 25 weeks of age, rats were anaesthetized using diethyl ether. Hearts and pancreata were isolated (Figure 1), and then hearts were perfused according to Langendorff as described earlier [36]. After 10 min perfusion ventricular tissue was frozen and stored at -80°C until DNA microarray investigation and gene expression analysis (Figure 1). To validate the well-known nitrosative stress-inducing effect of metabolic syndrome on the heart, frozen ventricular tissue was used for determination of cardiac free 3-nitrotyrosine level (Figure 1).
Figure 1.

Experimental protocol (A) Male Zucker Diabetic Fatty (ZDF) rats and their lean controls were followed up from 6 weeks of age until 25 weeks of age. Body weight (BW), serum glucose (Se Glu), insulin (Insulin), cholesterol (Chol) and triglyceride (TG) levels were determined at week 6, 16 and 25. Oral glucose tolerance test (OGTT) was performed at week 16 and 25. At week 25, hearts and pancreata were isolated. Pancreata were frozen and homogenized to measure pancreatic insulin levels. Hearts were perfused according to Langendorff for 10 minutes using Krebs-Henseleit buffer. Then ventricular tissue was frozen and used for DNA microarray analysis and cardiac free 3-nitrotyrosine level measurements. Serum glucose (B, n=6-8) and insulin levels (C, n=6-8), HOMA-IR (D), animal weight (E), serum cholesterol (F, n=6-8) and triglyceride (G, n=6-8) shown at week 6, 16 and 25 in both lean and ZDF rats. Solid line: Lean; dashed line: ZDF. Values are means±SEM, *p<0.05.
Serum glucose level measurements and OGTT
Rats were fasted overnight (12 h) prior to serum glucose level measurements (week 6, 16 and 25) and OGTTs (week16 and 25) to verify the development of hyperglycemia as a diagnostic criterion of metabolic syndrome. Blood samples were collected from the v. saphena. Blood glucose levels were measured using AccuCheck blood glucose monitoring systems (Roche Diagnostics Corporation, USA, Indianapolis). In case of OGTT, after the measurement of baseline glucose concentrations, a standard dose of glucose (1.5 g/kg body weight) was administered per os via gavage and plasma glucose levels were checked 30, 60 and 120 minutes later. Area under the curve values for OGTT was also calculated.
Measurement of serum and pancreatic insulin levels
Serum and pancreatic insulin levels were measured by an enzyme immunoassay (Mercodia, Ultrasensitive Rat Insulin ELISA) in order to verify the development of hyperinsulinemia and decreased pancreatic insulin content as a consequence of beta cell damage in metabolic syndrome. Insulin ELISA was carried out according to the instructions of the manufacturer from either sera or homogenized pancreatic tissue samples of ZDF and lean control rats. Sera were centrifuged (4500 rpm for 10 min at 4°C) and kept at -20°C until further investigation. Pancreata were removed, trimmed free of adipose tissue and weighed. Pancreata were homogenized in 6 ml cold acidified-ethanol (0.7 M HCl: ethanol (1:3 v/v) with an Ultraturrax homogenizer and were kept at 4°C for 24 h. Then pancreas homogenates were centrifuged (900 g for 15 min at 4°C), and the supernatants were stored at 4°C. The pellet was extracted again with 3 ml acidified ethanol for 24 h at 4°C. The supernatant obtained after centrifugation was pooled with the previous one and kept at -20°C until assayed.
HOMA-IR index
To estimate insulin resistance in ZDF or lean rats the widely used HOMA-IR index was calculated [37-39] by multiplying fasting plasma insulin (μIU/mL) with fasting plasma glucose (mmol/L), then dividing by the constant 22.5, i.e. HOMA-IR = (fasting plasma insulin concentration×fasting plasma glucose concentration)/22.5.
Measurement of serum lipid levels
Serum cholesterol and triglyceride levels were measured at week 6, 16 and 25 using a test kit supplied by Diagnosticum Zrt. (Budapest, Hungary) as described previously [40] in order to follow up the development of hyperlipidemia which is a diagnostic criterion of metabolic syndrome.
Cardiac 3-nitrotyrosine level, an indicator of myocardial nitrosative stress
To verify the well-known increased oxidative/nitrosative stress [41,42] in the heart in metabolic syndrome, cardiac free 3-nitrotyrosine level, an indirect marker of nitrosative stress, was measured by ELISA (Cayman Chemical) from ZDF and lean control heart tissue samples at week 25 as described earlier [40]. Briefly, supernatants of ventricular tissue homogenates were incubated overnight with anti-nitrotyrosine rabbit IgG specific to free 3-nitrotyrosine and nitrotyrosine acetylcholinesterase tracer in precoated (mouse anti-rabbit IgG) microplates followed by development with Ellman's reagent. Free nitrotyrosine content was normalized to protein content of the cardiac homogenate and expressed as nanograms per milligram protein [40].
RNA preparation
Total RNA was purified from whole heart of Zucker Diabetic Fatty (ZDF) and lean control rats (n=6-8 in each group) using an RNA isolation kit (Macherey-Nagel, Düren, Germany). All the preparation steps were carried out according to the manufacturer’s instructions. RNA samples were stored at –80°C in the presence of 30 U Prime RNAse inhibitor (Fermentas, Lithuania) untill further analysis. The quantity of isolated RNA samples was checked by spectrophotometry (NanoDrop 3.1.0, Rockland, DE, USA).
DNA microarray analysis
Total RNAs (1 μg) were first reverse transcribed in 10 μl volume using Oligo(dT) Primer and ArrayScript enzyme as described previously [43]. Than the second cDNA strand was synthesized in 50 μl final volume using DNA Polymerase and RNase H. Amino allyl modified aRNA were than synthesized by In Vitro Transcription using aaUTP and T7 Enzyme mix. All these steps were done using AminoAllyl MessageAmpTM II aRNA Amplification Kit (Ambion, USA), according to manufacturer’s instructions. Six μg of amino allyl modified amplified RNA were labeled with either Cy5 or Cy3 dyes in 10 μl volume according to the manufacturer’s instructions (Ambion, USA), than purified using RNA purification columns (Macherey Nagel, Düren, Germany).
Rat microarray of 8-plex format from Agilent Technologies (Palo Alto, CA, USA) was used to determine gene expression changes in the hearts of ZDF rats compared to lean controls. Each matrix contains ~15.000 oligonucleotides corresponding to different genes and control sequences. 300 ng of Cy5 and Cy3 labeled RNA in 19 μl volume, 5 μl 10X Blocking Agent and 1 μl 25X Fragmentation Buffer were mixed together and incubated at 60°C for 30 minutes. 25 μl 2X GEx Hybridization Buffer were added to each sample, to stop the fragmentation reaction. All these steps were done using Gene expression hybridization kit (Agilent Technologies, Palo Alto, CA). 48 μl of these mixes were used for the hybridization, which was done in microarray hybridization chambers (Agilent Technologies, Palo Alto, CA). The chambers were then loaded into a hybridization rotator rack (~5 rpm) and incubated at 65°C for 17 hours. After hybridization the slides were washed in Wash buffer 1 from Agilent Technologies at room temperature for 1 minute than in Wash buffer 2 at 37°C for another 1 minutes before scanning. Each array was scanned at 543 nm (for Cy3 labeling) or at 633 nm (for Cy5 labeling) in Agilent Scanner using the built-in Extended Dynamic Range function with 5 μm resolution. Output image analysis and feature extraction was done using Feature Extraction 9.5.1 software of Agilent Technologies.
Quantitative real-time PCR (QRT-PCR)
In order to validate gene expression changes obtained by DNA microarray, QRT-PCR was performed on a RotorGene 3000 instrument (Corbett Research, Sydney, Australia) with gene-specific primers and SybrGreen protocol to monitor gene expression as described earlier [44,45]. Briefly, 2 μg of total RNA was reverse transcribed using the High-Capacity cDNA Archive Kit (Applied Biosystems Foster City, CA, USA) according to the manufacturer’s instructions in a final volume of 30 μL. After dilution with 30 μL of water, 1 μL of the diluted reaction mix was used as template in the QRT- PCR with FastStart SYBR Green Master mix (Roche Applied Science, Mannheim, Germany) with the following protocol: 10 min at 95°C followed by 45 cycles of 95°C for 15 sec, 60°C for 25 sec and 72°C for 25 sec. The fluorescence intensity of SybrGreen dye was detected after each amplification step. Melting temperature analysis was done after each reaction to check the quality of the products. Primers were designed using the online Roche Universal Probe Library Assay Design Center. The quality of the primers was verified by MS analysis provided by Bioneer (Daejeon, Korea). Relative expression ratios were calculated as normalized ratios to rat HPRT, GAPDH and Cyclophyllin genes. Non-template control sample was used for each PCR run to check primer-dimer formation. The final relative gene expression ratios were calculated as delta-delta Ct values. Fold change refers to 2-ΔΔCt (in the case of up-regulated genes) and –(1/2-ΔΔCt) (in the case of down-regulated genes).
Gene ontology (GO) analysis
By using DNA microarrays for transcriptional profiling a large number of genes can be analyzed simultaneously [46], however, resulting data do not give direct information about biological interaction of the differentially expressed genes. GO analysis is a suitable method for integration genes with pathways and biological interaction networks to detect coordiated changes in functionally related genes. GO analysis was performed using GO/pathway analysis using the open access software DAVID bioinformatics system and database (Database for Annotation, Visualization and Integrated Discovery, http://david.abcc.ncifcrf.gov). The differentially expressed genes were submitted to DAVID bioinformatics system and database to reveal significantly enriched biological functions/pathways.
Statistical analysis
For characterization of the ZDF model and lean controls, all values (body weight, serum glucose, insulin, HOMA-IR, cholesterol and triglyceride levels, pancreas weight and insulin content and myocardial 3-nitrotyrosine levels) are presented as mean±SEM. Significance between groups was determined with two sample t-test. P<0.05 was accepted as a statistically significant difference.
In the microarray experiments, dye swap parallel labeling was applied to eliminate dye induced biases. Biological and technical replica experiments were carried out to gain raw data for statistical analysis. Altogether 4 individual parallel gene activity comparisons were done. Statistical analysis was performed to get reliable data. Using two tailed two sample unequal variance Student t-test, the p-value was determined and used to find the significant gene expression changes. Gene expression ratio with p- value < 0.05 and log2 ratio < -0.75 or log2 ratio > 0.75 (~1.7 fold change) are considered as repression or overexpression respectively in gene activity.
Results
Characterization of metabolic syndrome
In order to verify the development of metabolic syndrome in male ZDF rats, concentrations of several plasma metabolites and body weight were measured at week 6, 16 and 25 (Figure 1). ZDF rats showed a significant rise in serum fasting glucose level starting from week 16 as compared to lean controls (Figure 1B). Parallel with hyperglycemia, serum insulin levels were significantly increased in ZDF rats compared to lean ones during the 25 weeks showing the presence of hyperinsulinemia in ZDF animals (Figure 1C). However, serum insulin concentration in ZDF rats was significantly lower at week 25 as compared to serum insulin level measured at week 16 indicating beta-cell damage. HOMA IR was significantly higher at week 6, 16 and 25 in ZDF rats when compared to lean controls showing insulin resistance in ZDF animals (Figure 1D). Body weight increased throughout the study and was significantly higher in ZDF animals compared to lean ones showing obesity (Figure 1E). Both serum cholesterol and triglyceride levels were significantly increased in ZDF rats as compared to lean ones throughout the study duration representing hyperlipidemia (Figure 1F and 1G). Oral glucose tolerance test (OGTT) was performed at week 16 and 25 in order to verify the development of impaired glucose tolerance in ZDF rats. Glucose levels during OGTTs were markedly increased in ZDF rats in every time point of blood glucose measurements both at weeks 16 and 25 (Figure 2A- 2B). Area under the curve (AUC) of blood glucose concentration during OGTTs was significantly elevated in ZDF rats at both weeks 16 and 25 (1520±96 vs. 757±13 and 2692±129 vs. 741±21, respectively) representing impaired glucose tolerance.
Figure 2.
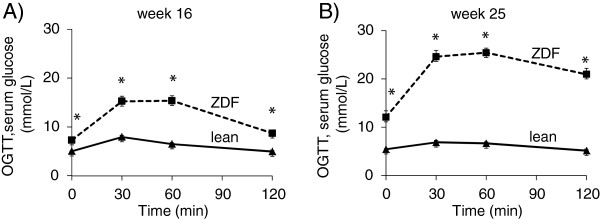
Glucose levels during OGTT. Glucose levels during OGTT at week 16 (A) and week 25 (B) in both lean and ZDF rats. Solid line: Lean; dashed line: ZDF. Values are means±SEM, n=6-8, *p<0.05.
Pancreas weight and pancreatic insulin content were measured at the end of the experiment in order to investigate the severity of diabetes mellitus in ZDF rats. Pancreas weight and pancreatic insulin concentration were significantly decreased in ZDF rats at week 25 showing impaired pancreatic function (Figure 3A and 3B).
Figure 3.
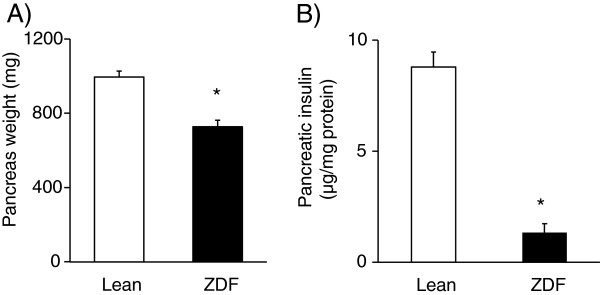
Pancreas weight and pancreas insulin content. Pancreas weight (A) at week 25 and pancreatic insulin content (B) in both lean and ZDF rats. Values are means±SEM, n=6-8, *p<0.05.
In order to verify the increased oxidative/nitrosative stress in ZDF animals, myocardial 3-nitrotyrosine levels were determined in both groups at week 25. A marker molecule of peroxynitrite, 3-nitrotyrosine level was significantly elevated in the heart of ZDF animals showing increased cardiac oxidative/nitrosative stress (Figure 4).
Figure 4.

Myocardial 3-nitrotyrosine level. Myocardial 3-nitrotyrosine level at week 25 in both lean and ZDF rats. Values are means±SEM, *p<0.05.
Gene expression profiles measured using cDNA microarrays and by qRT-PCR
Among the 14921 genes surveyed, 10244 genes were expressed on the cDNA microarray, and 85 genes whose expression was > ~1.7-fold up- or down-regulated (log2 ratio <-0.75 or log2 ratio >0.75) in hearts of ZDF rats relative to levels of lean control rats showed significant change in expression. According to our results, 49 genes showed down-regulation (Table 1) and 36 genes showed up-regulation in hearts of ZDF rats (Table 2). The expression change of selected 23 genes was validated by qRT-PCR (Table 3 and 4), 18 of these 23 genes have been confirmed by qRT-PCR (Table 3). Most of these genes have not been shown to be involved in the development of cardiovascular complications of metabolic syndrome yet.
Table 1.
Down-regulated genes on DNA microarray
| Gene function | Description [Gene symbol] | Acc. No.: | AVE log2 | SD | P value | Fold change |
|---|---|---|---|---|---|---|
|
Metabolism |
Argininosuccinate synthetase [Ass] |
NM_013157 |
−1.33 |
0.06 |
0.001 |
−2.51 |
| Glycine C-acetyltransferase (2-amino-3-ketobutyrate-coenzyme A ligase) [Gcat] |
NM_001024277 |
−1.15 |
0.34 |
0.006 |
−2.22 |
|
| 3-hydroxybutyrate dehydrogenase, type 1 [Bdh1] |
NM_053995 |
−1.14 |
0.44 |
0.014 |
−2.21 |
|
| Thymidylate synthase [Tyms] |
NM_019179 |
−0.92 |
0.08 |
0.041 |
−1.89 |
|
| Dicarbonyl L-xylulose reductase [Dcxr] |
NM_134387 |
−0.76 |
0.30 |
0.015 |
−1.70 |
|
|
Stress response |
Heat shock 70kd protein 1A [Hspa1a] |
NM_031971 |
−1.84 |
0.48 |
0.005 |
−3.59 |
| Similar to 60 kDa heat shock protein, mitochondrial precursor (Hsp60) 60 kda heat shock protein [LOC294396] |
XR_085659 |
−1.64 |
0.24 |
0.057 |
−3.11 |
|
| Interleukin 18 [il18] |
NM_019165 |
−1.38 |
0.02 |
0.007 |
−2.60 |
|
|
Signal transduction, regulation of transcription |
Hairy/anhancer-of-split-related with YRPW motif2 [Hey2] |
NM_130417 |
−1.40 |
0.15 |
0.049 |
−2.64 |
| Aryl hydrocarbon receptor nuclear translocator-like [Adra1d] |
NM_024362 |
−1.33 |
0.07 |
0.001 |
−2.52 |
|
| Activating transcription factor 3 [Atf3] |
NM_012912 |
−1.03 |
0.26 |
0.004 |
−2.05 |
|
| RAB7, member RAS oncogene family [Rab7] |
NM_023950 |
−0.98 |
0.48 |
0.026 |
−1.97 |
|
| B-cell leukemia/lymphoma 2 related protein A1 [Bcl2a1] |
NM_133416 |
−0.89 |
0.04 |
0.019 |
−1.85 |
|
| Sushi, nidogen and EGF-like domains 1 [Sned1] |
XM_237415 |
−0.87 |
0.51 |
0.041 |
−1.83 |
|
| Spermatid perinuclear RNA binding protein [Strbp] |
NM_053416 |
−0.87 |
0.25 |
0.027 |
−1.82 |
|
| TRAF3 interacting protein 3 [Traf3ip3] |
NM_001014132 |
−0.85 |
0.25 |
0.028 |
−1.81 |
|
| Putative bhlh transcription factor (Fragment) [Ascl3] |
ENSRNOT00000018309 |
−0.79 |
0.15 |
0.013 |
−1.73 |
|
|
Membrane proteins, receptors |
Atpase, (Na+)/K+ transporting, beta 4 polypeptide [Atp1b4] |
NM_053381 |
−1.38 |
0.13 |
0.003 |
−2.60 |
| Nerve growth factor receptor (TNFR superfamily, member 16) [Ngfr] |
NM_012610 |
−0.91 |
0.05 |
0.027 |
−1.88 |
|
| Cholinergic receptor, nicotinic, gamma polypeptide [Chrng] |
NM_019145 |
−0.99 |
0.39 |
0.048 |
−1.98 |
|
| G protein-coupled receptor 37 [Gpr37] |
NM_057201 |
−0.87 |
0.06 |
0.030 |
−1.82 |
|
| Adrenergic receptor, alpha 1d [Adra1d] |
NM_024483 |
−0.79 |
0.43 |
0.036 |
−1.73 |
|
| Neurotensin receptor 2 [Ntsr2] |
NM_022695 |
−0.77 |
0.32 |
0.018 |
−1.70 |
|
|
Structural protein, cell adhesion |
Myosin ixa [myo9a] |
NM_134335 |
−1.26 |
0.01 |
0.002 |
−2.40 |
| ST8 alpha-N-acetyl-neuraminide alpha-2,8-sialyltransferase 4 [St8sia4] |
NM_053914 |
−1.00 |
0.07 |
0.032 |
−2.01 |
|
| Similar to collagen, type XXIV, alpha 1 [RGD1565539_predicted] |
XM_575056 |
−1.16 |
0.03 |
0.011 |
−2.24 |
|
|
Others |
ADAM metallopeptidase with thrombospondin type 1 motif, 1 [Adamts1] |
NM_024400 |
−2.84 |
0.90 |
0.1230 |
−7.16 |
| Similar to tatd dnase domain containing 1 [RGD1566244_predicted] |
XR_007720 |
−1.86 |
0.16 |
0.038 |
−3.63 |
|
| Aryl hydrocarbon receptor nuclear translocator-like protein [Arntl] |
NM_024362 |
−1.33 |
0.67 |
0.001 |
−2.52 |
|
| TAF13 RNA polymerase II, TATA box binding protein (TBP)-associated factor [Taf13_predicted] |
ENSRNOT00000027530 |
−1.22 |
0.11 |
0.039 |
−2.34 |
|
| G protein-coupled receptor 107 [Gpr107_predicted] |
ENSRNOT00000037742 |
−1.18 |
0.02 |
0.007 |
−2.26 |
|
| CDK5 regulatory subunit associated protein 1-like 1 [Cdkal1_predicted] |
XM_341524 |
−0.92 |
0.06 |
0.041 |
−1.89 |
|
| Similar to chondroitin beta1,4 N-acetylgalactosaminyltransferase 2 [RGD1563660_predicted] |
ENSRNOT00000019778 |
−0.91 |
0.03 |
0.017 |
−1.87 |
|
| S100 calcium binding protein A3 [S100a3] |
NM_053681 |
−0.90 |
0.06 |
0.028 |
−1.87 |
|
| Similar to TPR repeat-containing protein KIAA1043 [LOC304558] |
XM_222260 |
−0.89 |
0.08 |
0.003 |
−1.85 |
|
| Similar to Ten-m4 [Odz4_predicted] |
ENSRNOT00000015181 |
−0.88 |
0.34 |
0.047 |
−1.84 |
|
| Kallikrein 14 [Klk14_predicted] |
ENSRNOT00000029197 |
−0.88 |
0.09 |
0.047 |
−1.84 |
|
| Mucin 19 [Muc19_predicted] |
XM_235593 |
−0.84 |
0.33 |
0.048 |
1.79 |
|
| Copine family member IX [Cpne9] |
NM_001024982 |
−0.84 |
0.11 |
0.006 |
−1.79 |
|
| Suppressor of Ty 16 homolog (S. Cerevisiae) [Supt16h_predicted] |
XM_223981 |
−0.81 |
1.57 |
0.021 |
−1.75 |
|
| Heterogeneous nuclear ribonucleoprotein L-like [Hnrpll_predicted] |
XM_233805 |
−0.81 |
0.01 |
0.008 |
−1.75 |
|
| Cdna clone UI-R-BJ0p-afn-b-03-0-UI 3' [Sln] |
CK841541 |
−0.81 |
0.30 |
0.013 |
−1.75 |
|
| Discs, large homolog 4 (Drosophila) [Dlgh4] |
NM_019621 |
−0.80 |
0.23 |
0.026 |
−1.75 |
|
| Similar to chondroitin beta1,4 N-acetylgalactosaminyltransferase [RGD1307618_predicted] |
XM_224757 |
−0.80 |
0.25 |
0.031 |
−1.74 |
|
| Sterile alpha motif domain containing 4 [Samd4_predicted] |
ENSRNOT00000060847 |
−0.80 |
0.02 |
0.012 |
−1.74 |
|
| Similar to RIKEN cdna 1190005B03 [Cdkal1_predicted] |
ENSRNOT00000024854 |
−0.79 |
0.06 |
0.035 |
−1.73 |
|
| WDNM1 homolog [LOC360228] |
NM_001003706 |
−0.78 |
0.24 |
0.007 |
−1.72 |
|
| CD300 antigen like family member E [Cd300le_predicted] |
XR_009489 |
−0.78 |
0.362 |
0.023 |
−1.71 |
|
| Neuronatin [nnat] |
NM_053601 |
−0.77 |
0.35 |
0.022 |
−1.71 |
|
| Connective tissue growth factor [Ctgf] |
NM_022266 |
−0.77 |
0.47 |
0.049 |
−1.69 |
|
| Chemokine (C-X-C motif) ligand 11 [Cxcl11] | NM_182952 | −0.75 | 0.17 | 0.003 | −1.68 |
Table 2.
Up-regulated genes on DNA microarray
| Gene function | Description [Gene symbol] | Acc. No.: | AVE log2 | SD | P value | Fold change |
|---|---|---|---|---|---|---|
|
Metabolism |
Acyl-coa thioesterase 7 [Acot7] |
NM_013214 |
0.75 |
0.34 |
0.021 |
1.69 |
| Angiopoietin-like 4 [Angptl4] |
NM_199115 |
0.83 |
0.25 |
0.007 |
1.78 |
|
| Mannosyl (alpha-1,3-)-glycoprotein beta-1,4-N-acetylglucosaminyltransferase, isozyme C [Mgat4c_predicted] |
ENSRNOT00000005523 |
0.87 |
0.29 |
0.037 |
1.82 |
|
| Carbonyl reductase 1 [Cbr1] |
NM_019170 |
0.99 |
0.40 |
0.016 |
1.99 |
|
| 3-hydroxy-3-methylglutaryl-Coenzyme A synthase 2 [Hmgcs2] |
NM_173094 |
1.05 |
0.25 |
0.004 |
2.07 |
|
| Transglutaminase 1 [tgm1] |
NM_031659 |
1.35 |
0.13 |
0.044 |
2.55 |
|
| Cytosolic acyl-coa thioesterase 1 [Cte1] |
NM_031315 |
1.88 |
0.41 |
0.003 |
3.69 |
|
|
Stress response |
Cold inducible RNA binding protein [Cirbp] |
NM_031147 |
0.77 |
0.21 |
0.005 |
1.71 |
| Glutathione S-transferase Yc2 subunit [Yc2] |
NM_001009920 |
0.86 |
0.16 |
0.002 |
1.82 |
|
|
Signal transduction, regulation of transcription |
Calcium/calmodulin-dependent protein kinase II gamma [Camk2g] |
NM_133605 |
0.75 |
0.21 |
0.006 |
1.68 |
| Phospholipase A2, group VII (platelet-activating factor acetylhydrolase, plasma) [Pla2g7] |
NM_001009353 |
1.45 |
0.84 |
0.041 |
2.74 |
|
| Brain expressed X-linked 1 [Bex1] |
NM_001037365 |
0.92 |
0.57 |
0.048 |
1.90 |
|
| Fibroblast growth factor receptor substrate 3 [Frs3] |
NM_001017382 |
1.05 |
0.04 |
0.018 |
2.07 |
|
|
Membrane proteins, receptors |
Huntingtin-associated protein 1 [Hap1] |
NM_024133 |
0.77 |
0.29 |
0.043 |
1.71 |
| Membrane protein, palmitoylated 3 (MAGUK p55 subfamily member 3) [RGD1560049_predicted] |
ENSRNOT00000055194 |
1.10 |
0.45 |
0.016 |
2.15 |
|
| Atpase, H+/K+ transporting, nongastric, alpha polypeptide [Atp12a] |
NM_133517 |
1.39 |
0.19 |
0.006 |
2.61 |
|
|
Structural protein, cell adhesion |
Spectrin beta 3 [Spnb3] |
NM_019167 |
0.95 |
0.05 |
0.026 |
1.93 |
| Aggrecan 1 [agc1] |
NM_022190 |
1.06 |
0.09 |
0.037 |
2.08 |
|
|
Others |
Similar to mucin 7, salivary [RGD1311530_predicted] |
ENSRNOT00000014519 |
0.75 |
0.22 |
0.007 |
1.69 |
| Leukocyte tyrosine kinase [Ltk_predicted] |
ENSRNOT00000050055 |
0.77 |
0.04 |
0.021 |
1.70 |
|
| Similar to RIKEN cdna 9130022B02 [Pck2_predicted] |
ENSRNOT00000025260 |
0.78 |
0.28 |
0.042 |
1.72 |
|
| Similar to hypothetical protein [Arid2_predicted] |
ENSRNOT00000006970 |
0.79 |
0.20 |
0.004 |
1.73 |
|
| Iroquois related homeobox 3 (Drosophila) [Irx3_predicted] |
ENSRNOT00000043254 |
0.809 |
0.41 |
0.031 |
1.74 |
|
| Hdac5 protein (Fragment) [Hdac5] |
ENSRNOT00000028381 |
0.86 |
0.70 |
0.022 |
1.81 |
|
| Ribonuclease, rnase A family, 1 (pancreatic) [Rnase1] |
NM_001029904 |
0.90 |
0.22 |
0.004 |
1.86 |
|
| Ring finger protein 24 [Rnf24_predicted] |
ENSRNOT00000028869 |
0.92 |
0.22 |
0.037 |
1.89 |
|
| Amyloid beta (A4) precursor protein-binding, family A, member 1 [Apba1] |
NM_031779 |
0.96 |
0.36 |
0.044 |
1.94 |
|
| CWF19-like 1, cell cycle control (S. Pombe) [Cwf19l1_predicted] |
ENSRNOT00000017202 |
0.97 |
0.09 |
0.044 |
1.95 |
|
| Similar to high density lipoprotein-binding protein [RGD1564237_predicted] |
ENSRNOT00000009811 |
0.98 |
0.19 |
0.002 |
1.97 |
|
| P21 (CDKN1A)-activated kinase 6 [Pak6_predicted] |
ENSRNOT00000010471 |
0.10 |
0.08 |
0.036 |
2.00 |
|
| Similar to nuclear body associated kinase 1a [Hipk2_predicted] |
XM_342662 |
1.06 |
0.66 |
0.049 |
2.09 |
|
| Cationic trypsinogen [LOC286911] |
NM_173127 |
1.08 |
0.07 |
0.031 |
2.11 |
|
| Chac, cation transport regulator-like 1 (E. Coli) [RGD1560049_predicted] |
XM_342497 |
1.10 |
0.08 |
0.033 |
2.15 |
|
| NTAK alpha2 [Nrg2] |
D89996 |
1.13 |
0.10 |
0.042 |
2.18 |
|
| Ubiquitin carboxy-terminal hydrolase L1 [Uchl1] |
NM_017237 |
1.24 |
0.26 |
0.014 |
2.37 |
|
| Claudin 19 [cldn19] | NM_001008514 | 1.43 | 0.12 | 0.037 | 2.70 |
Table 3.
QRT-PCR
| Description [Gene symbol] | Acc. No.: |
DNA MICROARRAY |
QRT-PCR |
Confirmed | |||
|---|---|---|---|---|---|---|---|
| Fold change | p value | Ratio (SD) | Fold change | Regulation | |||
| ADAM metallopeptidase with thrombospondin type 1 motif, 1 [Adamts1] |
NM_024400 |
−7.16 |
0.1295 |
0.58 (0.09) |
−1.72 |
down |
yes |
| heat shock 70kD protein 1A [Hspa1a] |
NM_031971 |
−3.59 |
0.0045 |
0.34 (0.06) |
−2.94 |
down |
yes |
| similar to 60 kDa heat shock protein mitochondrial precursor [Hsp60] |
XR_085659 |
−3.11 |
0.0565 |
0.64 (0.10) |
−1.56 |
down |
yes |
| interleukin 18 [Il18] |
NM_019165 |
−2.60 |
0.0066 |
0.91 (0.15) |
−1.10 |
no change |
no |
| ATPase, (Na+)/K+ transporting, beta 4 polypeptide [Atp1b4] |
NM_053381 |
−2.60 |
0.0031 |
0.37 (0.06) |
−2.70 |
down |
yes |
| argininosuccinate synthetase [Ass] |
NM_013157 |
−2.51 |
0.0007 |
0.29 (0.05) |
−3.42 |
down |
yes |
| myosin IXA [Myo9a] |
NM_134335 |
−2.40 |
0.0018 |
0.90 (0.15) |
−1.11 |
no change |
no |
| glycine C-acetyltransferase (2-amino-3-ketobutyrate-coenzyme A ligase) [Gcat] |
NM_001024277 |
−2.22 |
0.0063 |
0.33 (0.03) |
−3.07 |
down |
yes |
| activating transcription factor 3 [Atf3] |
NM_012912 |
−2.05 |
0.0044 |
0.35 (0.06) |
−2.85 |
down |
yes |
| similar to chondroitin sulfate GalNAcT-2 [RGD1563660_predicted] |
ENSRNOT00000019778 |
−1.87 |
0.0170 |
0.92 (0.15) |
−1.09 |
no change |
no |
| S100 calcium binding protein A3 [S100a3] |
NM_053681 |
−1.87 |
0.0281 |
1.74 (0.28) |
1.74 |
up |
no |
| sushi, nidogen and EGF-like domains 1 [Sned1] |
NM_001167842 |
−1.83 |
0.0407 |
0.42 (0.07) |
−2.36 |
down |
yes |
| G protein-coupled receptor 37 [Gpr37] |
NM_057201 |
−1.82 |
0.0297 |
1.08 (0.18) |
1.08 |
no change |
no |
| angiopoietin-like 4 [Angptl4] |
NM_199115 |
1.78 |
0.0073 |
2.90 (0.47) |
2.90 |
up |
yes |
| glutathione S-transferase Yc2 subunit [Yc2] |
NM_001009920 |
1.82 |
0.0017 |
2.21 (0.36) |
2.21 |
up |
yes |
| ribonuclease, RNase A family, 1 (pancreatic) [Rnase1] |
NM_001029904 |
1.86 |
0.0039 |
2.68 (0.44) |
2.68 |
up |
yes |
| similar to high density lipoprotein-binding protein [RGD1564237_predicted] |
ENSRNOT00000009811 |
1.97 |
0.0020 |
2.73 (0.44) |
2.73 |
up |
yes |
| 3-hydroxy-3-methylglutaryl-Coenzyme A synthase 2[Hmgcs2] |
NM_173094 |
2.07 |
0.0036 |
2.42 (0.39) |
2.42 |
up |
yes |
| similar to tetracycline transporter-like protein [RGD1311900_predicted] |
ENSRNOT00000017386 |
2.24 |
0.1671 |
1.29 (0.21) |
1.29 |
no change |
no |
| ubiquitin carboxy-terminal hydrolase L1 [Uchl1] |
NM_017237 |
2.37 |
0.0144 |
2.50 (0.41) |
2.50 |
up |
yes |
| ATPase, H+/K+ transporting, nongastric, alpha polypeptide [Atp12a] |
NM_133517 |
2.61 |
0.0061 |
3.06 (0.50) |
3.06 |
up |
yes |
| phospholipase A2, group VII (platelet-activating factor acetylhydrolase, plasma) [Pla2g7] |
NM_001009353 |
2.74 |
0.0411 |
4.25 (0.69) |
4.25 |
up |
yes |
| cytosolic acyl-CoA thioesterase 1 [Cte1] | NM_031315 | 3.69 | 0.0028 | 3.16 (0.51) | 3.16 | up | yes |
Table 4.
Primers to QRT-PCR
| Gene symbol | Gene description | Acc. No.: | Forward | Reverse |
|---|---|---|---|---|
| Adamts1 |
ADAM metallopeptidase with thrombospondin type 1 motif, 1 |
NM_024400 |
aaaggcattggctacttctttg |
ggactacagggagtgccatc |
| Hspa1a |
heat shock 70kD protein 1A (Hspa1a) |
NM_031971 |
tggcccattaaataagaaccaa |
cgaaggcgtagagattccag |
| Hsp60 |
similar to 60 kDa heat shock protein, mitochondrial precursor (Hsp60) |
XR_085659 |
gctacaatttctgcaaacagagac |
cattaggggttttcccatcc |
| Il18 |
interleukin 18 (Il18) |
NM_019165 |
gcctgatatcgaccgaaca |
ccttccatccttcacagatagg |
| Atp1b4 |
ATPase, (Na+)/K+ transporting, beta 4 polypeptide (Atp1b4) |
NM_053381 |
acttggcagcgttatgtcatt |
catttcctcttgaagactgtcattat |
| Ass |
argininosuccinate synthetase (Ass) |
NM_013157 |
ccaccggcttcatcaatatc |
tgctctgaaggcgatggta |
| Myo9a |
myosin IXA (Myo9a) |
NM_134335 |
cactctgagctagggcctgt |
actgaagaaaatcgttgtgacg |
| Gcat |
glycine C-acetyltransferase (2-amino-3-ketobutyrate-coenzyme A ligase) (Gcat) |
NM_001024277 |
gctggcctcatttctactcg |
gcgggctatcttggcttc |
| Atf3 |
activating transcription factor 3 |
NM_012912 |
tgtcagtcaccaagtctgaggt |
cacttggcagcagcaattt |
| RGD1563660_pred |
similar to chondroitin sulfate GalNAcT-2 (pred) |
NM_001106616 |
tcgtctatgccaaccagga |
tctccaaaaaccagagtccttt |
| S100a3 |
S100 calcium binding protein A3 |
NM_053681 |
agcagcagcagcagttga |
ggtacacacgatggcagcta |
| Sned1 |
sushi, nidogen and EGF-like domains 1 (Sned1) |
NM_001167842 |
cctggtaccgtgtgaccttc |
caccgtttggaatgtgttga |
| Gpr37 |
G protein-coupled receptor 37 |
NM_057201 |
ccaagaagtggcttttggaa |
agtgacacccagagaagctacc |
| Angptl4 |
angiopoietin-like 4 |
NM_199115 |
tctccaccatttttggtcaac |
gttcaggcgtctctgaatcac |
| Yc2 |
glutathione S-transferase Yc2 subunit |
NM_001009920 |
tctgaaaactcgggatgacc |
accagcttcatcccgtca |
| Rnase1 |
ribonuclease, RNase A family, 1 (pancreatic) |
NM_001029904 |
actgactgccgcctgaag |
ttctggctgtcagtggttgt |
| RGD1311900_pred RGD |
similar to tetracycline transporter-like protein |
ENSRNOT00000017386 |
gcactcactgcctatgttgg |
cctggagaaccatagctgga |
| RGD1564237_pred RGD |
similar to high density lipoprotein-binding protein |
ENSRNOT00000009811 |
ggaggagaccaacatgatcc |
agcacttggcagaagtagcac |
| Hmgcs2 |
3-hydroxy-3-methylglutaryl-Coenzyme A synthase 2 |
NM_173094 |
cctggcctcacttctctcc |
ggagaaggctccaatcctg |
| Uchl1 |
ubiquitin carboxy-terminal hydrolase L1 |
NM_017237 |
attcaggcagcccatgact |
gaaattcactttgtcgtctaccc |
| Atp12a |
ATPase, H+/K+ transporting, nongastric, alpha polypeptide |
NM_133517 |
gcatcattgtggctaacgtg |
ccgtcagtgacagggtaaca |
| Pla2g7 |
phospholipase A2, group VII (platelet-activating factor acetylhydrolase |
NM_001009353 |
actggcaagacccttcttttt |
gacatcaccgattggagctt |
| Cte1 | cytosolic acyl-CoA thioesterase 1 | NM_031315 | gtgcacgagcgtcacttc | gaaagggcccaggttctg |
Gene ontology analysis
In order to further determine the biological significance and functional classification of differentially expressed genes due to metabolic syndrome, GO analysis was performed (Table 5). GO is a bioinformatics initiative with the aim of standardizing the representation of genes and gene products providing a controlled and regularly updated vocabulary of terms for gene product characteristics and annotation data. GO analysis is suitable for identifying significantly enriched GO terms related to multiple genes and for discovering enriched functionally related gene groups. A single gene can belong to different categories. Out of the 85 genes significantly altered by metabolic syndrome in our present study, 68 genes with known function were submitted to GO analysis. The rest of the 85 genes were either unknown expressed sequence tags or unrecognized by the GO analysis database. The 68 analyzed genes were classified into three main categories such as (i) cellular metabolic process, (ii) developmental process and (iii) localization including transport (Table 5).
Table 5.
Gene ontology analysis
| Category | GO ID | Level | Term | Count | % | p value | Genes (gene symbols) |
|---|---|---|---|---|---|---|---|
| GOTERM_BP_ALL |
GO:0009987 |
02 |
cellular process |
47 |
55,3 |
0,035 |
ACAN, ACOT1, ACOT7, ANGPTL4, APBA1, ARID2, ARNTL, ASS1, ATF3, ATP1B4, ATP12A,BCL2A1D, BEX1, CAMK2G, CBR1, CHRNG, COL24A1, CSGALNACT1, CTGF, DCXR, DLG4, DUSP3, EXO1, GSTA5, HAP1, HDAC5, HEY2, HIPK2, HMGCS2, HSPA1A, HSPA1B, HNRPLL, IRX3, LOC360228, LOC501189, NGFR, NNAT, NTSR2, PCK2, SNED1, SPTBN2, ST8SIA4, STRBP, TAF13, TGM1, TYMS, UCHL1 |
| GOTERM_BP_ALL |
GO:0009266 |
04 |
response to temperature stimulus |
5 |
5,9 |
0,013 |
CIRBP, HSPA1A, HSPA1B, IL18, NGFR |
| GOTERM_BP_ALL |
GO:0042180 |
04 |
cellular ketone metabolic process |
9 |
10,6 |
0,004 |
ACOT1, ACOT7, ARID2, ASS1, ATF3, CBR1, CSGALNACT1, HNRPLL, PCK2 |
| GOTERM_BP_ALL |
GO:0006082 |
04 |
organic acid metabolic process |
8 |
9,4 |
0,014 |
ACOT1, ACOT7, ARID2, ASS1, ATF3, CSGALNACT1, HNRPLL, PCK2 |
| GOTERM_BP_ALL |
GO:0019752 |
05 |
carboxylic acid metabolic process |
8 |
9,4 |
0,014 |
ACOT1, ACOT7, ARID2, ASS1, ATF3, CSGALNACT1, HNRPLL, PCK2 |
| GOTERM_BP_ALL |
GO:0043436 |
05 |
oxoacid metabolic process |
8 |
9,4 |
0,014 |
ACOT1, ACOT7, ARID2, ASS1, ATF3, CSGALNACT1, HNRPLL, PCK2 |
| GOTERM_BP_ALL |
GO:0034637 |
05 |
cellular carbohydrate biosynthetic process |
3 |
3,5 |
0,039 |
ATF3, CSGALNACT1, PCK2 |
| GOTERM_BP_ALL |
GO:0051346 |
06 |
negative regulation of hydrolase activity |
4 |
4,7 |
0,023 |
ANGPTL4, BCL2A1D, HSPA1A, HSPA1B, |
| GOTERM_BP_ALL |
GO:0008284 |
06 |
positive regulation of cell proliferation |
6 |
7,1 |
0,039 |
ATF3, BEX1, HEY2, HIPK2, IL18, NGFR |
| GOTERM_BP_ALL |
GO:0048489 |
07 |
synaptic vesicle transport |
3 |
3,5 |
0,017 |
APBA1, DLG4, SPTBN2 |
| GOTERM_BP_ALL |
GO:0032502 |
02 |
developmental process |
25 |
29,4 |
0,001 |
ACAN, ANGPTL4, APBA1, ASS1, ATF3, BCL2A1D, BEX1, CBR1, CTGF, DLG4, EXO1, HAP1, HEY2, HIPK2, IL18, IRX3, KLK14, LOC360228, NGFR, NNAT, NRG2, ODZ4, STRBP, TGM1, UCHL1 |
| GOTERM_BP_ALL |
GO:0048869 |
03 |
cellular developmental process |
15 |
17,6 |
0,012 |
ACAN, ANGPTL4, ATF3, BCL2A1D, BEX1, CTGF, DLG4, HEY2, IRX3, LOC360228, NGFR, NNAT, STRBP, TGM1, UCHL1 |
| GOTERM_BP_ALL |
GO:0007275 |
03 |
multicellular organismal development |
23 |
27,1 |
0,001 |
ACAN, ANGPTL4, APBA1, ASS1, BCL2A1D, BEX1, CBR1, CTGF, DLG4, EXO1,HEY2, HAP1, HIPK2, IL18, IRX3, KLK14, NGFR, NNAT, NRG2, ODZ4, STRBP, TGM1, UCHL1 |
| GOTERM_BP_ALL |
GO:0048856 |
03 |
anatomical structure development |
19 |
22,3 |
0,013 |
ACAN, ANGPTL4, ASS1, BCL2A1D, BEX1, CBR1, CTGF, DLG4, EXO1, HAP1, HEY2, IL18, IRX3, KLK14, NGFR, NNAT, ODZ4, TGM1, UCHL1 |
| GOTERM_BP_ALL |
GO:0048731 |
04 |
system development |
18 |
21,1 |
0,016 |
ACAN, ANGPTL4, ASS1, BCL2A1D, BEX1, CBR1, CTGF, DLG4, EXO1, HAP1, HEY2, IL18, IRX3, KLK14, NGFR, NNAT, TGM1, UCHL1 |
| GOTERM_BP_ALL |
GO:0030154 |
04 |
cell differentiation |
15 |
17,6 |
0,009 |
ACAN, ANGPTL4 ATF3, BCL2A1D, BEX1, CTGF, DLG4, HEY2, IRX3, LOC360228, NGFR, NNAT, STRBP, TGM1, UCHL1 |
| GOTERM_MF_ALL |
GO:0003824 |
02 |
catalytic activity |
30 |
35,3 |
0,037 |
ACOT1, ACOT7, ARID2, ASS1, ATP1B4, ATP12A ,BDH1, CAMK2G, CBR1, CSGALNACT1, DCXR, DUSP3, EXO1,GCAT, GSTA5, HDAC5, HIPK2, HMGCS2, KLK14, LOC286911, LOC501189, MYO9A, PCK2, PLA2G7, RAB7A, RNASE1, ST8SIA4, TYMS, TGM1, UCHL1 |
| GOTERM_MF_ALL |
GO:0016788 |
04 |
hydrolase activity, acting on ester bonds |
7 |
8,2 |
0,041 |
ACOT1, ACOT7, DUSP3, EXO1, PLA2G7, RNASE1, UCHL1 |
| GOTERM_MF_ALL |
GO:0016790 |
05 |
thiolester hydrolase activity |
3 |
3,5 |
0,047 |
ACOT1, ACOT7, UCHL1 |
| GOTERM_CC_ALL |
GO:0031974 |
02 |
membrane-enclosed lumen |
13 |
14,5 |
0,032 |
ARNTL, ASCL3, ASCL3_PREDICTED, ATF3, BDH1, CIRBP, DUSP3, HIPK2, HMGCS2, NGFR, SPTBN2, SUPT16H, TAF13 |
| GOTERM_CC_ALL |
GO:0044421 |
03 |
extracellular region part |
8 |
9,6 |
0,044 |
ACAN, ANGPTL4, COL24A1, CTGF, LOC286911, LOC360228, IL18, KLK14 |
| GOTERM_CC_ALL |
GO:0031090 |
04 |
organelle membrane |
11 |
12,0 |
0,032 |
ASS1, CAMK2G, CSGALNACT1, BDH1, DLG4, GCAT, GSTA5, HIPK2, HMGCS2, LOC501189, ST8SIA4 |
| GOTERM_CC_ALL |
GO:0043233 |
04 |
organelle lumen |
13 |
15,3 |
0,027 |
ARNTL, ASCL3, ASCL3_PREDICTED, ATF3, BDH1, CIRBP, DUSP3, HIPK2, HMGCS2, NGFR, SPTBN2, SUPT16H, TAF13 |
| GOTERM_CC_ALL |
GO:0070013 |
06 |
intracellular organelle lumen |
13 |
15,3 |
0,021 |
ARNTL, ASCL3, ASCL3_PREDICTED, ATF3, BDH1, CIRBP, DUSP3, HIPK2, HMGCS2, NGFR, SPTBN2, SUPT16H, TAF13 |
| GOTERM_CC_ALL |
GO:0005654 |
06 |
nucleoplasm |
9 |
10,6 |
0,045 |
ARNTL, ASCL3, ASCL3_PREDICTED, CIRBP, DUSP3, HIPK2, NGFR, SUPT16H, TAF13 |
| GOTERM_CC_ALL |
GO:0031981 |
07 |
nuclear lumen |
12 |
14,1 |
0,029 |
ARNTL, ASCL3, ASCL3_PREDICTED, ATF3, CIRBP, DUSP3, HIPK2, NGFR, SPTBN2, SUPT16H, TAF13 |
| GOTERM_CC_ALL | GO:0030139 | 08 | endocytic vesicle | 3 | 3,5 | 0,034 | CAMK2G, DLG4, RAB7A |
Significantly enriched gene ontology (GO) terms in the population of genes with altered expression due to metabolic syndrome. GO analysis determines the biological significance of differentially expressed genes that can be used to determine the functional classification of the genes, the expression of which have been significantly up- or down-regulated. Major functional categories of GO terms were separated by horizontal lines, subcategories are represented by level on gene tree.
Discussion
In the present study, our aim was to investigate whether cardiac gene expression is influenced by metabolic syndrome. Here we show several characteristics of metabolic syndrome in 25 weeks old male ZDF rats including obesity, fasting hyperglycemia, hyperlipidemia, hyperinsulinemia, insulin resistance, and impaired glucose tolerance as well as increased cardiac nitrosative stress. In the present study, we demonstrate for the first time in the literature that metabolic syndrome influences cardiac gene expression pattern by altering transcript levels of several genes. We identified 85 genes which were differentially expressed dominantly in the myocardium [47,48] of ZDF rats compared to normal controls. Many of these differentially expressed genes are known to be involved in multiple cell functions, including metabolism, stress response, signal transduction, regulation of transcription, cytoskeletal structure, cell adhesion, membrane proteins, receptors and others. The majority of these genes have not been related to metabolic syndrome yet, and therefore, characterization of the functional effects of these genes on the heart in metabolic syndrome is suggested in future mechanistic studies.
Our present findings showing that 25 week old male ZDF rats develop insulin resistance with hyperinsulinemia, hyperglycemia and impaired HOMA-index are in accordance with previous studies [32-34,49,50]. Both metabolic syndrome and type 2 diabetes mellitus are associated with insulin resistance, hyperinsulinemia and hyperglycemia. Insulin resistance has been reported to be influenced by certain genetic factors and nutrients in patients suffering from metabolic syndrome [51]. It has been proposed that myocardial SERCA2a overexpression stimulated by hyperinsulinemia plays an important role in the cardiac adaptation in ZDF animals [52]. Others have shown that GLUT4 content decreases along with the development of insulin resistance in the myocardium and other insulin sensitive tissues which might play a key role in the impaired glycemic homeostasis in metabolic syndrome [53]. Interestingly, hyperglycemia has been reported to activate p53 and p53-regulated genes involving the local renin-angiotensin system which leads to increased apoptosis of cardiomyocytes [54]. Moreover, postprandial hyperglycemia has been shown to play an important role on the onset and development of heart failure in humans [55]. Chronic hyperglycemia has been reported to enhance the vasoconstrictor response by Rho-kinase [56]. Hyperglycemia itself has been shown to increase rat aortic smooth muscle cell growth and gene expression in diabetes mellitus [57]. Some drugs e.g. statins [57] and nitrates [58] have been reported to abolish hyperglycemia induced vasoconstriction. These aforementioned studies, in agreement with our present study, suggest that metabolic serum parameters may influence cardiac gene expression pattern and may lead to functional consequences. Although we have not measured blood pressure in our study, ZDF rats are well known to develop elevated blood pressure at ages similar to that of used in the present study [59-61]
In our present study, several genes related to metabolism were found to be affected in the hearts of ZDF rats as compared to controls. A group of these altered genes is involved in ketone body metabolism (down-regulation of 3-hydroxybutyrate dehydrogenase, type 1; up-regulation of 2-amino-3-ketobutyrate-coenzyme A ligase and 3-hydroxy-3-methylglutaryl-coenzyme A synthase 2). Decreased rate of ketone body oxidation and decreased activity of 3-hydroxybutyrate dehydrogenase activity in streptozotocin-induced diabetic rat hearts have been shown previously [62]. In our present study, metabolic syndrome also influenced expression of genes related to metabolism of carbohydrates (down-regulation of dicarbonyl L-xylulose reductase and up-regulation of mannosyl (alpha-1,3-)-glycoprotein beta-1,4-N-acetylglucosaminyltransferase, isozyme C, pred) as well as lipids (up-regulation of acyl-CoA thioesterase 1 and cytosolic acyl-CoA thioesterase 1). Similarly to our present findings, gene expression of cytosolic acyl-CoA thioesterase 1 has been reported to be up-regulated by high fat diet [63] or STZ-induced diabetes [63] in the rat myocardium. A third group of differentially expressed metabolic genes in our present study (down-regulation of argininosuccinate synthetase and up-regulation of angiopoietin-like 4) in ZDF hearts is potentially regulated by oxidative and nitrosative stress which is increased in metabolic diseases e.g. hyperlipidemia [13,40,64], hypertension [65], insulin resistance [66], diabetes mellitus [67] and in the heart of ZDF rats as shown in previous [42] as well as in the present study. High TNF-alpha concentrations [68] and insulin resistance [69,70] in endothelial cells have been reported to reduce the expression of the arginine recycling enzyme, argininosuccinate synthetase. Overexpression of hepatic angiopoietin-like 4 gene has been shown in diabetic mice [71] and up-regulation of this gene has reported to be induced by fatty acids via PPAR-gamma in muscle tissue [72]. Additionally, insulin has been shown to down regulate angiopoietin-like 4 in adipocytes [73] and this down-regulation could be attenuated in insulin resistance [73].
Members of another functional gene cluster that is related to stress response showed altered expression in ZDF hearts as compared to controls in the present study (down-regulation of heat shock 70 kDa protein 1A; similar to 60 kDa heat shock protein, mitochondrial precursor; interleukin 18 and up-regulation of cold inducible RNA binding protein; glutathione S-transferase Yc2 subunit). We have previously shown that hyperlipidemia inhibits cardiac heat shock response [36]. Moreover, heat shock proteins, especially Hsp60, were found to have protective effect against cardiac oxidative and nitrosative stress [74]. According to the attenuated expression of heat shock protein 60 and 70 in our present study, metabolic syndrome with well-known increased cardiovascular oxidative and nitrosative stress [41,42] due to hyperlipidemia [64], hypertension [65] and hyperglycemia [66,67] might interfere with cardiac heat shock response. Glutathion S-transferase catalyzes the conjugation of reduced glutathione on a wide variety of substrates [75] including reactive oxygen and nitrogen species [76]. Interestingly, we have found here the overexpression of glutathione S-transferase in metabolic syndrome similarly to the up-regulation of this gene in cholesterol diet-induced hyperlipidemia in our previous study [77]. Additionally, the absence of cardiomyopathy in diabetes has been reported to be accompanied by increased glutathione S-transferase activity in rat hearts [78]. These results suggest that up-regulation of glutathione S-transferase may be an adaptive response in metabolic syndrome to antagonize elevated oxidative/nitrosative stress in the myocardium. Elevated circulating interleukin 18 levels have been reported to be associated with metabolic syndrome independent of obesity and insulin resistance [79], however, in our present study; the myocardial gene expression of interleukin 18 was down-regulated.
In the present study, we have also shown altered expression of several genes related to signal transduction and regulation of transcription in the hearts of ZDF rats as compared to controls (e.g. down-regulation of activating transcription factor 3; sushi, nidogen and EGF-like domains 1 (insulin responsive sequence DNA binding protein-1) and up-regulation of calcium/calmodulin-dependent protein kinase II gamma; phospholipase A2, group VII). Interestingly, in our present study, an adaptive and oxidative stress-responsive transcription factor [80-82], activating transcription factor 3 showed down-regulation in the heart in metabolic syndrome. Although, enhanced expression of activating transcription factor 3 has been reported to play a role in diabetic angiopathy [80], in stress-induced beta cell dysfunction [83,84] and hepatic LDL receptor down-regulation [85,86], its cardiac role in metabolic syndrome has not been implicated yet. Another stress inducible and regulator gene of eicosanoid biosynthesis, the phospholipase A2, group VII gene was up regulated in our present study in ZDF rat hearts. Increase of the expression of this gene was previously shown in ZDF rats in the liver and suggested to be a factor in the development of chronic low-grade inflammation in metabolic syndrome [87]. In our present study, a regulator gene of insulin action, the insulin responsive sequence DNA binding protein-1 showed down-regulation in metabolic syndrome in ZDF rat hearts. Down-regulation of this gene has been previously shown in the liver of diabetic [88] and obese [88] rats. However, it is unclear whether decreased expression of insulin responsive sequence DNA binding protein-1 is a consequence of insulin resistance or contributes to hyperglycemic phenotype. Calcium/calmodulin-dependent protein kinase II gamma showed up-regulation in ZDF hearts in our present study. This gene was reported to potentially mediate cardiac hypertrophy in pressure overload hypertension in mouse hearts [89].
In the present study, several genes related to the functional cluster of membrane proteins or receptors showed altered expression in ZDF hearts as compared to controls (e.g. down-regulation of ATPase, (Na+)/K+ transporting, beta 4 polypeptide; G protein-coupled receptor 37 and up-regulation of ATPase, H+/K+ transporting, nongastric, alpha polypeptide; Huntingtin-associated protein 1). Interestingly, here we have found gene expression changes of two members of the X,K-ATP-ase family due to metabolic syndrome. Surprisingly, ATPase, (Na+)/K+ transporting, beta 4 polypeptide showed down-regulation in obese ZDF rat hearts characterized by marked hyperlipidemia in the current study, however, this gene showed up-regulation in our previous study in cholesterol-induced hyperlidemia in the rat myocardium [77]. Additionally, it has been shown in the heart of spontaneously hypertensive rats that the microsomal Na+,K(+)-ATPase activity is reduced [90].
Another set of genes related to the functional cluster of structural proteins was found to be regulated differentially in hearts of ZDF rats as compared to controls (e.g. down-regulation of myosin IXA and similar to collagen, type XXIV, alpha 1 (pred) and up-regulation of spectrin beta 3 and aggrecan 1). To our current knowledge, we are the first in the literature demonstrating cardiac gene expression changes of a novel epithelial extracellular matrix component [91], similar to collagen type XXIV; a cell migration regulator molecule [92], myosin IXA; a membrane stabilizer molecule [93], spectrin beta 3 and an extracellular matrix component proteoglycan [94], aggrecan 1, due to metabolic syndrome.
Some of the genes showing altered expression in ZDF rat hearts in the present study were not related to specific functional clusters or indicated as yet uncharacterized, predicted genes and fragments, the relevance of which should not be ignored. Many of these genes are reported for the first time in the literature to show altered expression in the heart due to metabolic syndrome including down-regulation e.g. of disintegrin-like and metallopeptidse (reprolysin type) with thrombospondin type 1 motif; G protein-coupled receptor 107 (predicted); S100 calcium binding protein A3; kallikrein 14 (predicted); neuronatin; connective tissue growth factor and up-regulation e.g. of amyloid beta (A4) precursor protein-binding, family A, member 1; similar to high density lipoprotein-binding protein (predicted); cationic trypsinogen; ubiquitin carboxy-terminal hydrolase L1.
In order to strengthen our results obtained by microarray analysis, and to provide some functional assessment, we have performed GO analysis on the genes showing altered expression due to metabolic syndrome. Significantly enriched GO terms were classified into three main categories including (i) cellular metabolic process, (ii) developmental process, and (iii) cellular localization. These results showed that metabolic syndrome may significantly affect several major biological processes, especially genes related to cellular metabolic processes and development (Table 5).
Our study is not without limitations. Our results regarding altered cardiac gene expression due to metabolic syndrome are based on determinations of approximately 15000 cardiac transcript levels, however, confirmation of gene expression changes at the protein level and direct measurement of the full rat transcriptome should be performed in the future. Moreover, additional studies providing more in-depth mechanistic insight and functional assessment should be carried out. Although our study does not specify which cell type (i.e. cardiomyocyte, fibroblast, smooth muscle cell, etc.) may be responsible for the observed alterations of cardiac gene expression due to metabolic syndrome, contribution of cardiomyocytes is likely the most significant [47,95].
In summary, we have found that 25 weeks old male ZDF rats develop severe metabolic syndrome and we have demonstrated for the first time that metabolic syndrome is associated with profound modifications of the cardiac transcriptome. Several of the genes showing altered expression in the hearts of ZDF rats have not been implicated in metabolic syndrome previously. We conclude that metabolic syndrome alters the gene expression pattern of the myocardium which may be involved in the development of cardiac pathologies in the state of metabolic syndrome. Based on our exploratory results, future studies should be carried out to investigate the precise role of specific genes in the development of cardiac consequences of metabolic syndrome to obtain deeper mechanistic insight.
Grants
This work was supported by grants from the National Development Agency (MED_FOOD, Baross DA-TECH-07-2008-0041; TÁMOP-4.2.1/B-09/1/KONV-2010-0005; and TÁMOP-4.2.2/B-10/1-2010-0012), the Hungarian Scientific Research Fund (OTKA K79167), and co-financed by the European Regional Development Fund and VÁTI Hungarian Nonprofit Limited Liability Company for Regional Development and Town Planning (HURO/0901/137/2.2.2-HU-RO-TRANS-MED). T. Csont and A. Zvara hold a "János Bolyai Felowship" from the Hungarian Academy of Sciences.
Competing interest
No conflicts of interest, financial or otherwise, are declared by the author(s).
Authors’ contributions
Author contributions: L.G.P, .P.F., and T.C. conception and design of research; A.Z., V.F., N.G., G.F.K., C.C., J.P., and T.C. performed experiments; M.S., A.Z., V.F., N.G., G.S., C.C. and T.C.analyzed data; M.S., G.S., C.C., L.G.P., P.F., and T.C. interpreted results of experiments; M.S. and G.S. prepared figures; M.S., A.Z. and T.C. drafted manuscript; M.S., A.Z., T.C. and P.F., edited and revised manuscript; M.S., A.Z., V.F., N.G., G.S., J.P. L.G.P., C.C., G.F.K, P.F., and T.C. approved final version of manuscript.
Contributor Information
Márta Sárközy, Email: sarkozy.marta@med.u-szeged.hu.
Ágnes Zvara, Email: zvara@brc.hu.
Nóra Gyémánt, Email: nora@bioch.szote.u-szeged.hu.
Veronika Fekete, Email: vera@bioch.szote.u-szeged.hu.
Gabriella F Kocsis, Email: fodor.gabriella@med.u-szeged.hu.
Judit Pipis, Email: pipis.judit@med.u-szeged.hu.
Gergő Szűcs, Email: szucs.gergo@med.u-szeged.hu.
Csaba Csonka, Email: csonka.csaba@med.u-szeged.hu.
László G Puskás, Email: puskas.szbk@gmail.com.
Péter Ferdinandy, Email: peter.ferdinandy@pharmahungary.com.
Tamás Csont, Email: csont.tamas@med.u-szeged.hu.
References
- He J, Ogden LG, Bazzano LA, Vupputuri S, Loria C, Whelton PK. Risk factors for congestive heart failure in US men and women: NHANES I epidemiologic follow-up study. Arch Intern Med. 2001;161:996–1002. doi: 10.1001/archinte.161.7.996. [DOI] [PubMed] [Google Scholar]
- Lakka HM, Laaksonen DE, Lakka TA, Niskanen LK, Kumpusalo E, Tuomilehto J, Salonen JT. The metabolic syndrome and total and cardiovascular disease mortality in middle-aged men. JAMA. 2002;288:2709–2716. doi: 10.1001/jama.288.21.2709. [DOI] [PubMed] [Google Scholar]
- Sattar N, Gaw A, Scherbakova O, Ford I, O'Reilly DS, Haffner SM, Isles C, Macfarlane PW, Packard CJ, Cobbe SM, Shepherd J. Metabolic syndrome with and without C-reactive protein as a predictor of coronary heart disease and diabetes in the West of Scotland Coronary Prevention Study. Circulation. 2003;108:414–419. doi: 10.1161/01.CIR.0000080897.52664.94. [DOI] [PubMed] [Google Scholar]
- Malik S, Wong ND, Franklin SS, Kamath TV, L'Italien GJ, Pio JR, Williams GR. Impact of the metabolic syndrome on mortality from coronary heart disease, cardiovascular disease, and all causes in United States adults. Circulation. 2004;110:1245–1250. doi: 10.1161/01.CIR.0000140677.20606.0E. [DOI] [PubMed] [Google Scholar]
- Alberti KG, Zimmet P, Shaw J. IDF Epidemiology Task Force Consensus Group: The metabolic syndrome–a new worldwide definition. Lancet. 2005;366:1059–1062. doi: 10.1016/S0140-6736(05)67402-8. [DOI] [PubMed] [Google Scholar]
- Alberti KG, Eckel RH, Grundy SM, Zimmet PZ, Cleeman JI, Donato KA, Fruchart JC, James WP, Loria CM, Smith SC Jr. International Diabetes Federation Task Force on Epidemiology and Prevention, Hational Heart, Lung, and Blood Institute, American Heart Association, World Heart Federation, International Atherosclerosis Society, International Association for the Study of Obesity. Harmonizing the metabolic syndrome: a joint interim statement of the International Diabetes Federation Task Force on Epidemiology and Prevention; National Heart, Lung, and Blood Institute; American Heart Association; World Heart Federation; International Atherosclerosis Society; and International Association for the Study of Obesity. Circulation. 2009;120:1640–1645. doi: 10.1161/CIRCULATIONAHA.109.192644. [DOI] [PubMed] [Google Scholar]
- Grundy SM. Pre-diabetes, metabolic syndrome, and cardiovascular risk. J Am Coll Cardiol. 2012;59:635–643. doi: 10.1016/j.jacc.2011.08.080. [DOI] [PubMed] [Google Scholar]
- Reaven GM. Insulin resistance, the insulin resistance syndrome, and cardiovascular disease. Panminerva Med. 2005;47:201–210. [PubMed] [Google Scholar]
- Aschner P. Metabolic syndrome as a risk factor for diabetes. Expert Rev Cardiovasc Ther. 2010;8:407–412. doi: 10.1586/erc.10.13. [DOI] [PubMed] [Google Scholar]
- Mensah GA, Mokdad AH, Ford E, Narayan KM, Giles WH, Vinicor F, Deedwania PC. Obesity, metabolic syndrome, and type 2 diabetes: emerging epidemics and their cardiovascular implications. Cardiol Clin. 2004;22:485–504. doi: 10.1016/j.ccl.2004.06.005. [DOI] [PubMed] [Google Scholar]
- Giricz Z, Mentzer RM, Gottlieb RA Jr. Autophagy, myocardial protection, and the metabolic syndrome. J Cardiovasc Pharmacol. 2012;60:125–132. doi: 10.1097/FJC.0b013e318256ce10. [DOI] [PMC free article] [PubMed] [Google Scholar]
- Ovize M, Baxter GF, Di Lisa F, Ferdinandy P, Garcia-Dorado D, Hausenloy DJ, Heusch G, Vinten-Johansen J, Yellon DM, Schulz R. Working Group of Cellular Biology of Heart of European Society of Cardiology. Postconditioning and protection from reperfusion injury: where do we stand? Position paper from the Working Group of Cellular Biology of the Heart of the European Society of Cardiology. Cardiovasc Res. 2010;87:406–423. doi: 10.1093/cvr/cvq129. [DOI] [PubMed] [Google Scholar]
- Ferdinandy P, Schulz R, Baxter GF. Interaction of cardiovascular risk factors with myocardial ischemia/reperfusion injury, preconditioning, and postconditioning. Pharmacol Rev. 2007;59:418–458. doi: 10.1124/pr.107.06002. [DOI] [PubMed] [Google Scholar]
- Kristiansen SB, Lofgren B, Stottrup NB, Khatir D, Nielsen-Kudsk JE, Nielsen TT, Botker HE, Flyvbjerg A. Ischaemic preconditioning does not protect the heart in obese and lean animal models of type 2 diabetes. Diabetologia. 2004;47:1716–1721. doi: 10.1007/s00125-004-1514-4. [DOI] [PubMed] [Google Scholar]
- Ravingerova T, Stetka R, Pancza D, Ulicna O, Ziegelhoffer A, Styk J. Susceptibility to ischemia-induced arrhythmias and the effect of preconditioning in the diabetic rat heart. Physiol Res. 2000;49:607–616. [PubMed] [Google Scholar]
- Tosaki A, Pali T, Droy-Lefaix MT. Effects of Ginkgo biloba extract and preconditioning on the diabetic rat myocardium. Diabetologia. 1996;39:1255–1262. doi: 10.1007/s001250050567. [DOI] [PubMed] [Google Scholar]
- Tosaki A, Engelman DT, Engelman RM, Das DK. The evolution of diabetic response to ischemia/reperfusion and preconditioning in isolated working rat hearts. Cardiovasc Res. 1996;31:526–536. [PubMed] [Google Scholar]
- Przyklenk K, Maynard M, Greiner DL, Whittaker P. Cardioprotection with postconditioning: loss of efficacy in murine models of type-2 and type-1 diabetes. Antioxid Redox Signal. 2011;14:781–790. doi: 10.1089/ars.2010.3343. [DOI] [PMC free article] [PubMed] [Google Scholar]
- Ungi I, Ungi T, Ruzsa Z, Nagy E, Zimmermann Z, Csont T, Ferdinandy P. Hypercholesterolemia attenuates the anti-ischemic effect of preconditioning during coronary angioplasty. Chest. 2005;128:1623–1628. doi: 10.1378/chest.128.3.1623. [DOI] [PubMed] [Google Scholar]
- Kupai K, Csonka C, Fekete V, Odendaal L, van Rooyen J, Marais De W, Csont T, Ferdinandy P. Cholesterol diet-induced hyperlipidemia impairs the cardioprotective effect of postconditioning: role of peroxynitrite. Am J Physiol Heart Circ Physiol. 2009;297:H1729–H1735. doi: 10.1152/ajpheart.00484.2009. [DOI] [PubMed] [Google Scholar]
- Cameron AJ, Shaw JE, Zimmet PZ. The metabolic syndrome: prevalence in worldwide populations. Endocrinol Metab Clin North Am. 2004;33:351–375. doi: 10.1016/j.ecl.2004.03.005. table of contents. [DOI] [PubMed] [Google Scholar]
- Amuna P, Zotor FB. Epidemiological and nutrition transition in developing countries: impact on human health and development. Proc Nutr Soc. 2008;67:82–90. doi: 10.1017/S0029665108006058. [DOI] [PubMed] [Google Scholar]
- de Onis M, Blossner M. Prevalence and trends of overweight among preschool children in developing countries. Am J Clin Nutr. 2000;72:1032–1039. doi: 10.1093/ajcn/72.4.1032. [DOI] [PubMed] [Google Scholar]
- Ford ES, Giles WH, Dietz WH. Prevalence of the metabolic syndrome among US adults: findings from the third National Health and Nutrition Examination Survey. JAMA. 2002;287:356–359. doi: 10.1001/jama.287.3.356. [DOI] [PubMed] [Google Scholar]
- Abdul-Ghani MA, Williams K, DeFronzo RA, Stern M. What is the best predictor of future type 2 diabetes? Diabetes Care. 2007;30:1544–1548. doi: 10.2337/dc06-1331. [DOI] [PubMed] [Google Scholar]
- Suh YH, Kim Y, Bang JH, Choi KS, Lee JW, Kim WH, Oh TJ, An S, Jung MH. Analysis of gene expression profiles in insulin-sensitive tissues from pre-diabetic and diabetic Zucker diabetic fatty rats. J Mol Endocrinol. 2005;34:299–315. doi: 10.1677/jme.1.01679. [DOI] [PubMed] [Google Scholar]
- Garnett KE, Chapman P, Chambers JA, Waddell ID, Boam DS. Differential gene expression between Zucker Fatty rats and Zucker Diabetic Fatty rats: a potential role for the immediate-early gene Egr-1 in regulation of beta cell proliferation. J Mol Endocrinol. 2005;35:13–25. doi: 10.1677/jme.1.01792. [DOI] [PubMed] [Google Scholar]
- Bray GA. The Zucker-fatty rat: a review. Fed Proc. 1977;36:148–153. [PubMed] [Google Scholar]
- Kurtz TW, Morris RC, Pershadsingh HA. The Zucker fatty rat as a genetic model of obesity and hypertension. Hypertension. 1989;13:896–901. doi: 10.1161/01.HYP.13.6.896. [DOI] [PubMed] [Google Scholar]
- de Chantemele EJ B, Vessieres E, Guihot AL, Toutain B, Maquignau M, Loufrani L, Henrion D. Type 2 diabetes severely impairs structural and functional adaptation of rat resistance arteries to chronic changes in blood flow. Cardiovasc Res. 2009;81:788–796. doi: 10.1093/cvr/cvn334. [DOI] [PubMed] [Google Scholar]
- Gustavsson C, Soga T, Wahlstrom E, Vesterlund M, Azimi A, Norstedt G, Tollet-Egnell P. Sex-dependent hepatic transcripts and metabolites in the development of glucose intolerance and insulin resistance in Zucker diabetic fatty rats. J Mol Endocrinol. 2011;47:129–143. doi: 10.1530/JME-11-0007. [DOI] [PubMed] [Google Scholar]
- Corsetti JP, Sparks JD, Peterson RG, Smith RL, Sparks CE. Effect of dietary fat on the development of non-insulin dependent diabetes mellitus in obese Zucker diabetic fatty male and female rats. Atherosclerosis. 2000;148:231–241. doi: 10.1016/S0021-9150(99)00265-8. [DOI] [PubMed] [Google Scholar]
- Leonard BL, Watson RN, Loomes KM, Phillips AR, Cooper GJ. Insulin resistance in the Zucker diabetic fatty rat: a metabolic characterisation of obese and lean phenotypes. Acta Diabetol. 2005;42:162–170. doi: 10.1007/s00592-005-0197-8. [DOI] [PubMed] [Google Scholar]
- Peterson RG, Shaw WN, Neel M, Little LA, Eichberg J. Zucker diabetic fatty rat as a model for noninsulindependent diabetes mellitus. ILAR News. 1990;32:16–19. doi: 10.1093/ilar.32.3.16. [DOI] [PMC free article] [PubMed] [Google Scholar]
- Unger RH, Orci L. Diseases of liporegulation: new perspective on obesity and related disorders. FASEB J. 2001;15:312–321. doi: 10.1096/fj.00-0590. [DOI] [PubMed] [Google Scholar]
- Csont T, Balogh G, Csonka C, Boros I, Horvath I, Vigh L, Ferdinandy P. Hyperlipidemia induced by high cholesterol diet inhibits heat shock response in rat hearts. Biochem Biophys Res Commun. 2002;290:1535–1538. doi: 10.1006/bbrc.2002.6377. [DOI] [PubMed] [Google Scholar]
- Matthews DR, Hosker JP, Rudenski AS, Naylor BA, Treacher DF, Turner RC. Homeostasis model assessment: insulin resistance and beta-cell function from fasting plasma glucose and insulin concentrations in man. Diabetologia. 1985;28:412–419. doi: 10.1007/BF00280883. [DOI] [PubMed] [Google Scholar]
- Gayoso-Diz P, Otero-Gonzalez A, Rodriguez-Alvarez MX, Gude F, Cadarso-Suarez C, Garcia F, De Francisco A. Insulin resistance index (HOMA-IR) levels in a general adult population: curves percentile by gender and age. The EPIRCE study. Diabetes Res Clin Pract. 2011;94:146–155. doi: 10.1016/j.diabres.2011.07.015. [DOI] [PubMed] [Google Scholar]
- Barr EL, Cameron AJ, Balkau B, Zimmet PZ, Welborn TA, Tonkin AM, Shaw JE. HOMA insulin sensitivity index and the risk of all-cause mortality and cardiovascular disease events in the general population: the Australian Diabetes, Obesity and Lifestyle Study (AusDiab) study. Diabetologia. 2010;53:79–88. doi: 10.1007/s00125-009-1588-0. [DOI] [PubMed] [Google Scholar]
- Csont T, Bereczki E, Bencsik P, Fodor G, Gorbe A, Zvara A, Csonka C, Puskas LG, Santha M, Ferdinandy P. Hypercholesterolemia increases myocardial oxidative and nitrosative stress thereby leading to cardiac dysfunction in apoB-100 transgenic mice. Cardiovasc Res. 2007;76:100–109. doi: 10.1016/j.cardiores.2007.06.006. [DOI] [PubMed] [Google Scholar]
- Chinen I, Shimabukuro M, Yamakawa K, Higa N, Matsuzaki T, Noguchi K, Ueda S, Sakanashi M, Takasu N. Vascular lipotoxicity: endothelial dysfunction via fatty-acid-induced reactive oxygen species overproduction in obese Zucker diabetic fatty rats. Endocrinology. 2007;148:160–165. doi: 10.1210/en.2006-1132. [DOI] [PubMed] [Google Scholar]
- Zoja C, Cattaneo S, Fiordaliso F, Lionetti V, Zambelli V, Salio M, Corna D, Pagani C, Rottoli D, Bisighini C, Remuzzi G, Benigni A. Distinct cardiac and renal effects of ETA receptor antagonist and ACE inhibitor in experimental type 2 diabetes. Am J Physiol Renal Physiol. 2011;301:F1114–F1123. doi: 10.1152/ajprenal.00122.2011. [DOI] [PubMed] [Google Scholar]
- Virok DP, Kis Z, Szegedi V, Juhasz G, Zvara A Jr, Muller G, Levay G, Harsing LG, Rajko R, Penke B, Janka Z, Janaky T, Puskas LG. Functional changes in transcriptomes of the prefrontal cortex and hippocampus in a mouse model of anxiety. Pharmacol Rep. 2011;63:348–361. doi: 10.1124/pr.109.001933. [DOI] [PubMed] [Google Scholar]
- Nagy A, Kenesi E, Rentsendorj O, Molnar A, Szenasi T, Sinko I, Zvara A, Oommen ST, Barta E, Puskas LG, Lefebvre V, Kiss I. Evolutionarily conserved, growth plate zone-specific regulation of the matrilin-1 promoter: L-Sox5/Sox6 and Nfi factors bound near TATA finely tune activation by Sox9. Mol Cell Biol. 2011;31:686–699. doi: 10.1128/MCB.00019-10. [DOI] [PMC free article] [PubMed] [Google Scholar]
- Erdi B, Nagy P, Zvara A, Varga A, Pircs K, Menesi D, Puskas LG, Juhasz G. Loss of the starvation-induced gene Rack1 leads to glycogen deficiency and impaired autophagic responses in Drosophila. Autophagy. 2012;8:1124–1135. doi: 10.4161/auto.20069. [DOI] [PMC free article] [PubMed] [Google Scholar]
- Skov V, Knudsen S, Olesen M, Hansen ML, Rasmussen LM. Global gene expression profiling displays a network of dysregulated genes in non-atherosclerotic arterial tissue from patients with type 2 diabetes. Cardiovasc Diabetol. 2012;11:15. doi: 10.1186/1475-2840-11-15. [DOI] [PMC free article] [PubMed] [Google Scholar]
- Bell RM, Yellon DM. Conditioning the whole heart–not just the cardiomyocyte. J Mol Cell Cardiol. 2012;53:24–32. doi: 10.1016/j.yjmcc.2012.04.001. [DOI] [PubMed] [Google Scholar]
- Cury DP, Dias FJ, Sosthenes MC, Dos Santos Haemmerle CA, Ogawa K, Da Silva MC, Mardegan Issa JP, Iyomasa MM, Watanabe IS. Morphometric, quantitative, and three-dimensional analysis of the heart muscle fibers of old rats: Transmission electron microscopy and high-resolution scanning electron microscopy methods. Microsc Res Tech. 2012. in press. [DOI] [PubMed]
- Kuhlmann J, Neumann-Haefelin C, Belz U, Kalisch J, Juretschke HP, Stein M, Kleinschmidt E, Kramer W, Herling AW. Intramyocellular lipid and insulin resistance: a longitudinal in vivo 1H-spectroscopic study in Zucker diabetic fatty rats. Diabetes. 2003;52:138–144. doi: 10.2337/diabetes.52.1.138. [DOI] [PubMed] [Google Scholar]
- Shimamura M, Nakagami H, Shimosato T, Moritani T, Nakagami F, Osako MK, Miyake T, Koriyama H, Shimizu H, Morishita R. Irbesartan improves endothelial dysfunction, abnormal lipid profile, proteinuria and liver dysfunction in Zucker diabetic fatty rats independent of glucose and insulin levels. Exp Ther Med. 2011;2:957–961. doi: 10.3892/etm.2011.307. [DOI] [PMC free article] [PubMed] [Google Scholar]
- Perez-Martinez P, Garcia-Rios A, Delgado-Lista J, Gjelstad IM, Gibney J, Kiec-Wilk B, Camargo A, Helal O, Karlstrom B, Blaak EE, Hall W, Riserus U, Dembinska-Kiec A, Defoort C, Saris WH, Lovegrove JA, Drevon CA, Roche HM, Lopez-Miranda J. Gene-nutrient interactions on the phosphoenolpyruvate carboxykinase influence insulin sensitivity in metabolic syndrome subjects. Clin Nutr. 2012. in press. [DOI] [PubMed]
- Fredersdorf S, Endemann DH, Luchner A, Heitzmann D, Ulucan C, Birner C, Schmid P, Stoelcker B, Resch M, Muders F, Riegger GA, Weil J. Increased aldosterone levels in a model of type 2 diabetes mellitus. Exp Clin Endocrinol Diabetes. 2009;117:15–20. doi: 10.1055/s-2008-1073128. [DOI] [PubMed] [Google Scholar]
- Leguisamo NM, Lehnen AM, Machado UF, Okamoto MM, Markoski MM, Pinto GH, Schaan BD. GLUT4 content decreases along with insulin resistance and high levels of inflammatory markers in rats with metabolic syndrome. Cardiovasc Diabetol. 2012;11:100. doi: 10.1186/1475-2840-11-100. [DOI] [PMC free article] [PubMed] [Google Scholar]
- Fiordaliso F, Leri A, Cesselli D, Limana F, Safai B, Nadal-Ginard B, Anversa P, Kajstura J. Hyperglycemia activates p53 and p53-regulated genes leading to myocyte cell death. Diabetes. 2001;50:2363–2375. doi: 10.2337/diabetes.50.10.2363. [DOI] [PubMed] [Google Scholar]
- Laakso M. Hyperglycemia and cardiovascular disease in type 2 diabetes. Diabetes. 1999;48:937–942. doi: 10.2337/diabetes.48.5.937. [DOI] [PubMed] [Google Scholar]
- Uehata M, Ishizaki T, Satoh H, Ono T, Kawahara T, Morishita T, Tamakawa H, Yamagami K, Inui J, Maekawa M, Narumiya S. Calcium sensitization of smooth muscle mediated by a Rho-associated protein kinase in hypertension. Nature. 1997;389:990–994. doi: 10.1038/40187. [DOI] [PubMed] [Google Scholar]
- Ishiko K, Sakoda T, Akagami T, Naka T, Doi T, Tsujino T, Masuyama T, Ohyanagi M. Hyperglycemia induced cell growth and gene expression via the serum response element through RhoA and Rho-kinase in vascular smooth muscle cells. Prep Biochem Biotechnol. 2010;40:139–151. doi: 10.1080/10826060903558927. [DOI] [PubMed] [Google Scholar]
- Kovacs P, Szilvassy Z, Hegyi P, Nemeth J, Ferdinandy P, Tosaki A. Effect of transdermal nitroglycerin on glucose-stimulated insulin release in healthy male volunteers. Eur J Clin Invest. 2000;30:41–44. doi: 10.1046/j.1365-2362.2000.00588.x. [DOI] [PubMed] [Google Scholar]
- Toblli J, Cao G, Rivas C, Munoz M, Giani J, Dominici F, Angerosa M. Cardiovascular protective effects of nebivolol in Zucker diabetic fatty rats. J Hypertens. 2010;28:1007–1019. doi: 10.1097/HJH.0b013e328337598c. [DOI] [PubMed] [Google Scholar]
- van Zwieten PA. Diabetes and hypertension: experimental models for pharmacological studies. Clin Exp Hypertens. 1999;21:1–16. doi: 10.3109/10641969909068644. [DOI] [PubMed] [Google Scholar]
- Cosson E, Valensi P, Laude D, Mesangeau D, Dabire H. Arterial stiffness and the autonomic nervous system during the development of Zucker diabetic fatty rats. Diabetes Metab. 2009;35:364–370. doi: 10.1016/j.diabet.2009.02.007. [DOI] [PubMed] [Google Scholar]
- Grinblat L, Pacheco Bolanos LF, Stoppani AO. Decreased rate of ketone-body oxidation and decreased activity of D-3-hydroxybutyrate dehydrogenase and succinyl-CoA:3-oxo-acid CoA-transferase in heart mitochondria of diabetic rats. Biochem J. 1986;240:49–56. doi: 10.1042/bj2400049. [DOI] [PMC free article] [PubMed] [Google Scholar]
- Durgan DJ, Smith JK, Hotze MA, Egbejimi O, Cuthbert KD, Zaha VG, Dyck JR, Abel ED, Young ME. Distinct transcriptional regulation of long-chain acyl-CoA synthetase isoforms and cytosolic thioesterase 1 in the rodent heart by fatty acids and insulin. Am J Physiol Heart Circ Physiol. 2006;290:H2480–H2497. doi: 10.1152/ajpheart.01344.2005. [DOI] [PubMed] [Google Scholar]
- Onody A, Csonka C, Giricz Z, Ferdinandy P. Hyperlipidemia induced by a cholesterol-rich diet leads to enhanced peroxynitrite formation in rat hearts. Cardiovasc Res. 2003;58:663–670. doi: 10.1016/S0008-6363(03)00330-4. [DOI] [PubMed] [Google Scholar]
- Escobales N, Crespo MJ. Oxidative-nitrosative stress in hypertension. Curr Vasc Pharmacol. 2005;3:231–246. doi: 10.2174/1570161054368643. [DOI] [PubMed] [Google Scholar]
- Kaneki M, Shimizu N, Yamada D, Chang K. Nitrosative stress and pathogenesis of insulin resistance. Antioxid Redox Signal. 2007;9:319–329. doi: 10.1089/ars.2006.1464. [DOI] [PubMed] [Google Scholar]
- Pacher P, Obrosova IG, Mabley JG, Szabo C. Role of nitrosative stress and peroxynitrite in the pathogenesis of diabetic complications. Emerging new therapeutical strategies. Curr Med Chem. 2005;12:267–275. doi: 10.2174/0929867053363207. [DOI] [PMC free article] [PubMed] [Google Scholar]
- Goodwin BL, Pendleton LC, Levy MM, Solomonson LP, Eichler DC. Tumor necrosis factor-alpha reduces argininosuccinate synthase expression and nitric oxide production in aortic endothelial cells. Am J Physiol Heart Circ Physiol. 2007;293:H1115–H1121. doi: 10.1152/ajpheart.01100.2006. [DOI] [PubMed] [Google Scholar]
- Goodwin BL, Corbin KD, Pendleton LC, Levy MM, Solomonson LP, Eichler DC. Troglitazone up-regulates vascular endothelial argininosuccinate synthase. Biochem Biophys Res Commun. 2008;370:254–258. doi: 10.1016/j.bbrc.2008.03.089. [DOI] [PubMed] [Google Scholar]
- Haines RJ, Corbin KD, Pendleton LC, Meininger CJ, Eichler DC. Insulin transcriptionally regulates argininosuccinate synthase to maintain vascular endothelial function. Biochem Biophys Res Commun. 2012;421:9–14. doi: 10.1016/j.bbrc.2012.03.074. [DOI] [PMC free article] [PubMed] [Google Scholar]
- Wang Y, Lam KS, Lam JB, Lam MC, Leung PT, Zhou M, Xu A. Overexpression of angiopoietin-like protein 4 alters mitochondria activities and modulates methionine metabolic cycle in the liver tissues of db/db diabetic mice. Mol Endocrinol. 2007;21:972–986. doi: 10.1210/me.2006-0249. [DOI] [PubMed] [Google Scholar]
- Staiger H, Haas C, Machann J, Werner R, Weisser M, Schick F, Machicao F, Stefan N, Fritsche A, Haring HU. Muscle-derived angiopoietin-like protein 4 is induced by fatty acids via peroxisome proliferator-activated receptor (PPAR)-delta and is of metabolic relevance in humans. Diabetes. 2009;58:579–589. doi: 10.2337/db07-1438. [DOI] [PMC free article] [PubMed] [Google Scholar]
- Yamada T, Ozaki N, Kato Y, Miura Y, Oiso Y. Insulin downregulates angiopoietin-like protein 4 mRNA in 3T3-L1 adipocytes. Biochem Biophys Res Commun. 2006;347:1138–1144. doi: 10.1016/j.bbrc.2006.07.032. [DOI] [PubMed] [Google Scholar]
- Misra MK, Sarwat M, Bhakuni P, Tuteja R, Tuteja N. Oxidative stress and ischemic myocardial syndromes. Med Sci Monit. 2009;15:RA209–RA219. [PubMed] [Google Scholar]
- Douglas KT. Mechanism of action of glutathione-dependent enzymes. Adv Enzymol Relat Areas Mol Biol. 1987;59:103–167. doi: 10.1002/9780470123058.ch3. [DOI] [PubMed] [Google Scholar]
- L'Ecuyer T, Allebban Z, Thomas R, Vander Heide R. Glutathione S-transferase overexpression protects against anthracycline-induced H9C2 cell death. Am J Physiol Heart Circ Physiol. 2004;286:H2057–H2064. doi: 10.1152/ajpheart.00778.2003. [DOI] [PubMed] [Google Scholar]
- Puskas LG, Nagy ZB, Giricz Z, Onody A, Csonka C, Kitajka K, Hackler L Jr, Zvara A, Ferdinandy P. Cholesterol diet-induced hyperlipidemia influences gene expression pattern of rat hearts: a DNA microarray study. FEBS Lett. 2004;562:99–104. doi: 10.1016/S0014-5793(04)00189-9. [DOI] [PubMed] [Google Scholar]
- Ivanovic-Matic S, Mihailovic M, Dinic S, Martinovic V, Bogojevic D, Grigorov I, Poznanovic G. The absence of cardiomyopathy is accompanied by increased activities of CAT, MnSOD and GST in long-term diabetes in rats. J Physiol Sci. 2010;60:259–266. doi: 10.1007/s12576-010-0093-z. [DOI] [PMC free article] [PubMed] [Google Scholar]
- Hung J, McQuillan BM, Chapman CM, Thompson PL, Beilby JP. Elevated interleukin-18 levels are associated with the metabolic syndrome independent of obesity and insulin resistance. Arterioscler Thromb Vasc Biol. 2005;25:1268–1273. doi: 10.1161/01.ATV.0000163843.70369.12. [DOI] [PubMed] [Google Scholar]
- Okamoto A, Iwamoto Y, Maru Y. Oxidative stress-responsive transcription factor ATF3 potentially mediates diabetic angiopathy. Mol Cell Biol. 2006;26:1087–1097. doi: 10.1128/MCB.26.3.1087-1097.2006. [DOI] [PMC free article] [PubMed] [Google Scholar]
- Allen-Jennings AE, Hartman MG, Kociba GJ, Hai T. The roles of ATF3 in glucose homeostasis. A transgenic mouse model with liver dysfunction and defects in endocrine pancreas. J Biol Chem. 2001;276:29507–29514. doi: 10.1074/jbc.M100986200. [DOI] [PubMed] [Google Scholar]
- Kloner RA, Przyklenk K, Whittaker P. Deleterious effects of oxygen radicals in ischemia/reperfusion. Resolved and unresolved issues. Circulation. 1989;80:1115–1127. doi: 10.1161/01.CIR.80.5.1115. [DOI] [PubMed] [Google Scholar]
- Hartman MG, Lu D, Kim ML, Kociba GJ, Shukri T, Buteau J, Wang X, Frankel WL, Guttridge D, Prentki M, Grey ST, Ron D, Hai T. Role for activating transcription factor 3 in stress-induced beta-cell apoptosis. Mol Cell Biol. 2004;24:5721–5732. doi: 10.1128/MCB.24.13.5721-5732.2004. [DOI] [PMC free article] [PubMed] [Google Scholar]
- Qi L, Saberi M, Zmuda E, Wang Y, Altarejos J, Zhang X, Dentin R, Hedrick S, Bandyopadhyay G, Hai T, Olefsky J, Montminy M. Adipocyte CREB promotes insulin resistance in obesity. Cell Metab. 2009;9:277–286. doi: 10.1016/j.cmet.2009.01.006. [DOI] [PMC free article] [PubMed] [Google Scholar]
- Kim JY, Lee SH, Song EH, Park YM, Lim JY, Kim DJ, Choi KH, Park SI, Gao B, Kim WH. A critical role of STAT1 in streptozotocin-induced diabetic liver injury in mice: controlled by ATF3. Cell Signal. 2009;21:1758–1767. doi: 10.1016/j.cellsig.2009.07.011. [DOI] [PMC free article] [PubMed] [Google Scholar]
- Kim JY, Song EH, Lee S, Lim JH, Choi JS, Koh IU, Song J, Kim WH. The induction of STAT1 gene by activating transcription factor 3 contributes to pancreatic beta-cell apoptosis and its dysfunction in streptozotocin-treated mice. Cell Signal. 2010;22:1669–1680. doi: 10.1016/j.cellsig.2010.06.007. [DOI] [PubMed] [Google Scholar]
- Fevre C, Bellenger S, Pierre AS, Minville M, Bellenger J, Gresti J, Rialland M, Narce M, Tessier C. The metabolic cascade leading to eicosanoid precursors–desaturases, elongases, and phospholipases A2–is altered in Zucker fatty rats. Biochim Biophys Acta. 2011;1811:409–417. doi: 10.1016/j.bbalip.2010.12.004. [DOI] [PubMed] [Google Scholar]
- Chahal J, Chen CC, Rane MJ, Moore JP, Barati MT, Song Y, Villafuerte BC. Regulation of insulin-response element binding protein-1 in obesity and diabetes: potential role in impaired insulin-induced gene transcription. Endocrinology. 2008;149:4829–4836. doi: 10.1210/en.2007-1693. [DOI] [PMC free article] [PubMed] [Google Scholar]
- Colomer JM, Mao L, Rockman HA, Means AR. Pressure overload selectively up-regulates Ca2+/calmodulin-dependent protein kinase II in vivo. Mol Endocrinol. 2003;17:183–192. doi: 10.1210/me.2002-0350. [DOI] [PubMed] [Google Scholar]
- Chen NH, Wang YL, Ding JH. Increased heart microsomal Na(+) K(+)-transporting ATPase activity by tetrandrine in spontaneously hypertensive rats. Zhongguo Yao Li Xue Bao. 1993;14:320–325. [PubMed] [Google Scholar]
- Boot-Handford RP, Tuckwell DS, Plumb DA, Rock CF, Poulsom R. A novel and highly conserved collagen (pro(alpha)1(XXVII)) with a unique expression pattern and unusual molecular characteristics establishes a new clade within the vertebrate fibrillar collagen family. J Biol Chem. 2003;278:31067–31077. doi: 10.1074/jbc.M212889200. [DOI] [PubMed] [Google Scholar]
- Omelchenko T. Regulation of collective cell migration by RhoGAP myosin IXA. Small GTPases. 2012;3:213–218. doi: 10.4161/sgtp.20495. [DOI] [PMC free article] [PubMed] [Google Scholar]
- Zhang Y, Resneck WG, Lee PC, Randall WR, Bloch RJ, Ursitti JA. Characterization and expression of a heart-selective alternatively spliced variant of alpha II-spectrin, cardi+, during development in the rat. J Mol Cell Cardiol. 2010;48:1050–1059. doi: 10.1016/j.yjmcc.2010.01.001. [DOI] [PMC free article] [PubMed] [Google Scholar]
- Yurube T, Takada T, Suzuki T, Kakutani K, Maeno K, Doita M, Kurosaka M, Nishida K. Rat tail static compression model mimics extracellular matrix metabolic imbalances of matrix metalloproteinases, aggrecanases, and tissue inhibitors of metalloproteinases in intervertebral disc degeneration. Arthritis Res Ther. 2012;14:R51. doi: 10.1186/ar3764. [DOI] [PMC free article] [PubMed] [Google Scholar]
- Banerjee I, Fuseler JW, Price RL, Borg TK, Baudino TA. Determination of cell types and numbers during cardiac development in the neonatal and adult rat and mouse. Am J Physiol Heart Circ Physiol. 2007;293:H1883–1191. doi: 10.1152/ajpheart.00514.2007. [DOI] [PubMed] [Google Scholar]