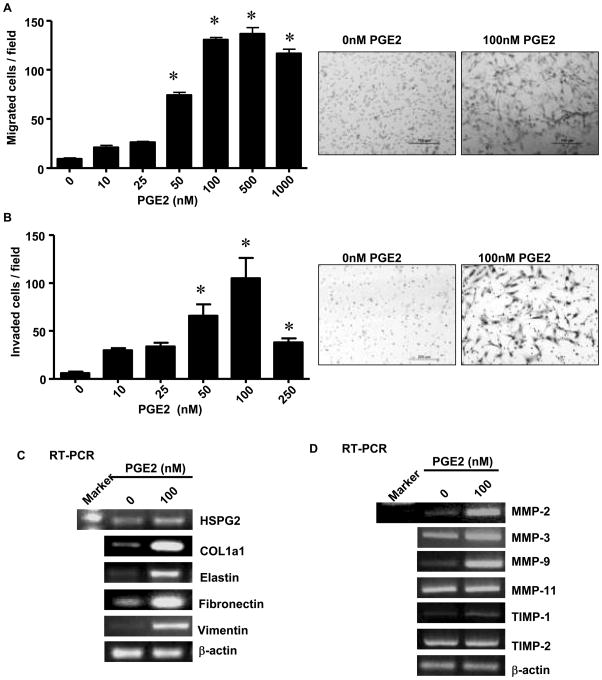
Fig.2. PGE2 stimulates migration, invasion and gene expression.
Cell migration and invasion were assessed by counting the number of stained cells that penetrated the migration membrane after 24h following PGE2 (100nM) stimulation. (A) membrane alone (right, stained cells; left migration numbers p<0.05 versus control) (B) matrigel coated membrane (right, stained cells; left migration numbers p<0.05 versus control) (C) RT-PCR showing the expression of HSPG2, COL1A1, elastin, fibronectin, vimentin and (D) the expression of MMP-2, 3, 9, 11 and TIMP-1, 2 before and after stimulation with PGE2 (100nM). β-actin served as control.

