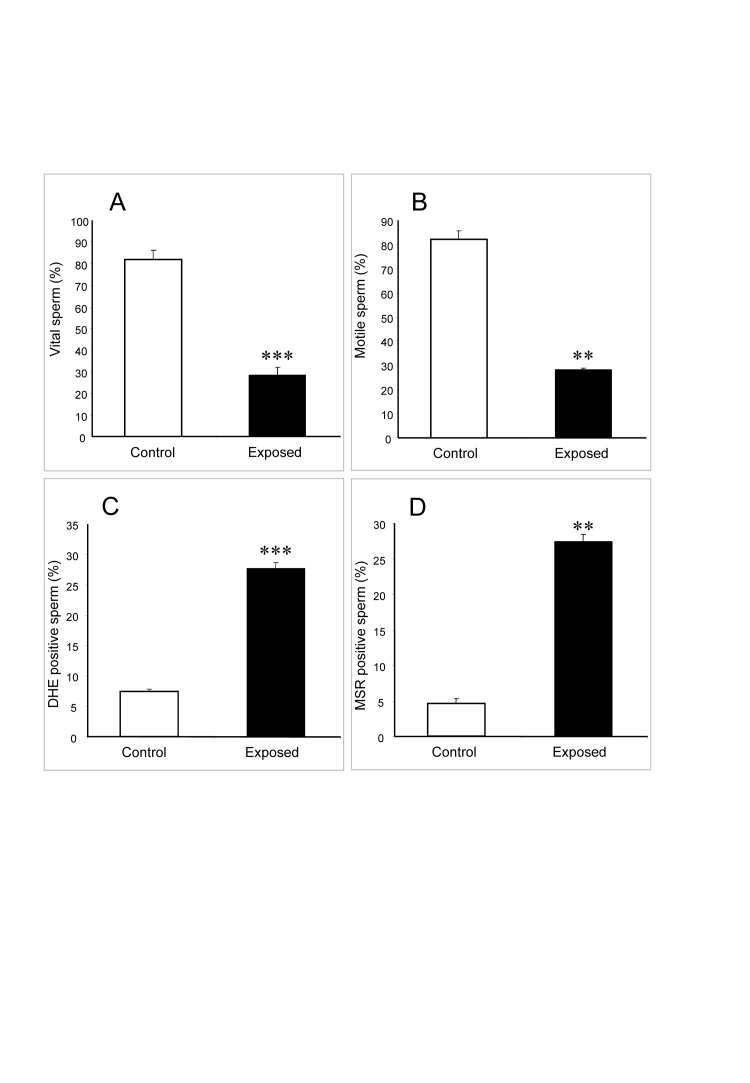
After a re-evaluation of the original data for Figure 1 in this article, it has come to our attention that the data set for the panel 1D was incorrectly transcribed from its source, as a result, we are providing a corrected file for Figure 1, the correct values reflecting the changes made in panel D are: 28% ± 1% for the exposed cells and 5% ± 1% for the control cells, with a p value of 0.0056.
Figure 1:
In addition, the number of biological replicates reported in the figure legends is incorrect, the data are based on 3 replicates and not 4 as stated in the article. In the figure legends for figures 1, 2, 3, 4 and 5, the number of independent samples should thus be changed from 4 to 3.
Footnotes
Competing Interests: No competing interests declared.


