

Abstract
Automated detection of seizures is still a challenging problem. This study presents an approach to detect seizure segments in Laplacian electroencephalography (tEEG) recorded from rats using the tripolar concentric ring electrode (TCRE) configuration. Three features, namely, median absolute deviation, approximate entropy, and maximum singular value were calculated and used as inputs into two different classifiers: support vector machines and adaptive boosting. The relative performance of the extracted features on TCRE tEEG was examined. Results are obtained with an overall accuracy between 84.81 and 96.51%. In addition to using TCRE tEEG data, the seizure detection algorithm was also applied to the recorded EEG signals from Andrzejak et al. database to show the efficiency of the proposed method for seizure detection.
Keywords: Seizure detection, Median absolute deviation (MAD), Approximate entropy (ApEnn), Maximum singular value (MSV), SVM, AdaBoost, Tripolar concentric ring electrodes (TCRE), Laplacian TCRE EEG (tEEG)
INTRODUCTION
Epilepsy is one of the most common chronic neurological disorders. It is characterized by the occurrence of abnormal rhythmic discharge of electrical activity of the brain during epileptic seizures.24 The occurrence of this brain malfunction is unpredictable, and may cause altered perception or behavior as sensory disturbances, or loss of consciousness. Seizures are a paroxysmal alteration of one or more neurological functions such as motor, behavior, and/or autonomic functions.24 Epileptic seizures are temporary events and rapidly developing. They are frequently observed in EEG recordings as rhythmic discharges or multiple spikes.27 Seizures are subdivided into two sets, i.e., partial and generalized. In partial seizures, a limited brain area is implicated in the epileptic discharge. 27 In contrast, generalized seizures originate from multiple brain regions and are characterized by general neurological symptoms.27 Epilepsy is commonly treated with anti-epileptic drugs; but for some patients, medications are not enough to restrain their seizures.21 Thus they are candidates for surgery in order to remove the damaged brain tissue.
Electroencephalogram (EEG) is a scalp recording of electrical activity from many neurons of the brain. EEG is an important tool in studying and diagnosing neurological disorders such as epilepsy, as it contains valuable information related to the different physiological states of the brain.24 EEG is commonly used to record the abnormal activities of the brain related to epileptic seizures. An abnormal EEG signal displays non-stationary behavior including spikes, sharp waves, or spike-and-wave, and focal mono-rhythmic discharges; so patients with epilepsy can have specific features in their EEG.27 Seizures are manifested in the EEG as paroxysmal events characterized by stereotyped repetitive waveforms that evolve in amplitude and frequency before eventually decaying.16 Therefore it is possible to detect seizure occurrence from significant parameters and dynamical changes in the EEG of epilepsy patients. The usual methods for seizure detection are based on data analysis by observing long recordings of continuous EEG signals, which is very monotonous and time-consuming process,11 because there are large amounts of data to analyze and the presence of artifacts may lead to false positive detections. Long-term EEG recordings increase the possibility to capture and analyze seizure events and also augment detection and diagnosis.27 For this purpose, automated seizure detection methods with high sensitivity and low false positive rates are of great significance in recognizing and reviewing EEG segments for epileptic seizure detection. Since the 1970s, automated seizure detection has been a challenge with several algorithms and methods developed,9,11,13,14,18,27 but no detector dominates with excellent sensitivity and specificity. This may be due to noise and artifacts such as eye movement and muscle activity, which make detection more difficult.27
Our proposed seizure detection method extracted EEG features and used them to classify whether data segments contained seizures or not. The features used were: median absolute deviation (MAD), approximate entropy (ApEn), and maximum singular value (MSV) which will be described later. The relative performance of these extracted features was examined using two different classifiers: support vector machines (SVM)28 and adaptive boosting (AdaBoost).10 SVM is a popular model for classification and regression.12 It is simple to use and only involves a kernel with some parameters to be set.28 For this paper a radial basis function (RBF)12 was chosen to test the performance of the system. AdaBoost is one of the most popular machine learning algorithms introduced in 1995 by Freund and Schapire,10 and it has had surprising results with classification.
The remainder of the paper is structured as follows: “Materials and Methods” section presents a general description of the tripolar EEG (tEEG) recorded using tripolar concentric ring electrodes (Fig. 1a) (TCRE). The experimental setup for recording with the dataset used in this work and the methodology employed is explained in detail (“Experimental Setup”’, “Data Characteristics”, and “Features Extraction” sections). The proposed method was also tested using the Andrzejak et al.2 database of EEG signals, and the results are discussed in “Results” section presents the evaluation of the method with the obtained results, followed by a general discussion about classifier accuracy in “Discussion” section. Finally, some conclusions with future work are offered.
FIGURE 1.

A typical tEEG data recording from a rat using TCRE; (a): The location of the tripolar concentric ring electrodes (TCREs) on the rat scalp. Electrode (1) is 10 mm dia. and used for stimulation and recording. Electrodes (2) and (3) are both 6.0 mm dia. and used only for recording. Electrode (r) is the isolated ground. Details of TCRE are shown to the right of the rat head from.19 (b): 30 min of data with and without seizure (with 460,800 samples). After 5 min of Baseline recordings the PTZ was administered. Soon after giving the PTZ, usually within 2 min, the rats had their first myoclonic jerk. (c): thirty seconds Baseline data (note that the vertical axis is magnified compared to panels (b) and (d)), (d): thirty seconds Seizure data.
MATERIALS AND METHODS
Laplacian Electroencephalogram
The surface potential distribution on the scalp reflects functional activities evolving from the brain.22 The variation in this surface can be recorded using an array of electrodes on the scalp, and then measuring the voltage between pairs of these electrodes. The scalp surface Laplacian is an alternative method for presenting EEG data with higher spatial resolution. It has been shown that the surface Laplacian (the second spatial derivative) is proportional to the cortical potentials and improves the high spatial frequency components of the brain activity near the electrode.3 To obtain the Laplacian, we take a new approach by using unique sensors and instrumentation for recording the signal.5,6 The unique sensor configuration which measures the Laplacian potential directly is the TCRE depicted in Fig. 1a.6,7 tEEG was defined in Besio et al.5,6 as 16 * (Vm − Vd) − (Vo − Vd) where Vm, Vo, Vd are the voltage of the middle ring, outer ring, and central disc of the tripolar electrode, respectively. Koka and Besio17 showed that TCRE provides approximately four times improvement in the signal-to-noise ratio, three times improvement in spatial resolution, and twelve times improvement in mutual information compared to disc electrode signals.
EXPERIMENTAL SETUP
The animal protocol used for recording the tEEG signal was approved by the University of Rhode Island IACUC. Approximately 24 h before the induction of seizures caused by pentylenetetrazole (PTZ), an adult male Sprague–Dawley rat 220–320 g was given a combination of 80 mg/kg of ketamine and 12 mg/kg xylazine (i.p) for anesthesia. The scalp was shaved and prepared with NuPrep abrasive gel (D. O. Weaver & Co., Aurora, CO, and USA). Three TCRE6 were applied to the scalp (Fig. 1a, one for stimulation and two for recording) using conductive paste 0.5 mm Ten 20, Grass Technologies, RI, USA, and adhered with Teet’s dental acrylic (Pearson Lab Supply, Sylmar, CA, USA). The TCRE number 1 centered on the top of the head, with diameter = 1 cm, and the width of each ring equal 0.9 mm, was used to record from and stimulate the brain. The front edge of the electrode was placed as close as possible to where the bregma was expected to be. The two other electrodes (2 and 3) with diameter = 6 mm and ring width = 0.4 mm were placed bilaterally behind the eyes, but in front of the ears. An isolated ground electrode (r) was placed on the top of the neck behind the ears. The electrodes were made of gold-plated copper. For approximately 24 h the rats were returned to their cages and allowed food and water ad libitum. On the next afternoon, the rats were placed in a transparent plastic cage and via a commutator and cables (Plastics One, Roanoke, VA) the electrodes were connected to a multiplexer. This multiplexer was first set to connect the electrodes to a Prep-Check Plus EIM-107 (General Devices, Ridgefield, NJ) to measure the skin-to-electrode impedance. The EEG recording and the video were started. After 5 min recording of baseline EEG, the PTZ was given (55 mg/kg, i.p.). The EEG signals were preamplified (gain 100 and 0.3 Hz high-pass filter) with a custom built preamplifier and then amplified using a Grass NRS2 Neurological Research System with Model 15A54 AC amplifiers (Grass Technologies, West Warwick, RI, USA) with a gain of 1000 and band pass of 1.0–100 Hz with the 60 Hz notch filter active, and digitized (16 bits, 256 Samples/s). The digitized signals were stored on a computer for offline analysis using Matlab (Mathworks Natick, MA, USA). The two differential signals from the electrode elements (outer ring, inner ring, and center disc) were combined using an algorithm to give a Laplacian derivation of the signal as described by Besio.6 The algorithm weights the difference between the middle ring and center disc sixteen times greater than the difference between the outer ring and the center disc.
DATA CHARACTERISTICS
In order to evaluate the performance of the proposed method for seizure detection, the tEEG data of ten rats have been used. The first 5 min from each recorded signal are considered as Baseline data (normal data without seizure). Firstly, the tEEG data were divided into 30 s segments with each segment containing 7680 samples (256 samples per second for 30 s). The selection of the Seizure segments was performed by an experienced behavioralist through visual inspections of the video recordings. Because of a large amount of artifacts and noise caused by grooming, chewing, and roaming of the rats during the recording, Baseline segments were selected after visual inspection where the tEEG appeared to be calm and artifacts free. The choice of 30 s segments duration is sufficient to detect seizure segments with our feature extraction and improve the computational task.14 The longer the duration of EEG segments, the better the discrimination between seizure and non-seizure events.14
If the detected tEEG segment matched a segment considered as a Seizure by the behavioralist, the segment was counted as a valid Seizure; otherwise it was considered a false positive. Two sets of tEEG data corresponding to the Baseline data and Seizure data were used as the investigational data set for seizure detection. The database included 70 Seizures segments and 65 Baseline segments comprising the total number of Seizures and Baseline segments recognized by the behavioralist.
FEATURES EXTRACTION
The detection of epileptic seizures in the EEG signals is very important in the diagnosis of epilepsy. Therefore, parameters extracted from EEG signals are valuable for epilepsy diagnosis. Before starting the analysis procedure for seizure detection, the tEEG signal is down-sampled from 256 to 128 Hz; this reduced the size of data and the computation time. Before down-sampling, the signal was filtered first using an anti-aliasing low-pass filter with a cutoff frequency 64 Hz, to avoid aliasing. The Matlab function down sample was used for the down-sampling procedure.
Prior to feature extraction, the tEEG data were segmented into 1 s duration in order to divide the segments into quasi-stationary epochs. In this paper, One-second EEG epoch is the best size were detection accuracy was achieved. A non-overlapping Hamming window was used to avoid redundancy caused by an overlap; also the classification results obtained by our algorithm gave better results without overlap. Based on the features extraction method for seizure detection, one of the most important questions is: what are the best features that should be extracted to discriminate between Seizures and non-Seizures.27 The features used in this work to detect seizure segments are: ApEn, MSV, and MAD. These features are applied for each 1 s epoch of the 30 s segments data. Figure 2 shows the variations in the values of the extracted features during Baseline and Seizure (data of Figs. 1c–1d). Features extraction methods are briefly described in the following sections. The version of Matlab used in this paper is V.10a.
FIGURE 2.

The values of the three features used for seizure detection (MAD in (a), ApEn in (b), and MSV in (c)) using Baseline data (from Fig. 1c) and Seizure data (from Fig. 1d). The oscillation of Seizure data in comparison to the Baseline data explains the high values of MAD and Max singular value. The values of ApEn for Seizure data are low compared to Baseline data.
Feature 1: Approximate Entropy (ApEn)
Entropy of a signal is a measure of the information contained in that signal. It follows that entropy is also a measure of uncertainty of random variables or a complexity measure of a dynamical system. ApEn is a nonlinear dynamical analysis that quantifies the degree of complexity and irregularity in a time series data such as estimation of regularity in epileptic seizure time series data.23 ApEn is less sensitive to noise and can be used for short-length data.13,18 The described methods by Dimbra et al.8 and Kumar et al.18 have shown that the value of the ApEn drops abruptly due to the synchronous discharge of neurons during an epileptic activity. Hence, it is a good feature in the automated detection of seizures.
Given N points, the ApEn ApEn (m, r, N) is equal to the negative average natural logarithm of the conditional probability that two similar sequences for m points stay analogous, that is, within a tolerance r, at the next point.25 The process of estimating ApEn is described in the following steps taken from13,18:
-
1
Let the original signal contain N data points: x(1), x(2), …, x(N).
-
2
Form length m vectors X̄(1), …, X̄ (N − m + 1) defined by: X̄ (i) = [x(i), x(i + 1), …, x(i + m − 1)], for 1 ≤ i ≤ N − m + 1.
These vectors represent m consecutive signal values, starting with the ith data point, x(i).
-
3The distance between two vectors X̄(i) and X̄(j) is defined as the maximum absolute difference value between their respective scalar components,
-
4
For a given X̄(i), find the number of j (j = 1, …, N − m + 1, j ≠ i) so that d[X̄(i), X̄(j)] ≤ r, denoted as Nm(i). Then, for i = 1, …, N − m + 1: ,
where measures the frequency of patterns similar to the one given by the window of length m within a tolerance r.
Here, we used a threshold level of r equal to 0.2*SD (SD is the standard deviation of the data sequence x(n)).
-
5Calculate the average natural logarithm of by:
(1) -
6Repeat the method described above (steps 2–5) for (m + 1), and the final value of ApEn is given by:
(2)
To compute ApEn values of signal with length N, the embedding dimension m is set to 5, and a tolerance window r is set to 0.2× the standard deviation of original data sequence. We also tried different values for r and m and by choosing m = 5 and r = 0.2* standard deviation of original data sequence; the best detection accuracy was achieved.
Feature 2: Maximum Singular Value (MSV)
The singular value decomposition (SVD) is a very powerful technique for recognizing and ordering the dimensions along which data points display the most variation. There are some fundamental ideas behind SVD15: (1) taking a high dimensional, (2) highly variable set of data points and (3) reducing the data to a lower dimensional space. These characteristics can make the original data more visible from noise. SVD decomposes a given matrix A into three different matrices as follows:
| (3) |
where U and V are orthogonal matrices, and Σ = diag(σi) is a diagonal matrix containing singular values σi in descending order of magnitude along its diagonal. The columns of the two matrices U and V are called the left and right singular vectors, respectively; they are mutually orthogonal. Larger singular values correspond to higher model correlation with the original data. For that reason, SVD allows the extraction of dominant samples from the recorded EEG data by keeping the largest singular values and setting to zero those with small values.1 In this work the maximum of the singular values is taken as a feature extracted for seizure detection.
Feature 3: Median Absolute Deviation (MAD)
The MAD is a measure of statistical dispersion. The absolute deviation of an element of a data set is the absolute difference between that element and a given point. Common measures of statistical dispersion are the variance and standard deviation. The MAD is considered a simpler way to quantify variation than the sample variance or standard deviation.
For data set X = x(1), x(2), …, x(N), the MAD is defined as the median of the absolute deviations from the data’s median26:
| (4) |
The MAD provides an absolute measure of dispersion that is not affected by outlier data that can throw off statistical analysis based on mean and standard deviation. MAD is more flexible with outliers existing in the data. So as large deviations are possible with seizure signals, a median based measure of dispersion will be a good choice for detection.4
EEG Seizure Detection
In order to reduce the dimensionality and computational complexity the following statistical features were evaluated for each 1 s epoch of extracted feature vectors: mean, minimum, maximum, and standard deviation.4,9 This will reduce the feature vectors into one having twelve features for both Baseline and Seizure data. The performance of the proposed seizure detection method was analyzed using two classifiers, namely SVM and Adaptive Boosting (AdaBoost).
Classifier 1: Support Vector Machine (SVM)
The basics of SVM algorithms has been developed by Vapnik28 to analyze data and recognize patterns. The Support Vector Machine has been used for classification and regression analysis12; in this context it is applied for classification of extracted features. The classification is done by constructing an N-dimensional hyper-plane that optimally separates the data into two categories by maximizing the distance from the decision boundary to the nearest data-points (called support vectors) in the training data. The MATLAB implementation of the SVM classifier is used for this study (bioinformatics toolbox—statistical learning (svmtrain, and svmclassify)). Since Seizure and non-Seizure classes are often not linearly separable, we generate non-linear decision boundaries using Gaussian RBF.12 Furthermore the classification results obtained by our algorithm give better results using the RBF kernel function.
Classifier 2: Adaptive Boosting (AdaBoost)
AdaBoost is one of the most popular machine learning algorithms introduced in 1995 by Freund and Schapire10; it has surprising good classification results. In theory, boosting can be used to reduce the error of any weak-learning algorithm that constantly creates classifiers which need to be better than random guessing. Similar to SVM, the AdaBoost algorithm works by combining several votes by using weak learners instead of using support vectors. The Ada-Boost. M1 algorithm described in Fig. 3 is adopted for our work.10 The algorithm takes as input the training set: D = {(fi, yi)}, i = 1, ..,N with fi ∈ F(instance space) and each label yi ∈ Y = {−1,1} (label set).
FIGURE 3.
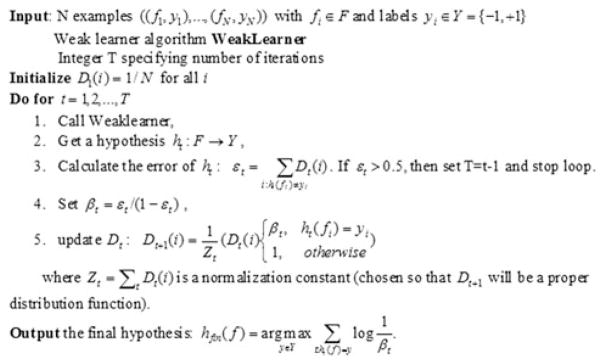
The AdaBoost classifier Algorithm.10
In the beginning the data have to be labeled for training, the Baseline segments labeled as “−1” and Seizure segments labeled as “+1.” The algorithm repeatedly calls a given weak or learning algorithm in a series of Rounds t = 1,…, T and preserves a distribution or a set of weights over training set. The weight of this distribution on training data i on round t is denoted Dt(i). In this work, the decision stumps29 were used as weak classifiers. A decision stump is a decision tree with one root node and two leaf nodes. It performs a single test on a single attribute with threshold θ. A decision stump can also be used to reduce the error of any Weak-Learning algorithm that constantly creates classifiers which need to be better than random guessing; it is constructed for each feature in the input data as:
| (5) |
for i = 1, .., N and t = 1, .., T. The weak learner’s goal is to find a hypothesis ht : F → Y which minimizes the training error: Such that, εt: is the sum of distribution weights of the instances misclassified by the hypothesis ht, (step 3 in the algorithm). And we require that this error be less than ½. This error is measured with respect to the weight of the distribution denoted by Dt(i). The data is re-weighted to increase the “importance” of misclassified samples (rule 5 shown in Fig. 3). This process continues and at each step the weight of each learner is determined. Finally, the strong classifier is defined as the output of this algorithm.
Statistical Parameters
To evaluate the performance of the proposed method, the first two-thirds of the feature vectors (for both Seizure and Baseline) were selected for training while the last one-third was used for testing. The results of classification and the performance of classifiers are expressed in terms of sensitivity, specificity, and accuracy (Table 2) which are defined as follows19:
TABLE 2.
A comparison of classification accuracy obtained using tEEG data and on-line EEG database described by Andrzejak et al.,2 via SVM and AdaBoost classifiers.
| Sensitivity (%) | Selectivity (%) | Accuracy (%) | |
|---|---|---|---|
| This work tEEG data | |||
| AdaBoost | 90.91 | 78.72 | 84.81 |
| SVM | 93.02 | 100 | 96.51 |
| Average | 91.96 | 89.36 | 90.66 |
| Andrzejak et al.2 database (Z-S) | |||
| AdaBoost | 100 | 96.88 | 98.44 |
| SVM | 100 | 100 | 100 |
| Average | 100 | 98.44 | 99.22 |
Sensitivity: Is the percentage of seizure segments correctly classified by the algorithm.
Specificity: Is the proportion of segments without seizures correctly classified by the algorithm.
Accuracy: Is the percentage of correctly classified segments to the total number of segments considering for classification.
TEST OF THE PROPOSED METHOD
The method described above using two classifiers (SVM, and AdaBoost) and three features (ApEn, MSV, MAD) was also tested using a publicly available database described by Andrzejak et al.2 which includes EEG data recorded using traditional electrodes for both healthy and epileptic patients. The database consists of five sets (denoted as Z, O, N, F and S) each containing 100 single-channel EEG segments of 23.6 s duration. The data were all recorded with the same 128-channel amplifier system and digitized at 173.6 Hz sampling rate and 12 bit A/D resolution; the bandwidth of the acquisition system was from 0.5 to 85 Hz. These segments were selected and cut out from continuous multi-channel EEG recordings after visual inspection where the data appear to be artifacts free.2 Sets Z and O consisted of segments taken from surface EEG recordings from five healthy volunteers recorded from the international 10–20 system locations. Volunteers were relaxed in a wake state with eyes open (Z) and eyes closed (O), respectively. EEG segments of subsets N and F contained only activity measured during seizure free intervals, whereas set S contained only seizure activity.
RESULTS
The proposed features extraction method is evaluated using two classifiers SVM and AdaBoost. Each tEEG segment is divided into epochs of predetermined length of 1 s duration. Three statistical features are extracted for each epoch. Table 1 presents the values of Max, Mean, Min and Std of extracted features described above, for Seizure and Baseline data of (Figs. 1c, 1d). It is very clear from this Table that there are definite differences between the Seizure and Baseline of tEEG signal. Analysis of Table 1 illustrates that the ApEn: Mean, Min and Std values during seizure activities had lower values compared to Baseline data. Also it is obvious that Seizure data have higher values of MAD and MSV compared to those of baseline data. Furthermore, the values are significantly different among the two classes of Seizure and Baseline tEEG signals (p = 0.038 for ApEn, and p ≺ 0.01 for MAD and MSV). These results suggest that the tEEG segments with Seizures describe a more complex behavior comparing the segments when there are non-Seizures events. Thus, these features should be suitable to characterize the tEEG signals.
TABLE 1.
Statistical values of extracted features from tEEG data of Figs. 1c–1d.
| Baseline data
|
Seizure data
|
|||||||
|---|---|---|---|---|---|---|---|---|
| Features | Max | Mean | Min | Std | Max | Mean | Min | Std |
| Approximate entropy (ApEn) | 1.5044 | 1.2945 | 0.9708 | 0.1252 | 1.6378 | 1.1846 | 0.6341 | 0.2530 |
| Maximum singular value (MSV) | 0.0289 | 0.0206 | 0.0125 | 0.0036 | 2.7634 | 0.5409 | 0.1109 | 0.4938 |
| Median absolute deviation (MAD) | 0.0025 | 0.0016 | 0.0011 | 3.3006e–004 | 0.2740 | 0.0508 | 0.0101 | 0.0491 |
Sets Z and S from online EEG dataset2 were selected to test the method proposed for seizure detection. The database was analyzed under the same experimental conditions, and with the same procedure but without down-sampling or filtering the data (the data have already gone through the preprocessing steps, and considered artifact free). The values of features used for automatic detection (MAD, ApEn, and MSV) are shown in Fig. 4. The values of MAD and MSV during a seizure are higher compared to that of Normal state. Furthermore, Fig. 4 shows that the Seizure data have lower ApEn values compared to the Normal data due to its rhythmicity.
FIGURE 4.

Example of EEG segments from Z and S sets respectively—(top); the values of extracted features (ApEn, MSV, and MAD) from Andrzejak et al.2 database (in a–c, respectively). It is clear that the values of MAD and MSV are higher for Seizure data than for Normal data, but the ApEn for Normal data are higher than those for Seizure.
As shown in Table 2, the linear classification using the AdaBoost algorithm classified tEEG Seizure and Baseline segments with a very promising accuracy of 84.81%. Comparatively, the non-linear classification using SVM algorithm (with RBF kernel) had an accuracy of 96.51%. Even higher classification accuracies were achieved using Andrzejak et al.2 database with 98.44% accuracy via AdaBoost algorithm and 100% using the SVM classifier. This performance is expected since the Andrzejak data are considered artifact free, whereas our tEEG data recordings using TCREs contain noise and artifacts because the signals are recorded from the scalp and the rats are roaming, grooming, chewing, running, etc.
DISCUSSION
In this paper, an automatic method for seizure detection from tEEG recordings using TCRE was proposed. The method is based on three different features, MAD, ApEn, and MSV. Additional features were tested for seizure detection such as: “Shannon Entropy, Root Mean Square (RMS), Variance, Standard deviation”, and others. The three features settled on and used for this work were chosen since they provide all together the least classification errors, and best performance in the characterization of Seizure events using tEEG signals. This method is evaluated using two different classifiers; the extracted features were fed into the non-linear classifier (SVM) and linear classifier (AdaBoost) algorithms after dimensionality reduction (using statistical features: max, min, mean, and std). This reduction decreases the classification complexity without losing high performance. The results of Table 2 showed that the SVM classifier gave better results than AdaBoost. We feel this is due to the non-linear separation of Seizure and non-seizure classes. Therefore, the SVM with its non-linear decision boundary can distinguish Baseline from Seizure data, better than AdaBoost using a linear decision stump.
The proposed scheme was tested using tEEG data recorded from ten rats. Promising results were obtained even with the existence of artifacts and noise during recording of the data. On the other hand, the results derived from the on-line EEG database2 have even better performance results since those signals are considered as artifact free. Among the published works for seizure detection, there are a number of methods that deal with detection of epileptic seizure using the same on-line EEG database described by Andrzejak et al.2 For example Guo et al.13 applied ApEn derived from multiwavelet transform to classify EEG signals. Their results were very promising with an overall accuracy from 98.27 to 99.85%. Fathima et al.9 use the wavelet based features for the classification between Normal and Seizure EEG signals via a linear classifier with an accuracy of 99.5%. Bedeeuzzaman et al.4 have proposed a time domain analysis of the EEG data set and the classification based on linear discriminate function with an accuracy of 100%. Comparing these techniques,4,9,13 with our proposed method, the results obtained from the evaluation of our method using SVM classifier are better than those obtained by Fathima et al.9 and Guo et al.,13 and are as good as the results obtained by Bedeeuzzaman et al.4
The major limitation of our study was that we could not use all the data recorded. We had to pick a small segment of baseline data, 30 s duration, which was the least contaminated with artifacts. The artifacts and noise were caused by the rats roaming, grooming, and other behaviors during the recording. Even in the presence of strong artifacts, our methods worked quite well suggesting they are robust.
Recently Makeyev et al.20 demonstrated the feasibility of an automatic seizure control system in rats with PTZ-induced seizures through single and multiple doses of transcranial focal electrical stimulations (TFS) applied through the same TCREs used for recording tEEG. These stimulations were automatically triggered by a real-time electrographic seizure activity detector based on a disjunctive combination of detections from a cumulative sum algorithm and a generalized likelihood ratio test. An average seizure onset detection accuracy of 76.14% was obtained for the test set. Detection of electrographic seizure activity was accomplished in advance of the early behavioral seizure activity in 76.92% of the cases. Automatically triggered TFS significantly (p = 0.001) reduced the electrographic seizure activity power in the once stimulated group compared to controls in 70% of the cases. We hope that the new methods described in this manuscript will improve our automated seizure onset detection accuracy even further.
CONCLUSION
In this paper, a method to develop a classifier for recognizing seizures was proposed. A new tEEG feature vector based on MAD, ApEn, and MSV was used as input into two different classifiers: SVM and AdaBoost. We conclude that the combination of these features with the SVM provides the best accuracy on tEEGrat data set. The proposed method was also tested using the EEG database described by Andrzejak et al.2 and had very high accuracy classifying human epileptic seizure events. Further, we showed how the method for detecting seizure segments was robust; it achieved high accuracy from tEEG signals even though the data were contaminated with artifacts. The recommended modification in future works is to use longer duration data recordings, for better automation and detection.
Acknowledgments
The authors would like to thank lab members Xiang Liu, Liling Wang, and Oleksandr Makeyev for performing the experiments to collect the data. The project described was supported in part by Award Number R21NS061335 from the National Institute of Neurological Disorders and Stroke. The content is solely the responsibility of the authors and does not necessarily represent the official views of the National Institute of Neurological Disorders and Stroke or the National Institutes of Health.
References
- 1.Adjouadi M, Cabrerizo M, Ayala M, Mirkovic N. Seizing lesions in 3-D. IEEE Potentials. 2006;24:11–17. [Google Scholar]
- 2.Andrzejak RG, Lehnertz K, Mormann F, Rieke C, David P, Elger CE. Indication of nonlinear deterministic and finite dimensional structures in time series of brain electrical activity: dependence on recording region and brain state. Phys Rev E Stat Nonlinear Soft Matter Phys. 2001;64(6 Pt 1):061907. doi: 10.1103/PhysRevE.64.061907. [DOI] [PubMed] [Google Scholar]
- 3.Babiloni F, Babiloni C, Fattorini L, Carducci F, Onorati P, Urbano A. Performances of surface Laplacian estimators: a study of simulated and real scalp potential distributions. Brain Topogr. 1995;8:35–45. doi: 10.1007/BF01187668. [DOI] [PubMed] [Google Scholar]
- 4.Bedeeuzzaman M, Farooq O, Khan YU. Dispersion measures and entropy for seizure detection. IEEE Intern Conf. ICASSP; 2011. pp. 673–676. [Google Scholar]
- 5.Besio W, Cao H, Zhou P. Application of tripolar concentric electrodes and pre-feature selection algorithm for brain-computer interface. IEEE Trans Neural Syst Rehabil Eng. 2008;16(2):191–194. doi: 10.1109/TNSRE.2007.916303. [DOI] [PubMed] [Google Scholar]
- 6.Besio W, Koka K, Aakula R, Dai W. Tri-polar concentric ring electrode development for Laplacian electroencephalography. IEEE Trans BME. 2006;53:926–933. doi: 10.1109/TBME.2005.863887. [DOI] [PubMed] [Google Scholar]
- 7.Besio W, Liu X, Wang L, Medvedev AV, Koka K. Transcutaneous focal electrical stimulation via concentric ring electrodes reduces synchrony induced by pentylenetetrazole in beta and gamma bands in rats. Int J Neural Syst (IJNS) 2011;21(2):139–149. doi: 10.1142/S0129065711002729. [DOI] [PubMed] [Google Scholar]
- 8.Diambra L, de Figueiredo J, Malta C. Epileptic activity recognition in EEG recording. Phys A. 1999;273:495–505. [Google Scholar]
- 9.Fathima T, Bedeeuzzaman M, Farooq O, Khan YU. Wavelet based features for epileptic seizure detection. MES J Technol Manag. 2011 May;2(1):108–112. [Google Scholar]
- 10.Freund Y, Schapire RE. A decision-theoretic generalization of on-line learning and an application to boosting. J Comput Sys Sci. 1997;55(1):119–139. [Google Scholar]
- 11.Gotman J. Automatic recognition of epileptic seizures in the EEG. Electroencephalogr Clin Neurophysiol. 1982;54(5):530–540. doi: 10.1016/0013-4694(82)90038-4. [DOI] [PubMed] [Google Scholar]
- 12.Gunn SR. Technical Report. University of SOUTHAMPTON; 1998. Support vector machines for classification and regression. [Google Scholar]
- 13.Guo L, Rivero D, Pazos A. Epileptic seizure detection using multiwavelet transform based approximate entropy and artificial neural networks. J Neurosci Methods. 2010;193(1):156–163. doi: 10.1016/j.jneumeth.2010.08.030. [DOI] [PubMed] [Google Scholar]
- 14.Hassanpour H, Mesbah M, Bouashash B. Time-frequency feature extraction of newborn EEG seizure using SVD-based techniques. EURASIP J Appl Signal Process. 2004;16:2544–2554. [Google Scholar]
- 15.Kalman D. A singularly valuable decomposition: the SVD of a matrix. Coll Math J. 1996;27:2–23. [Google Scholar]
- 16.Karayiannis NB, Mukherjee A, Glover JR, Ktonas PY, Frost JD, Jr, Hrachovy RA, Mizrahi EM. Detection of pseudo-sinusoidal epileptic seizure segments in the neonatal EEG by cascading a rule-based algorithm with a neural network. IEEE Trans Biomed Eng. 2006;53(4):633–641. doi: 10.1109/TBME.2006.870249. [DOI] [PubMed] [Google Scholar]
- 17.Koka K, Besio W. Improvement of spatial selectivity and decrease of mutual information of tri-polar concentric ring electrodes. J Neurosci Methods. 2007;165:216–222. doi: 10.1016/j.jneumeth.2007.06.007. [DOI] [PubMed] [Google Scholar]
- 18.Kumar Y, Dewal ML. Complexity measures for normal and epileptic EEG signals using ApEn, SampEn and SEN. Int J Comput Commun Technol (IJCCT) 2011;2(1):6–12. [Google Scholar]
- 19.Lalkhen AG, McCluskey A. Clinical tests: sensitivity and specificity. Oxford J Med BJA: CEACCP. 2008;8(6):221–223. [Google Scholar]
- 20.Makeyev O, Liu X, Luna-Munguia H, Rogel-Salazar G, Mucio-Ramirez S, Liu Y, Sun YL, Kay SM, Besio WG. Toward a noninvasive automatic seizure control system in rats with transcranial focal stimulations via tripolar concentric ring electrodes. IEEE TNSRE. 2012;20(4):422–431. doi: 10.1109/TNSRE.2012.2197865. [DOI] [PMC free article] [PubMed] [Google Scholar]
- 21.Mormann F, Andrzejak RG, Elger CE, Lenhnertz K. Seizure prediction: the long and winding road. Brain. 2006;130(2):314–333. doi: 10.1093/brain/awl241. [DOI] [PubMed] [Google Scholar]
- 22.Ochoa JB. EEG signal classification for brain computer interface application. Ecole Polytechnique Federale De Lausanne. 2002;7:1–72. [Google Scholar]
- 23.Radhakrishnan N, Gangadhar B. Estimating regularity in epileptic seizure time-series data: a complexity-measure approach. IEEE Eng Med Biol. 1998;17:89–97. doi: 10.1109/51.677174. [DOI] [PubMed] [Google Scholar]
- 24.Rho JM, Sankar R. Epilepsy: mechanisms, models, and translational perspectives. CRC Press; New York: 2010. p. 684. [Google Scholar]
- 25.Richman JS, Moorman JR. Physiological time-series analysis using approximate entropy and sample entropy. Am J Physiol. 2000;278(6):H2039–H2049. doi: 10.1152/ajpheart.2000.278.6.H2039. [DOI] [PubMed] [Google Scholar]
- 26.Rouss PJ, Croux C. Alternatives to the median absolute deviation. J Am Stat Assoc. 1993;88(424):1273–1283. [Google Scholar]
- 27.Tzallas AT, Tsipouras MG, Tsalikakis DG, Karvounis EC, Astrakas L, Konitsiotis S, Tzaphlidou M. Automated epileptic seizure detection methods: a review study. In: Stevanovic D, editor. Epilepsy-histological, electroencephalographic and psychological aspects. 2012. pp. 75–98. [Google Scholar]
- 28.Vapnik VN. The Nature of Statistical Learning Theory. New York: Springer; 1995. p. 188. [Google Scholar]
- 29.Viola P, Jones M. Rapid object detection using a boosted cascade of simple features. Proc. Int. Conf. Comput. Vis. Pattern Recog; 2001. pp. I-511–I-518. [Google Scholar]