Abstract
Unlike the digestive systems of vertebrate animals, the lumen of the alimentary canal of C. elegans is unsegmented and weakly acidic (pH ~ 4.4), with ultradian fluctuations to pH > 6 every 45 to 50 seconds. To probe the dynamics of this acidity, we synthesized novel acid-activated fluorophores termed Kansas Reds. These dicationic derivatives of rhodamine B become concentrated in the lumen of the intestine of living C. elegans and exhibit tunable pKa values (2.3–5.4), controlled by the extent of fluorination of an alkylamine substituent, that allow imaging of a range of acidic fluids in vivo. Fluorescence video microscopy of animals freely feeding on these fluorophores revealed that acidity in the C. elegans intestine is discontinuous; the posterior intestine contains a large acidic segment flanked by a smaller region of higher pH at the posterior-most end. Remarkably, during the defecation motor program, this hot spot of acidity rapidly moves from the posterior intestine to the anterior-most intestine where it becomes localized for up to 7 seconds every 45 to 50 seconds. Studies of pH-insensitive and base-activated fluorophores as well as mutant and transgenic animals revealed that this dynamic wave of acidity requires the proton exchanger PBO-4, does not involve substantial movement of fluid, and likely involves the sequential activation of proton transporters on the apical surface of intestinal cells. Lacking a specific organ that sequesters low pH, C. elegans compartmentalizes acidity by producing of a dynamic hot spot of protons that rhythmically migrates from the posterior to anterior intestine.
Introduction
Although most biology thrives near neutral pH, high levels of acidity are common in specialized biological environments such as the gastric fluids of vertebrate animals (pH 1.5–2.5).1, 2 This compartmentalized acidity activates digestive enzymes and serves as a bactericidal barrier against ingested microorganisms.3 In contrast, the soil-dwelling nematode Caenorhabditis elegans (C. elegans) lacks intestinal compartments, and the lumen of its unsegmented alimentary canal has been reported to be weakly acidic at pH ~ 4.4.4 Remarkably, every 45 to 50 seconds, during the defecation motor program (DMP),5 this value transiently rises to ~ 6.3.4 This change in pH is initiated by activation of the inositol triphosphate receptor and release of intracellular calcium in intestinal cells.6–8 The mobilization of H+ during this process, and transport of protons across basolateral membranes by the Na+/H+ exchanger PBO-4 (NHX-7), allows these protons to function as neurotransmitters that trigger muscle contraction required for the elimination of waste products.9, 10 Both the Na+/H+ exchanger NHX-2 and the V-ATPase a-subunit VHA-6 on the apical surface of intestinal cells contribute to acidification of the lumen of the C. elegans intestine.4
Nehrke and coworkers4 previously analyzed rhythmic changes in the pH of the intestine of C. elegans by fluorescence imaging of ingested Oregon Green dextran. This fluorescent probe (pKa ~ 4.7),11, 12 like many other pH-sensitive fluorophores,13, 14 and fluorescent proteins (pKa 6.2–7.1),15–17 is quenched by acid, limiting its ability to detect dynamic changes in acidity, especially when the pH decreases to values below the pKa. Additionally, this anionic fluorophore does not accumulate to high levels in the intestine of C. elegans, further restricting its utility for imaging pH dynamics in the lumen. Only a few acid-activated fluorophores have been described,14, 18, 19 and cationic fluorophores designed for imaging of acidity in the alimentary canal of freely feeding animals have not been previously reported.
Results and Discussion
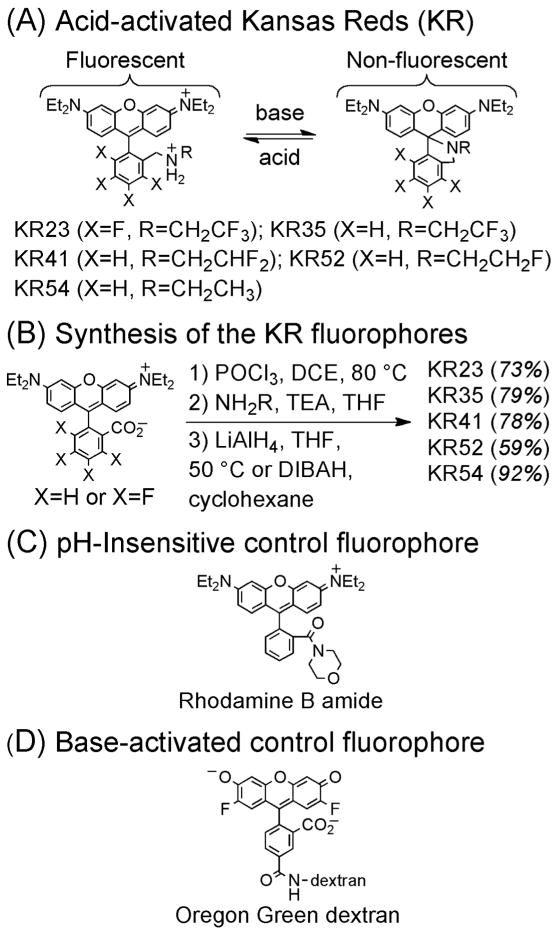
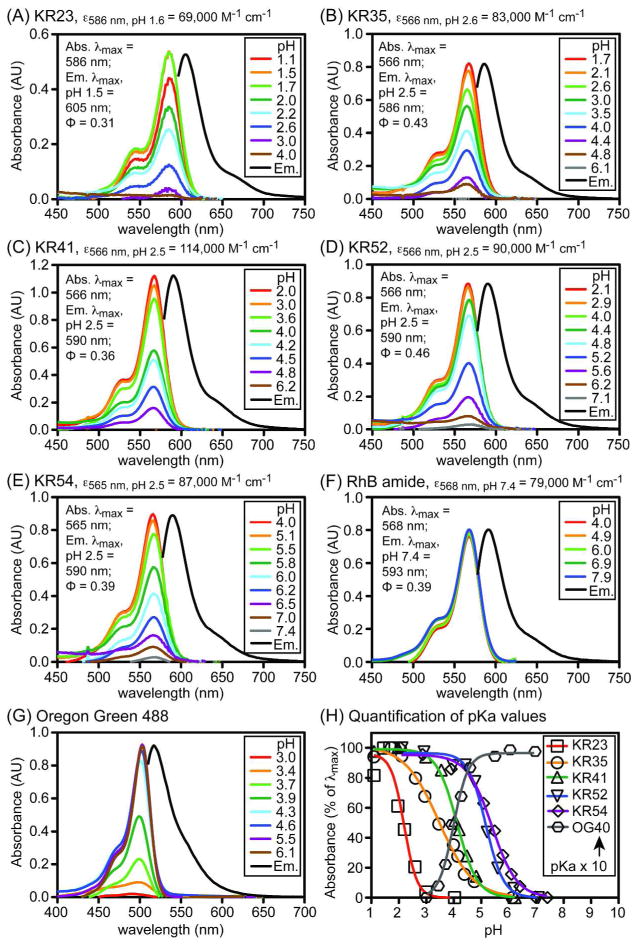
To create acid-activated fluorophores useful for imaging of acidic biological microenvironments such as the intestine of C. elegans, we synthesized a novel series of amine-modified analogues of rhodamine B (RhB, Figure 1, panel A). Termed Kansas Reds (KR), these analogues include alkylamine or fluoroalkylamine substituents that allow tuning of pKa values to levels comparable to the pH of acidic biological environments. These compounds were prepared in three steps from RhB and tetrafluororhodamine B (Figure 1, panel B). As a pH-insensitive control, a related amide derivative of RhB (Figure 1, panel C) was prepared using methods reported for the preparation of other pH-insensitive rhodamine derivatives.20, 21 As predicted from prior reports of structurally similar compounds,18 the absorbance and emission of the KR fluorophores were strongly enhanced by decreased pH (Figure 2, panels A–E). As control compounds, the spectral properties of the RhB amide were confirmed to be insensitive to changes in pH in the range of 4–8 (Figure 2, panel F), and the absorbance and fluorescence of commercially available Oregon Green 488,12 a base-activated fluorophore analogous to Oregon Green dextran (Figure 1, panel D), were enhanced by increases in pH in this range (Figure 2, panel G). Curve fitting of absorbance data of the pH-sensitive fluorophores in simulated gastric fluid, consisting of aqueous bovine serum albumin (BSA, 1%), Triton X-100 (1%), and DMSO (1%), yielded pKa values of 2.3 to 5.4, inversely proportional to the extent of fluorination (Figure 2, panel H). This simulated gastric fluid, designed to mimic the protein and lipid-rich biological environment of the lumen of the intestine, limits aggregation of fluorophores, resulting in lower apparent pKa values (~ 0.6 to 0.8 units) than would be measured in the absence of detergent.
Figure 1.
Panel A: Structures of the Kansas Red (KR) fluorophores. Panel B: Synthesis of the KR fluorophores. Panels C–D: Structures of control compounds used as mechanistic probes.
Figure 2.
Spectral properties of the Kansas Red fluorophores and control compounds. Panels A–G: Absorbance spectra of compounds (10 μM) acquired in simulated gastric fluid comprising aqueous buffer containing BSA (1%), Triton X-100 (1%), and DMSO (1%) at the pH values shown. Fluorescence emission spectra (Em.), obtained in phosphate (10 mM) buffers (pH 1.5 for KR23 and pH 2.5 for KR35-KR54 fluorophores) containing Triton X-100 (1%), normalized to 100% of the abs. λmax peak. Panel H: Quantification of pKa values from absorbance measurements. OG40: Oregon Green 488 fluorophore with pKa = 4.0 in simulated gastric fluid. Relative quantum yields of acid-activated fluorophores were determined in ethanol containing 1% TFA. Data used to calculate extinction coefficients and quantum yields is provided in the supporting information.
Video microscopy of C. elegans freely feeding on media containing the Kansas Red dyes revealed that these compounds exhibit robust fluorescence in the lumen of the intestine. Beneficially, transfer of living animals from media containing these compounds (10 μM) to media lacking the fluorophore revealed strong intestinal fluorescence throughout multiple defecation cycles, indicating that these compounds are well retained in the lumen of the intestine over time. Confocal imaging of transgenic C. elegans expressing a green fluorescent oligopeptide transporter (PEPT-1GFP) on the apical surface of intestinal cells (strain KWN246),22 after feeding on media containing red fluorescent KR35, revealed essentially complete fluorescence colocalization of the red and green fluorophores at the luminal surface (Figure 3). These results might be explained by electrostatic interactions between the cationic KR fluorophores and anionic moieties such as sialic acids of mucin proteins23 on the apical surface of intestinal cells.
Figure 3.
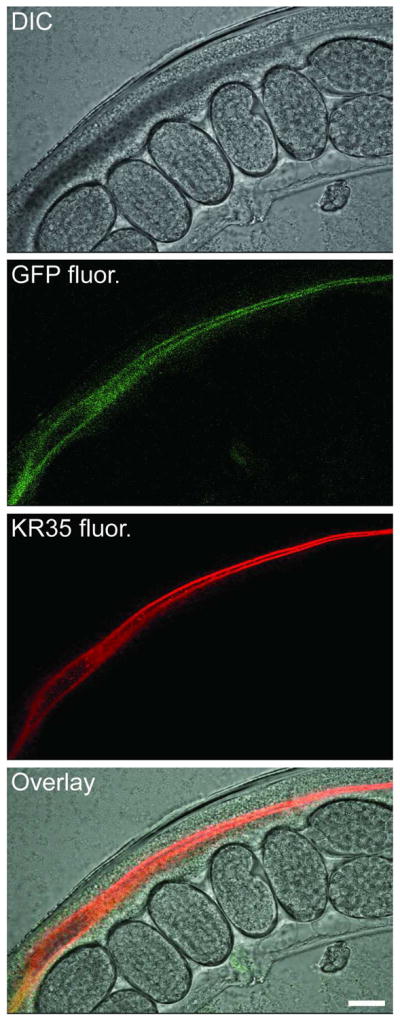
DIC and confocal micrographs of the intestine of mechanically-immobilized transgenic C. elegans expressing PEPT-1GFP on the apical face of intestinal cells after feeding on KR35 (10 μM). Scale bar = 20 microns.
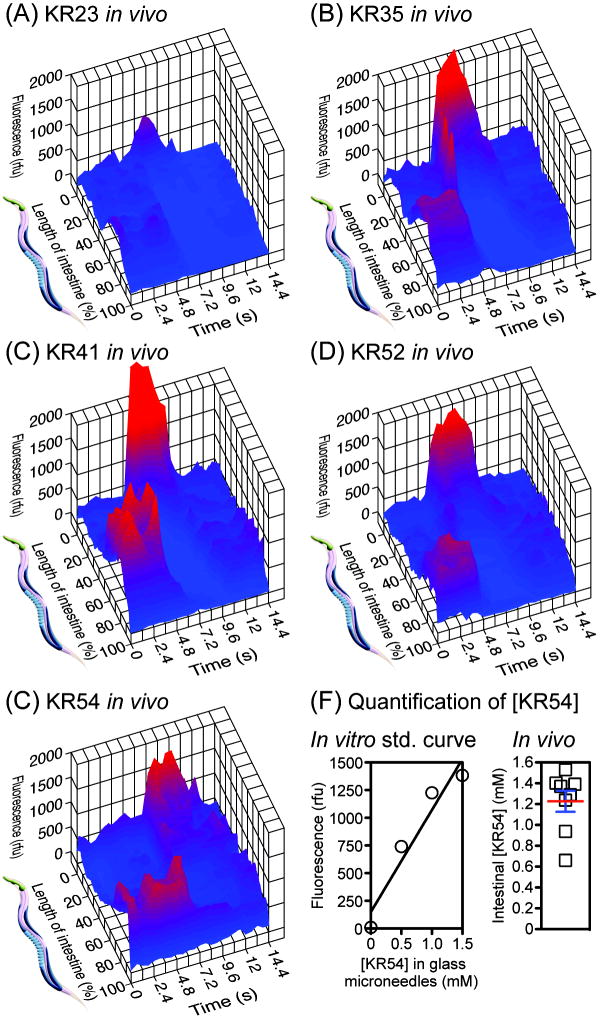
Between DMP cycles, fluorescence video microscopy of KR35 in freely feeding, unrestrained C. elegans revealed bright fluorescence localized in the posterior intestine (Figure 4, t = 0 s). However, approximately every 45 to 50 seconds, immediately following the posterior body wall muscle contraction (pBoc, Figure 4, t = 2 s), this posterior fluorescence smoothly transitioned to the anterior, filling the anterior-most intestine with intense fluorescence that persisted for up to seven seconds (Figure 4, t = 4, 6 s). This was followed by dissipation and transition of some fluorescence back to the posterior intestine over a total period of 10 to 12 seconds (Figure 4, t = 8 s, and supporting video). Complete reacidification of the posterior intestine occurred more gradually over ~ 30 seconds, consistent with previous studies of Oregon Green dextran.4 As shown in Figure 5, quantitative analysis of video microscopy images obtained from animals treated with KR23, KR41, KR52, and KR54 showed the same dynamic posterior to anterior to posterior (PAP) transition during the DMP. Differences in intensity of intestinal fluorescence appear to be dependent on a combination of extent of uptake by a given animal and the pKa of the fluorophores (Figure 5). In these experiments, fluorescence values throughout the intestine for each video frame were quantified by microscopy using a polyline ROI method, and the length of the intestine in each frame was normalized to 100% to correct for contraction during the DMP. These results indicate that the KR fluorophores can be used to visualize both steady-state intestinal acidity as well as a previously undetected dynamic PAP wave of intestinal acidity that propagates in vivo during the DMP.
Figure 4.
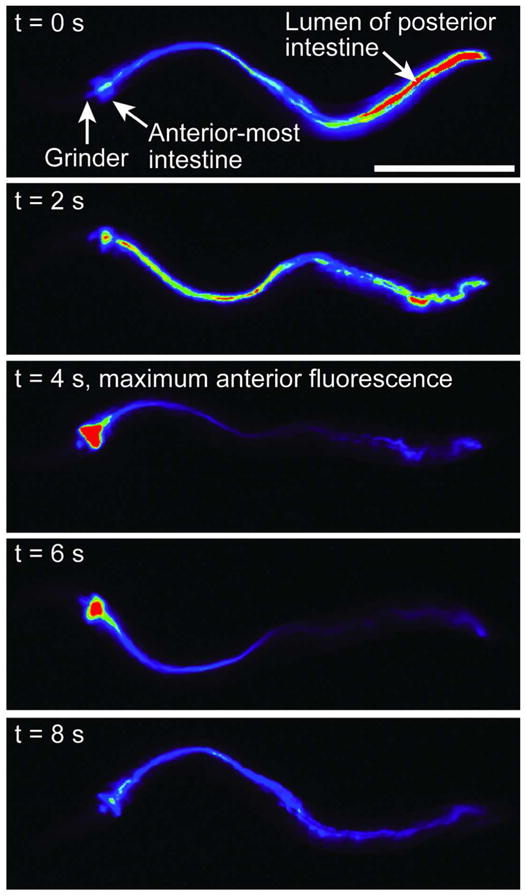
Fluorescence micrographs of unrestrained C. elegans after feeding on KR35 for 30 min (10 μM). Time-dependent images during the DMP extracted from video microscopy are shown. Fluorescence is rendered as a spectrum heat-map, with red representing the most intense fluorescence (highest acidity) and black the least intense fluorescence (lowest acidity). The head of the animal is on the left side of each image. Scale bar = 250 microns.
Figure 5.
Panels A–E: Three-dimensional plots of changes in fluorescence in the intestine of unrestrained C. elegans during the DMP. Single frames isolated from video microscopy were normalized and analyzed after animals fed on media containing KR23, KR35, KR41, KR52, or KR54 (10 μM, 0.1% DMSO) for 30 min. Maximum anterior fluorescence was observed at t ~ 7.2 s. Each plot represents analysis of a single animal. Panel F, left: Fluorescence standard curve constructed by imaging of KR54 in glass microneedles, pulled to an internal diameter of 15 microns, filled with this fluorophore in aqueous solution (pH 2.5) containing BSA (1%), Triton X-100 (1%), and DMSO (10%). This elevated concentration of DMSO (10%) facilitated solubility of the fluorophore at high (e.g. mM) concentration in needles. Panel F, right: Quantification of the concentration of KR54 in the lumen of the posterior intestine, between DMP cycles, assuming an intestinal pH of 4.4. Each data point represents analysis of a single animal (mean ± SEM shown).
Based on the previously reported acidity of the C. elegans intestine (pH ~ 4.4),4 the concentration of KR54 in the intestine of freely feeding animals was examined by analysis of images acquired by video microscopy. This was accomplished by quantification of the most fluorescent segment of the lumen of the posterior intestine, which was measured to have an average diameter of 15 microns. To construct a standard curve for comparison, glass microneedles were drawn by conventional techniques to an identical internal diameter of 15 microns. These needles were loaded with fluorophore at a variety of concentrations at pH 2.5 in simulated gastric fluid to fully protonate the fluorophore, and fluorescence was quantified by microscopy with the same camera and optical settings used for imaging of animals. As shown in Figure 5 (panel F), linear regression was used to generate a standard curve for KR54 as a function of concentration in a 15-micron diameter tube that matches the measured internal diameter (15 ± 3 microns) of ≥ 93% of the intestine of adult C. elegans. Near the anterior-most intestine, the diameter of the lumen widens to a maximum of 33 ± 3 microns. Based on the assumption that KR54 is 90% protonated in the intestine at pH 4.4, analysis of a cohort of animals revealed that KR54 becomes concentrated by over 100-fold (to 1.2 ± 0.3 mM) in the intestine after feeding for 30 min on media containing 10 μM of this fluorophore. Other KR fluorophores also accumulated to high levels in the intestine, but KR35 was chosen for the majority of the imaging studies described here because of its particularly favorable low background fluorescence and high signal-to-noise during observation of the PAP transition in vivo.
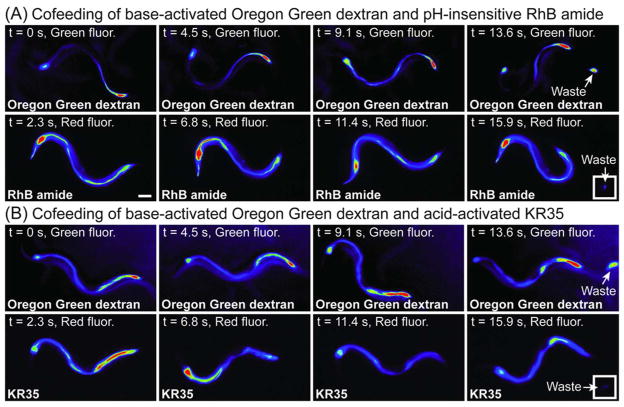
To probe the mechanism of the PAP fluorescence transition, the base-activated fluorescent probe Oregon Green dextran and the pH-insensitive RhB amide or acid activated KR35 were coadministered to freely feeding animals. As shown in Figure 6, the orthogonal green and red fluorescence of these fluorophores was acquired every 2.3 s during the DMP by automated filter switching. Examination of frames extracted from video microscopy revealed that both Oregon Green dextran and RhB amide exhibit a fixed distribution of fluorescence in the intestine during the DMP. Some changes in the intensity of Oregon Green dextran were observed, consistent with previous reports of fluctuating pH during this process, but no major changes in the distribution of these fluorophores in the intestine were detected (Figure 6, panel A). In contrast, co-feeding of KR35 with Oregon Green dextran showed that the acid-activated fluorophore uniquely revealed the PAP transition (Figure 6, panel B). These experiments also established that the hot spot of acidity in the posterior is flanked by a region of higher pH at the posterior-most intestine that is intensely labeled by Oregon Green dextran (Figure 6). Because the pH-insensitive RhB amide could be used for imaging of fluid in the intestine but did not detect the PAP transition, we conclude that the wave of protons transitioning from the posterior to the anterior intestine does not correspond to mechanical movement of a bolus of acidic fluid resulting from contraction of the posterior body wall muscle (pBoc). Rather, this transition appears to be the consequence of the sequential activation of proton pumps or transporters along the length of the intestine.
Figure 6.
Fluorescence micrographs of unrestrained C. elegans during the DMP after co-feeding on a mixture of the green fluorescent probe Oregon Green dextran (25 μM) and either the red fluorescent probes RhB amide (10 μM, panel A) or KR35 (10 μM, panel B) for 2 h. Time-dependent images during the DMP extracted from video microscopy are shown. Fluorescence is rendered as a spectrum heat-map, with red representing the most intense fluorescence and black the least intense fluorescence. The head of the animal is on the left side of each image. Independent imaging of these probes confirmed spectral orthogonality with the filter sets employed. A major shift of fluorescence from the posterior intestine to the anterior-most intestine during the DMP was only observed with the acid activated KR35 fluorophore (panel B, t = 6.8 s). Scale bar = 100 microns.
We examined the importance of PBO-4 (NHX-7), a specific ion transporter of the Na+/H+ exchanger (NHE) family,24 in the PAP transition. NHE proteins are key regulators of cellular and organelle pH, and PBO-4 is known to control the efflux of protons from the intestine to the pseudocoelom in C. elegans.9 During the DMP, protons transported by PBO-4 stimulate the contraction of posterior body muscle cells, resulting in shortening of the intestine by ~5% during this process. Mutants lacking PBO-4 are unable to contract the posterior intestine during the DMP due to decreased efflux of protons across the basolateral membrane, preventing stimulation of muscle contraction.9 Feeding of KR35 to pbo-4 (ok583) deletion mutants (strain RB793), revealed that animals lacking functional PBO-4, similar to wild type, are capable of rhythmic posterior basification as visualized by posterior KR35 fluorescence quenching. However, functional PBO-4 appears to be required for concomitant anterior acidification, resulting in a substantial reduction of the anterior to posterior fluorescence ratio during the DMP (Figure 7, compare panels A and B). This observation, as well as the pattern of fluorescence changes observed in 3-dimensional plots (Figure 5) further suggests that the movement of protons during the DMP results from the sequential action of regional proton transporters along the length of the intestine. Although the luminal pH dynamics reported here have not been previously observed, insects such as mosquito larvae have been shown to possess an alkaline pH gradient in the anterior midgut that is reacidified in the posterior midgut, a process controlled by proton pumps and anion exchange across apical membranes of epithelial cells.25, 26
Figure 7.
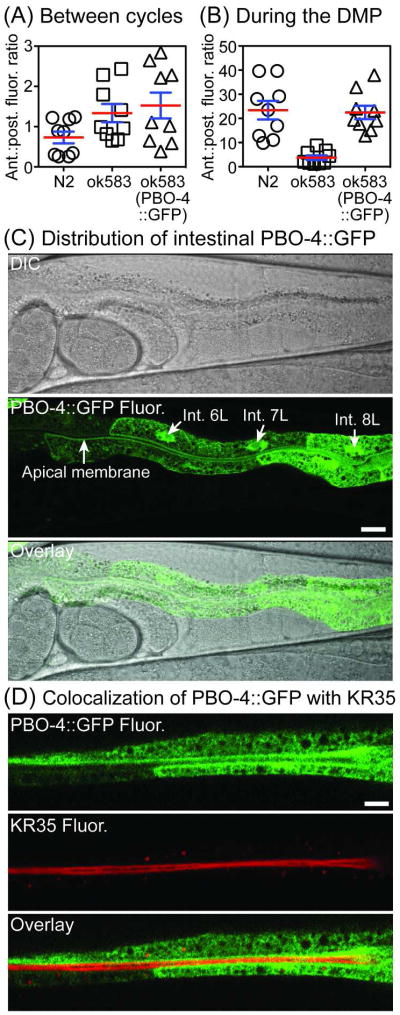
Panels A–B: Fluorescence ratios in unrestrained wild type (N2) and mutant C. elegans (N ≥ 6) after feeding on KR35 (30 min, 10 μM). The data shown in panel A was collected between DMP cycles whereas the data shown in panel B was obtained during the DMP. Anterior to posterior ratios were calculated from fluorescence values quantified with 10 micron circular ROIs placed in the intestine at 5% (anterior) and 75% (posterior) as measured from the grinder to the anus (mean ± SEM shown). Panels C–D: Confocal micrographs of mechanically immobilized C. elegans expressing PBO-4::GFP (lhEx290) in the intestine and colocalization with KR35 after feeding on 10 μM for 30 min (panel D). The images show PBO-4::GFP expressed almost exclusively in the four posterior pairs of intestinal cells (cell pairs 6–9). Nuclei of cells 6–8 are marked with arrows (Int. 6L, 7L, 8L). PBO-4 is more abundant on the apical membrane of the more anterior cells. The head of the animal is on the left side in each image. Scale bars = 10 microns.
To confirm the role of PBO-4 in anterior intestinal acidification, we generated a GFP-tagged PBO-4 transgene (lhEx290), which rescued the anterior acidification and posterior body wall contraction of ok583 deletion mutants during the DMP (Figure 7, compare panels A and B). Functional PBO-4::GFP was driven by a genomic fragment containing the endogenous pbo-4 promoter, and imaging of the fluorescent fusion protein revealed that PBO-4::GFP is primarily expressed in the posterior half of the intestine throughout development. This fusion protein was highly enriched at the basolateral face of the posterior-most intestinal cells (cell pairs 8 and 9), as previously reported.9 However, in contrast to previous studies of PBO-4 expressed via the vitellogenin promoter,9 PBO-4::GFP driven by the endogenous pbo-4 promoter was expressed at the 2-fold stage of embryogenesis (images provided in the supporting information), and was also localized to the apical membrane of more anterior cells of the intestine (cell pairs 6 and 7, Figure 7, panel C). This apical localization was confirmed by colocalization with KR35 by confocal microscopy (Figure 7, panel D). This suggests that in addition to proton transport across the basolateral surface, PBO-4 appears to regulate exchange of protons at the apical surface of the intestine, in a cell context-dependent manner.
We demonstrated that acid-activated fluorophores termed Kansas Reds provide unique tools for the investigation of pH dynamics in acidic biological environments. Feeding of these compounds to C. elegans revealed that they accumulate by ~100-fold in the intestine and are well retained, potentially due to interactions with anionic molecules present on the luminal surface. Because the Kansas Reds accumulate to high levels and are not rapidly eliminated from the intestinal lumen, high-resolution imaging of freely feeding animals was possible. As a result, these studies identified a dynamic hot spot of acidity in the posterior intestine. During the DMP, this acidity rapidly transitions to the anterior intestine. This anterior acidity dissipates with some return to the posterior immediately prior to elimination of waste, followed by slow complete reacidification of the posterior intestine. This maximal acidification of the anterior intestine during the transition required the proton exchanger PBO-4, which was found to be expressed on both the apical and basolateral membranes of posterior intestinal cells when driven by its endogenous promoter. Co-feeding studies of base-activated Oregon Green dextran with pH-insensitive and acid-activated fluorophores suggest that the PAP transition does not involve the movement of a bolus of acidic fluid but rather involves the sequential triggering of apical proton transporters along the intestine. The production of a dynamic hot spot represents a novel mechanism by which the unsegmented alimentary canal of C. elegans transiently compartmentalizes acidity at different intestinal sites in vivo. Given that low pH in the stomach of mammals is known to facilitate the digestion of proteins and the absorption of some vitamins and minerals, this dynamic process may play important roles in nutrient uptake, protection against pathogens, and/or conservation of protons during the DMP.
METHODS
Culture and maintenance of C. elegans
C. elegans animals were obtained from the Caenorhabditis Genetics Center (CGC). Animals were cultured and maintained at 20–22.5 °C as previously described.27 The following alleles/strains were used in this analysis: N2 (var. Bristol), KWN246 (PEPT-1GFP aka OPT-2GFP), pbo-4(ok583), lhEx290. lhEx290 was generated by injecting N2 animals with pEVL363 (1 ng/μL) with Pstr-1::gfp as a co-injection marker (15 ng/μL). PBO-4::GFP was strongly expressed in the posterior cells of the intestine of a 2-fold embryo as shown in the supporting information (Figure S2).
Molecular biology
The PBO-4 promoter and coding regions were amplified by PCR from N2 genomic DNA using Phusion high-fidelity polymerase (Finnzymes). The product was cloned into the pCR8/GW/TOPO entry plasmid (Life Technologies). The final Ppbo-4::PBO-4::GFP plasmid (pEVL363) was made by recombination into a GFP expression destination vector using LR Clonase II (Life Technologies) according to the instructions of the manufacturer. Sequences and vector information are available upon request.
Confocal microscopy
Animals were immobilized on agarose pads (10%) containing polystyrene beads (2.5% w/v, 50 nm, Bangs Laboratory). Images were collected on an Olympus FV1000 confocal microscope equipped with Fluoview software. Images were acquired using multi-track parameters, with Plan-apochromat objectives (20X or 60X).
Fluorophore feeding assay
Immediately prior to use, lyophilized solid fluorophores were solubilized in DMSO to provide concentrations > 20 mM and the concentrations of these solutions were determined using Beer’s law (A = εlc). Additional DMSO was added to generate standard stock solutions (10.0 mM). Multiwell plates were filled with a solution of warm (60 °C) agarose (1%) prepared with Hank’s Balanced Salt Solution (HBSS, Gibco) containing fluorophore (10 μM) and DMSO (0.1%). The agarose surface was spotted with a solution of OP50 bacteria that contained the fluorophore (10 μM, 0.1% DMSO) and was allowed to dry. Animals were transferred to the fluorophore-containing media and allowed to feed for at least 30 min (~30 defecation cycles). After ingestion of the fluorophores, animals were transferred to standard NGM plates for video microscopy.
Imaging of freely feeding animals and data analysis
Microscopy of freely feeding animals employed a Leica M205FA fluorescence dissecting microscope fitted with a Leica DFC310FX camera, IsoPro motorized stage, and either GFP3 (Ex. 470/40; Em. 525/50), Rhodamine B (Ex. 530/30; Em. 550 LP), or TXRn (Ex. 560/40; Em. 620/40) fluorescence filter sets (Rhodamine B for KR35, KR41, KR52, KR54 and TXRn for KR23 in Figure 5; GFP3 was used for Oregon Green dextran and TXRn was used for RhB amide and KR35 in Figure 6). Leica LAS AF software was used for quantification of fluorescence and measurement of anatomical dimensions.
During the DMP, the posterior body wall muscle contraction (pBoc) shortens the intestine of adult N2 C. elegans by 5 ± 1% (as measured from the grinder to the anus, n = 3 animals). To standardize the length of the intestine as a function of time and animal to generate the three-dimensional plots shown in Figure 5, the distance along the intestine in each frame obtained from video microscopy (camera exposure = 150 ms; gain = 1; frame interval = 300 ms; lamp power (120 W) = 75%) was normalized to 100%. In these experiments, each video frame was analyzed with a linear ROI that precisely traced the intestine from the grinder to the anus of each animal. Fluorescence values (rfu) measured as a function of distance down the intestine (in meters) with a polyline ROI were exported from Leica ASF software as a series of numbered .csv files, with each file representing a one-dimensional array. To process this data, a web interface program was developed in java to read collections of .csv files exported from Leica LAS AF software, perform calculations, and export normalized data matrices in Excel format. The input files represent a zipped collection of .csv files (numbered as a function of time) that define two-dimensional arrays with the parameters “Axis [m]” (corresponding to distance) and “ROI1 []” (corresponding to fluorescence in rfu). Columns were used to represent the time dimension and rows were used to represent fluorescence as a function of length down the intestine. Prior to uploading the files, the java program allows the user to specify the number of segments that define the intestine. For the data shown in Figure 5, 100 segments were used, corresponding to averaging of the fluorescence of each 1% segment of the intestine. After uploading the collection of .csv files containing variable distance data, the java program shrinks the data into a matrix defined by the formula: the value for one segment = sum (the fluorescence in this segment) / the number of summation. In this way, arrays containing various length values were normalized to 100% to generate a matrix of average fluorescence values at fixed intestinal segments as a function of time.
Fluorescence was converted to concentration using standard curves from in vitro measurements (Figure 5, panel F, left). These standard curves were constructed by imaging of calibrated glass micropipets (100 μL, VWR 53432-921) that were flame pulled to internal diameters of 15 microns and filled with KR54 at variable concentrations in aqueous solution (pH 2.5) comprising bovine serum albumin (BSA, 1%), as a proteinaceous buffer,28 and Triton X-100 (1%). The fluorescence of regions of these glass microneedles at internal diameters of 15 microns were used to analyze fluorescence at the same dimension of the posterior intestine between DMP cycles. This approach was used to determine the intestinal concentration of fluorophores (Figure 5, panel F, right). Linear ROIs (5 microns in length) oriented parallel to the needle or intestine was used to measure maximal fluorescence values in all cases. Microscopy was used to measure the maximum diameter of the majority of the intestine (≥ 93%) of young adult C. elegans (N2 strain) as 15 ± 3 microns (n = 8 animals), whereas the maximum diameter near the anterior-most intestine was measured as 33 ± 3 microns (n = 8 animals). The relationship between the internal diameter of glass needles filled with KR54 and fluorescence values was determined and is shown in the Supporting Information (Figure S3). The data used to generate in vitro standard curves used microscope settings that were identical to those used with animals.
Supplementary Material
Acknowledgments
We thank the NIH (RC1-GM91086, R01-CA83831, and P20-GM103638) for financial support. Z.R.W. thanks the NIH for an IRACDA postdoctoral fellowship. We thank G. Lushington for helpful discussions and J. Sand and J. Heppert for technical assistance. Some nematode strains used in this work were provided by the Caenorhabditis Genetics Center, which is funded by the NIH National Center for Research Resources (NCRR).
Footnotes
The authors declare no competing financial interest.
General experimental information, synthetic procedures and compound characterization data, data used to determine quantum yields relative to known rhodamines29–31 and molar extinction coefficients (Figure S1), micrographs showing expression of PBO-4::GFP in the 2-fold embryo (Figure S2), fluorescence of KR54 as a function of path length of needles (Figure S3), and NMR spectra (Figures S4–S27). This paper contains enhanced objects: supporting video showing the PAP transition in C. elegans after feeding on KR35. This material is available free of charge via the internet at http://pubs.acs.org.
References
- 1.Smith JL. The role of gastric acid in preventing foodborne disease and how bacteria overcome acid conditions. J Food Prot. 2003;66:1292–1303. doi: 10.4315/0362-028x-66.7.1292. [DOI] [PubMed] [Google Scholar]
- 2.Giannella RA, Broitman SA, Zamcheck N. Gastric acid barrier to ingested microorganisms in man: studies in vivo and in vitro. Gut. 1972;13:251–256. doi: 10.1136/gut.13.4.251. [DOI] [PMC free article] [PubMed] [Google Scholar]
- 3.Martinsen TC, Bergh K, Waldum HL. Gastric juice: a barrier against infectious diseases. Basic Clin Pharmacol Toxicol. 2005;96:94–102. doi: 10.1111/j.1742-7843.2005.pto960202.x. [DOI] [PubMed] [Google Scholar]
- 4.Allman E, Johnson D, Nehrke K. Loss of the apical V-ATPase a-subunit VHA-6 prevents acidification of the intestinal lumen during a rhythmic behavior in C. elegans. Am J Physiol Cell Physiol. 2009;297:C1071–C1081. doi: 10.1152/ajpcell.00284.2009. [DOI] [PMC free article] [PubMed] [Google Scholar]
- 5.Thomas JH. Genetic analysis of defecation in Caenorhabditis elegans. Genetics. 1990;124:855–872. doi: 10.1093/genetics/124.4.855. [DOI] [PMC free article] [PubMed] [Google Scholar]
- 6.Dal Santo P, Logan MA, Chisholm AD, Jorgensen EM. The inositol trisphosphate receptor regulates a 50-second behavioral rhythm in C. elegans. Cell. 1999;98:757–767. doi: 10.1016/s0092-8674(00)81510-x. [DOI] [PubMed] [Google Scholar]
- 7.Teramoto T, Iwasaki K. Intestinal calcium waves coordinate a behavioral motor program in C. elegans. Cell Calcium. 2006;40:319–327. doi: 10.1016/j.ceca.2006.04.009. [DOI] [PubMed] [Google Scholar]
- 8.Nehrke K, Denton J, Mowrey W. Intestinal Ca2+ wave dynamics in freely moving C. elegans coordinate execution of a rhythmic motor program. Am J Physiol Cell Physiol. 2008;294:333–344. doi: 10.1152/ajpcell.00303.2007. [DOI] [PubMed] [Google Scholar]
- 9.Beg AA, Ernstrom GG, Nix P, Davis MW, Jorgensen EM. Protons act as a transmitter for muscle contraction in C. elegans. Cell. 2008;132:149–60. doi: 10.1016/j.cell.2007.10.058. [DOI] [PMC free article] [PubMed] [Google Scholar]
- 10.Pfeiffer J, Johnson D, Nehrke K. Oscillatory transepithelial H(+) flux regulates a rhythmic behavior in C. elegans. Curr Biol. 2008;18:297–302. doi: 10.1016/j.cub.2008.01.054. [DOI] [PMC free article] [PubMed] [Google Scholar]
- 11.Vergne I, Constant P, Laneelle G. Phagosomal pH determination by dual fluorescence flow cytometry. Anal Biochem. 1998;255:127–132. doi: 10.1006/abio.1997.2466. [DOI] [PubMed] [Google Scholar]
- 12.Sun WC, Gee KR, Klaubert DH, Haugland RP. Synthesis of fluorinated fluoresceins. J Org Chem. 1997;62:6469–6475. [Google Scholar]
- 13.Lavis LD, Rutkoski TJ, Raines RT. Tuning the pK(a) of fluorescein to optimize binding assays. Anal Chem. 2007;79:6775–6782. doi: 10.1021/ac070907g. [DOI] [PMC free article] [PubMed] [Google Scholar]
- 14.Han J, Burgess K. Fluorescent indicators for intracellular pH. Chem Rev. 2010;110:2709–2728. doi: 10.1021/cr900249z. [DOI] [PubMed] [Google Scholar]
- 15.Llopis J, McCaffery JM, Miyawaki A, Farquhar MG, Tsien RY. Measurement of cytosolic, mitochondrial, and Golgi pH in single living cells with green fluorescent proteins. Proc Natl Acad Sci USA. 1998;95:6803–6808. doi: 10.1073/pnas.95.12.6803. [DOI] [PMC free article] [PubMed] [Google Scholar]
- 16.Tantama M, Hung YP, Yellen G. Imaging Intracellular pH in Live Cells with a Genetically Encoded Red Fluorescent Protein Sensor. J Am Chem Soc. 2011;133:10034–10037. doi: 10.1021/ja202902d. [DOI] [PMC free article] [PubMed] [Google Scholar]
- 17.Verkman AS, Kneen M, Farinas J, Li YX. Green fluorescent protein as a noninvasive intracellular pH indicator. Biophys J. 1998;74:1591–1599. doi: 10.1016/S0006-3495(98)77870-1. [DOI] [PMC free article] [PubMed] [Google Scholar]
- 18.Best QA, Xu R, McCarroll ME, Wang L, Dyer DJ. Design and investigation of a series of rhodamine-based fluorescent probes for optical measurements of pH. Org Lett. 2010;12:3219–3221. doi: 10.1021/ol1011967. [DOI] [PMC free article] [PubMed] [Google Scholar]
- 19.Urano Y, Asanuma D, Hama Y, Koyama Y, Barrett T, Kamiya M, Nagano T, Watanabe T, Hasegawa A, Choyke PL, Kobayashi H. Selective molecular imaging of viable cancer cells with pH-activatable fluorescence probes. Nature Med. 2009;15:104–109. doi: 10.1038/nm.1854. [DOI] [PMC free article] [PubMed] [Google Scholar]
- 20.Nguyen T, Francis MB. Practical synthetic route to functionalized rhodamine dyes. Org Lett. 2003;5:3245–3248. doi: 10.1021/ol035135z. [DOI] [PubMed] [Google Scholar]
- 21.Torneiro M, Still WC. Simple synthetic receptors that bind peptides in water. Tetrahedron. 1997;53:8739–8750. [Google Scholar]
- 22.Nehrke K. A reduction in intestinal cell pHi due to loss of the Caenorhabditis elegans Na+/H+ exchanger NHX-2 increases life span. J Biol Chem. 2003;278:44657–44666. doi: 10.1074/jbc.M307351200. [DOI] [PubMed] [Google Scholar]
- 23.Hassan EE, Gallo JM. A simple rheological method for the in vitro assessment of mucin-polymer bioadhesive bond strength. Pharm Res. 1990;7:491–495. doi: 10.1023/a:1015812615635. [DOI] [PubMed] [Google Scholar]
- 24.Nehrke K, Melvin JE. The NHX family of Na+-H+ exchangers in Caenorhabditis elegans. J Biol Chem. 2002;277:29036–29044. doi: 10.1074/jbc.M203200200. [DOI] [PubMed] [Google Scholar]
- 25.Boudko DY, Moroz LL, Harvey WR, Linser PJ. Alkalinization by chloride/bicarbonate pathway in larval mosquito midgut. Proc Natl Acad Sci USA. 2001;98:15354–15359. doi: 10.1073/pnas.261253998. [DOI] [PMC free article] [PubMed] [Google Scholar]
- 26.Jagadeshwaran U, Onken H, Hardy M, Moffett SB, Moffett DF. Cellular mechanisms of acid secretion in the posterior midgut of the larval mosquito (Aedes aegypti) J Exp Biol. 2010;213:295–300. doi: 10.1242/jeb.037549. [DOI] [PMC free article] [PubMed] [Google Scholar]
- 27.Brenner S. The genetics of Caenorhabditis elegans. Genetics. 1974;77:71–94. doi: 10.1093/genetics/77.1.71. [DOI] [PMC free article] [PubMed] [Google Scholar]
- 28.Curvale RA. Buffer Capacity of Bovine Serum Albumin (BSA) J Argent Chem Soc. 2009;97:174–180. [Google Scholar]
- 29.Velapoldi RA, Tonnesen HH. Corrected Emission Spectra and Quantum Yields for a Series of Fluorescent Compounds in the Visible Spectral Region. J Fluorescence. 2004;14:465–472. doi: 10.1023/b:jofl.0000031828.96368.c1. [DOI] [PubMed] [Google Scholar]
- 30.Kubin RF, Fletcher AN. Fluorescence Quantum Yields of Some Rhodamine Dyes. J Luminescence. 1982;27:455–462. [Google Scholar]
- 31.Snare MJ, Treloar FE, Ghiggino KP, Thistlethwaite PJ. The Photophysics of Rhodamine-B. J Photochem. 1982;18:335–346. [Google Scholar]
Associated Data
This section collects any data citations, data availability statements, or supplementary materials included in this article.


