Abstract
Hypothesis
Performance in tone perception and production are correlated in prelingually-deafened pediatric cochlear implant (CI) users across individuals. Demographic variables, such as age at implantation, contribute to the performance variability.
Background
Poor representation of pitch information in CI devices hinders pitch perception and affects perception of lexical tones in cochlear implant users who speak tonal languages.
Methods
One hundred and ten Mandarin-speaking, prelingually-deafened CI subjects and 125 typically-developing, normal-hearing subjects were recruited from Beijing, China. Lexical tone perception was measured using a computerized tone contrast test. Tone production was judged by native Mandarin-speaking adult listeners and analyzed acoustically and with an artificial neural network. A general linear model analysis was performed to determine factors that accounted for performance variability.
Results
CI subjects scored ~67% correct on the lexical tone perception task. The degree of differentiation of tones produced by the CI group was significantly lower than the control group as revealed by acoustic analysis. Tone production performance assessed by the neural network was highly correlated with that evaluated by human listeners. There was a moderate correlation between the overall tone perception and production performance across CI subjects. Duration of implant use and age at implantation jointly explained ~29% of the variance in the tone perception performance. Age at implantation was the only significant predictor for tone production performance in the CI subjects.
Conclusion
Tone production performance in pediatric CI users is dependent on accurate perception. Early implantation predicts better outcome in lexical tone perception and production.
I. Introduction
Cochlear implants (CIs) have successfully provided profoundly-deaf patients with good speech perception under quiet listening conditions. Recent research efforts have been devoted to addressing the remaining issues with modern CI technology as well as the perceptual limit in the users. One of those issues is perception of pitch. The envelope-based speech processing strategies that are commonly used in modern CI systems deliver low-frequency temporal-envelope information of a number of frequency bands carried by electrical pulse trains. The number of available electrodes is between 12 and 22 depending on device type. The limited number of channels used to transmit the wide range of speech frequency restricts the spectral resolution of the device. Furthermore, the number of effective spectral channels is often far less than the number of electrodes or analysis bands assigned to the electrode array (1), likely due to channel interactions induced by current spread or poor electrode-neuron interface. Pitch perception is known to be challenging because of the inherent low spectral resolution and the limited ability of the users to extract temporal pitch from temporal modulations (2–4). Novel speech processing strategies have been developed to enhance F0 coding for the purpose of improving pitch perception but these strategies have only shown small and inconsistent benefits in the clinic (5–7).
The inadequate input of pitch information affects lexical tone development in prelingually-deafened pediatric cochlear implantees who speak tonal languages (8–11). Tonal languages, such as Mandarin Chinese, use pitch variation to convey lexical meaning. In Mandarin Chinese, the fundamental frequency (F0) contour of a syllable varies in one of four ways: (1) flat, (2) rising, (3) falling and rising, and (4) falling. These F0 contours are the primary acoustic correlate for lexical tone perception. In the case of CIs, with no salient F0 information, listeners may have to rely on secondary cues for tone perception including temporal pitch cues, duration cues, or the overall amplitude contour cues that also correlate with F0 variation (11–14). Results from small samples of pediatric implant users have shown, as a group, poor performance, though considerable variability in both lexical tone perception and production (15, 16). Peng et al. reported an average tone recognition score of 73% correct for a group of 30 pediatric implantees but the performance varied from chance (50% correct) to nearly perfect (16). A number of other studies demonstrated similar highly-variable tone recognition performance in Cantonese-speaking pediatric cochlear implantees (17–19). The lack of adequate auditory input as well as feedback may prevent these users from learning tone production. A similar characteristic of tone production performance was the high inter-subject variability, with scores ranging from chance to nearly perfect (8–10, 16, 20–21).
Although poor performance has been found in studies of both tone perception and production as described above, it is not yet clear if perception and production predict one another. Nor have prior studies shown consistent results in identifying the predictor variables that contribute to the variability in performance in individual users. Previous studies have reported that tone perception was dependent on duration of CI use and age at implantation (18), or related to only age at implantation (5), or none of the tested variables (16, 22). Inconsistent predictors have been reported in tone production studies (9, 16, 21, 23). The limited sample size used in these studies may explain the discrepancies.
The aim of the present study was to examine the relationship between tone perception and production in Mandarin-speaking pediatric implant users and to identify predictor variables for performance using a larger sample size. The large sample allows us to better understand the variables that were significant predictors in some samples but not others. Secondly, it also allows for analysis of a larger number of predictive variables including those that have not been studied in the past (such as family variables, cochlear implant variables, and educational variables, see Materials and Methods for details). Thirdly, a larger sample size provides greater statistical power to examine the relationship between tone perception and tone production, particularly the error patterns, which have yet to be systematically studied (21).
II. Materials and Methods
A. Subjects
One hundred and ten prelingually-deafened pediatric CI users were recruited from three cochlear implant rehabilitation centers in Beijing, China. All 110 subjects completed the tone perception test. Due to scheduling issues, 76 of them were available for tone production test. In addition, due to computer technical issues, tone perception data from 3 subjects were lost. Therefore, tone perception test data were available from107 subjects. Tone production data were available from 76 subjects whereas both tone perception and production data were available from 73 subjects. Complete demographic information was available for 68 subjects. The chronological ages of the CI subjects ranged from 2.42 to 16.18 years old (see Table 1). Age at implantation ranged from 1.11 to 12.95 years old (Mean ± SD: 3.96 ± 2.70 years). The duration of CI use ranged from 0.09 to 4.90 years (Mean ± SD: 1.27 ± 1.03 years). The CI devices included those manufactured by Cochlear, Advanced Bionics, and MedEl corporations. The speech-processing strategies also included a variety of strategies that included SPEAK, ACE, HiRes, Hires 120, and CIS.
Table 1.
Distribution of chronological ages for the CI and NH groups.
| Age (yrs)
|
total | ||||||||
|---|---|---|---|---|---|---|---|---|---|
| 2–3 | 3–4 | 4–5 | 5–6 | 6–7 | 7–8 | >8 | |||
| CI | N | 12 | 25 | 6 | 5 | 5 | 7 | 8 | 68 |
| % | 17.6 | 36.7 | 8.8 | 7.4 | 7.4 | 10.3 | 11.8 | 100 | |
| NH | N | 0 | 10 | 20 | 19 | 19 | 21 | 36 | 125 |
| % | 0 | 8.0 | 16.0 | 15.2 | 15.2 | 16.8 | 28.8 | 100 | |
One hundred and twenty-five typically-developing normal-hearing (NH) subjects were recruited as controls from kindergartens and elementary schools in Beijing. The chronological ages of the NH subjects ranged from 3.24 to 9.97 years old (see Table 1). Note that the mean chronological age of the NH group was ~1.5 years older than that of the CI group. All NH subjects provided tone production samples and 112 of them completed the tone perception test. The use of human subjects were reviewed and approved by the Institutional Review Boards of Ohio University and Beijing Tongren Hospital.
B. Tone perception test
There are six possible tone contrasts (i.e., 1–2, 1–3, 1–4, 2–3, 2–4, and 3–4) between the four tones of Mandarin Chinese. The tone perception test materials consisted of 36 words in 18 pairs, 3 pairs for each tone contrast. The tone perception test involved identifying a picture that corresponded to the target tone stimulus from a tone contrast, following the procedure used in (5). The test consisted of 48 trials [12 words (i.e., 2 words in 1 pair × 6 tone contrasts) × 2 speakers (1 male and 1 female) × 2 repetitions]. In the test, a tone stimulus was presented at the most comfortable level via a loudspeaker positioned in front of the subject. For each trial, two pictures of the tone contrast were shown on the computer screen. The subject was instructed to point to the picture that corresponded to the meaning of the word that he or she heard. The order of presentation was fully randomized. Training was provided prior to test, which consisted of 12 presentations with feedback.
C. Tone production test
1. Speech recording
The tone production test used a picture-naming procedure in which the 36 words (i.e., 6 tone contrasts × 3 pairs) created for the tone perception test were the target words for production (see (5) for a complete list of the words). To elicit tone production, a picture was presented on the computer screen, and the subject was instructed to say the word that the picture represented. The elicited speech of each subject was recorded at a sampling rate of 44100 Hz with a 16-bit resolution in a quiet room.
2. F0 extraction and acoustic analysis
The F0 contours of the vowels in the recorded words were extracted using an auto-correlation method with an update rate of 8 ms and a frame size of 24 ms. The acoustic analysis used a set of objective measures developed in our earlier study (10) for evaluating tone production in Mandarin-speaking pediatric CI users. The acoustic analysis was based on the distributions of the two F0 end points (i.e., onset and offset) on a tone contour (see (10) for methods). The onset and offset values of F0 contour captured the level and the gross shape of a tone contour. The distributions of onset and offset values for four tone categories were summarized by four tonal ellipses plotted in a tonal space. Differentiability of the four tones spoken by a speaker was quantified with three indices that measured the size relative to the degree of overlap of the four tonal ellipses, as described in (10).
3. Neural network analysis
The artificial neural network used to classify the tones produced by the subjects was a feed forward multilayer perceptron (24, 25). The neural network was structured to have three layers (i.e., input, hidden, and output layers). Inputs to the neural network were averaged F0s of the 12 segments from the F0 contour. The neural network was trained with tone tokens from the NH group. Testing for each CI subject was repeated 10 times and an averaged percent-correct score was derived to ensure accurate estimation of the performance. The neural network analysis was repeated for the data from the NH subjects as control.
4. Perceptual analysis
Tone production from both groups was perceptually judged by four native speakers of Mandarin-Chinese. All tone tokens were low-passed at 600 Hz with a 4th-order Butterworth filter (24 dB/octave) to remove the segmental information as in Wong et al. (26), such that the listeners were dependent solely on the F0 (and sometimes its first harmonic) information for tone identification. The processed tone tokens were presented in blocks of speakers, one speaker at a time chosen at random, at a most comfortable level via a circumaural headphone (Sennheiser, HD 265). A four-alternative forced-choice paradigm was used in which the listeners were instructed to determine which tone they heard from four possible choices (9). The perceptual judgment experiment was conducted in a double-walled sound-treated booth.
D. Candidate predictor variables
A number of candidate predictor variables for tone perception and production outcome were collected by administering a questionnaire to the CI participants. The variables included demographic variables (age, age at implantation, duration of cochlear implant use), family variables (family size and household income), cochlear implant variables (implant type, processor type, and speech processing strategy), and educational variables (communication mode and duration of speech therapy). Due to missing information on some of the returned questionnaires, regression analysis included only those who were tested on the outcome variables and also provided complete demographic, family, and device information.
III. Results
A. Tone perception
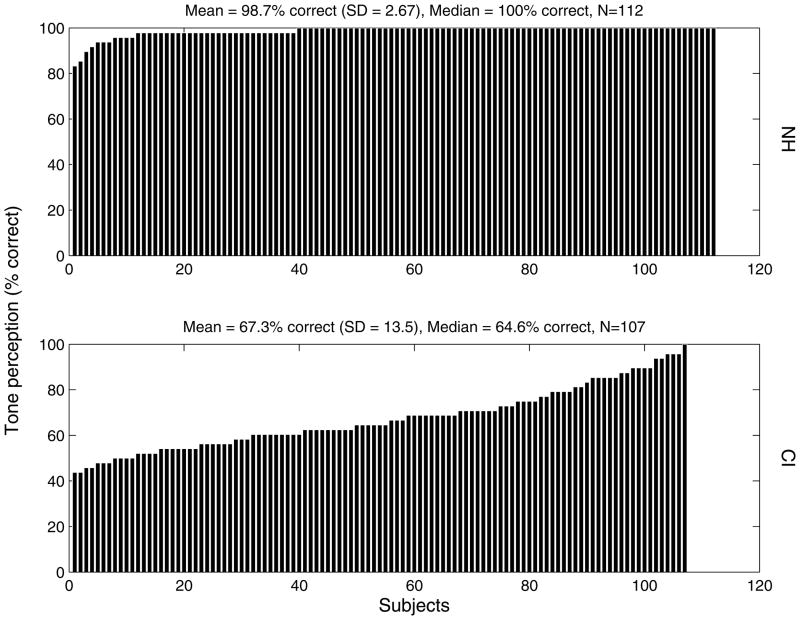
Tone perception scores of the NH (N = 112) and CI groups (N = 107) were rank ordered as shown in Fig. 1. Performance of the CI group ranged from chance to perfect (mean ± SD: 67.31 ± 13.51 % correct), and was significantly poorer than that of the NH group (98.7 ± 2.67 % correct) [t = −24.12, p < 0.001].
Fig. 1.
Rank-ordered tone perception scores (% correct) by the 112 normal-hearing (NH) and 107 subjects with cochlear implants (CIs).
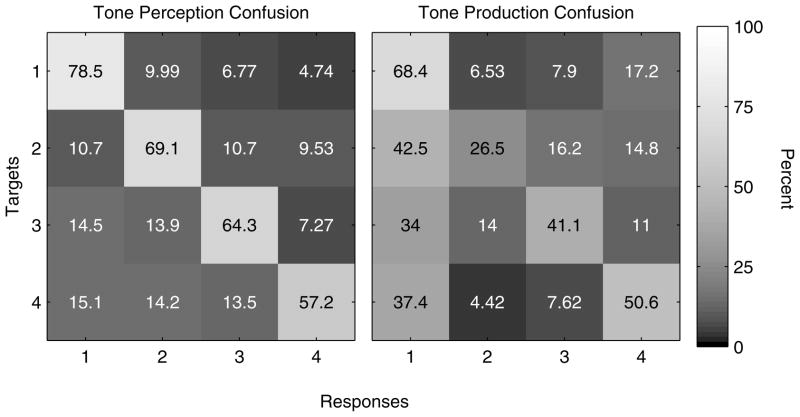
For the CI group, percent-correct scores for the 6 tone contrasts (i.e., tones 1–2, 1–3, 1–4, 2–3, 2–4, and 3–4) were 69.9%, 68.2%, 69.5%, 63.2%, 63.6%, and 67.7%, respectively. No statistical differences were found between the performance of the six contrasts [F (5,530) = 1.89, p = 0.09]. A confusion matrix summarized the overall error patterns from the pooled data across the 107 CI subjects (Fig. 2, left).
Fig. 2.
Confusion matrices. Error patterns of the 76 subjects with CIs in their tone perception (left panel) and tone production (right panel). The error patterns in tone production were based on the recognition results from the four native-Mandarin-speaking adult listeners.
B. Tone production
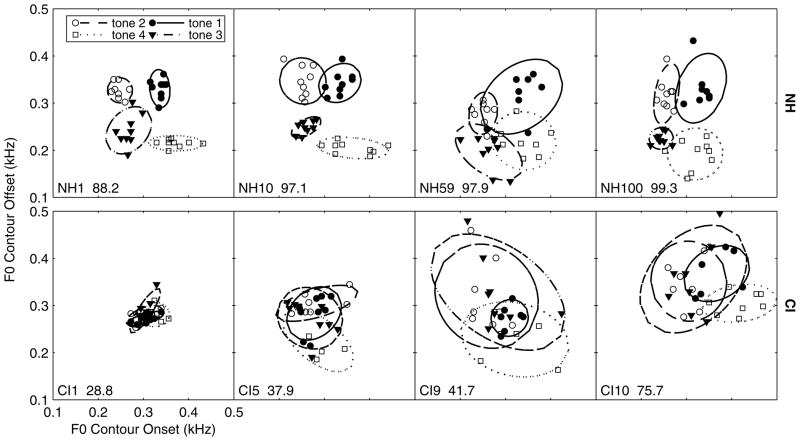
The acoustic analysis of tone production used tonal ellipses to quantify the degree of differentiation between tone categories spoken by a speaker. Examples of tonal ellipses for four NH and four CI subjects are shown in Fig. 3. The four subjects from each group were pseudo-randomly selected from the four quartiles (i.e., 0–25th, 25th–50th, 50th–75th, and 75th–100th percentiles) of their tone production accuracy scores as judged by the adult native Mandarin-speaking listeners. One apparent difference between the NH and CI groups was that ellipses from the NH subjects were well separated in the tonal space regardless of size. Even though subject CI1 had very small-sized ellipses, the ellipses were highly overlapped, giving rise to a low degree of differentiation. In fact, the small size and large overlap of the ellipses indicated that the tones produced by this subject did not have much variation in F0s. For subject CI9 and CI10, their diffused ellipses were compensated by less overlap indicating a moderate degree of differentiation, which was also reflected by the better scores from the perceptual judgment.
Fig. 3.
Tonal ellipses of four NH subjects and four subjects with CIs. The four subjects from each group were randomly selected from those with tone production scores (judged by the native-Mandarin-speaking adult listeners) in the ranges of 0 – 25th, 25th – 50th, 50th – 75th, and 75th – 100th percentiles of each respective group. The tone production score (% correct) for each subject is shown at the lower left corner of each panel. Each symbol represents the F0 onset and offset data of one tone token.
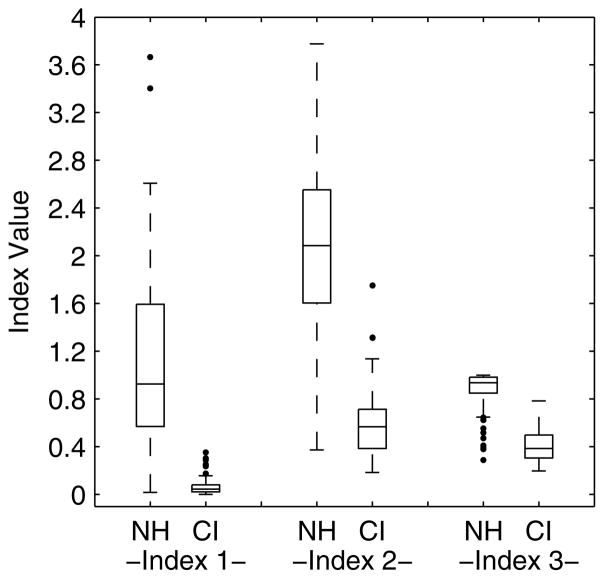
The degree of differentiation in tone production was quantified with three indices (10), with higher index values indicating better differentiation (Fig. 4). Indices 1 and 2 quantify separation of the F0 distributions of four tones relative to the variances in the speaker’s tonal space similar to the discriminability index d′. Index 3 calculates the false detection probabilities of each tone category reflecting the differentiation of one particular tone from the others (10). Significant differences were found between the CI group (N = 76) and the NH group (N = 125) on all three indices (all p < 0.001). For both groups, the values of the three indices were highly correlated with each other (all p < 0.05 after Bonferroni correction). The ellipse sizes produced by the NH group showed significant correlation with age [r = −0.264, p = 0.003], indicating that older subjects tended to produce more consistent F0s for a particular tone. Ellipse sizes however did not decrease with increased device experience in the CI group [r = −0.24, p = 0.09], or with the subjects’ chronological age [r = −0.22, p = 0.12].
Fig. 4.
Box plots of the three indices (10) of the acoustic analysis for the NH (N= 125) and CI (N=76) groups. Each box depicts the lower quartile, median, and upper quartile. The whiskers show the range of the rest of the data. The outliers are plotted with filled circles.
Percent correct scores for tone production judged by the four native Mandarin-speaking NH adult listeners showed high inter-rater reliability (all r > 0.95, p < 0.001). Based on the average recognition scores from the four judges, the group mean tone production accuracy for the 76 CI subjects was only 46.8% correct with a high variability (SD = 19.78 % correct). The group mean tone production accuracy for the 125 NH subjects was 94.8% correct (SD = 9.0% correct). The group differences were found to be highly significant (t = −23.49, p < 0.001).
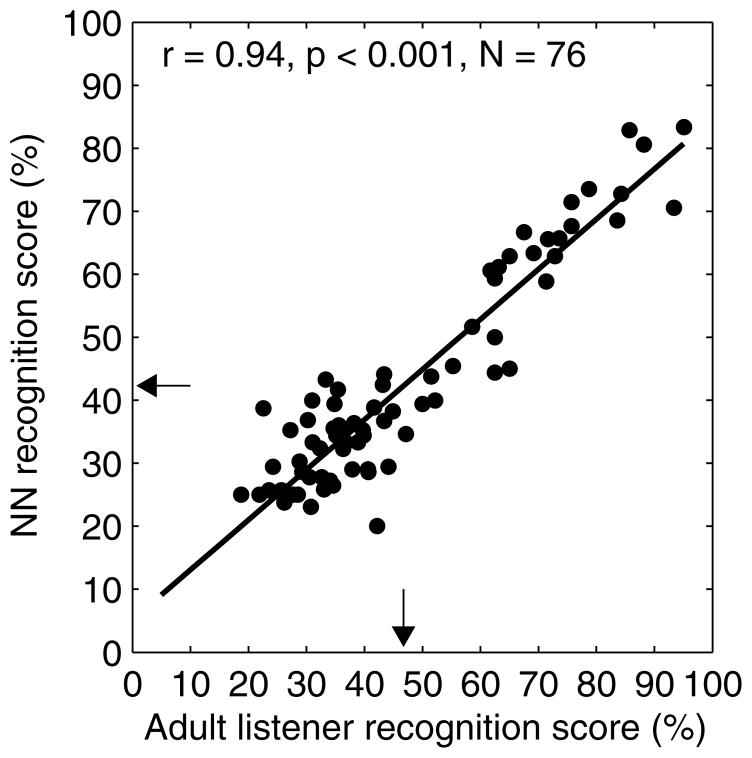
Classification results from the artificial neural network analysis agreed exceptionally well with the perceptual judgment results. Figure 5 shows a high correlation between the perceptual results from the native Mandarin-speaking adult listeners and the classification results from the artificial neural network analysis (r = 0.94, p < 0.001). It also shows the large variability of the tone production accuracy of the 76 CI subjects, with performance ranging from chance (i.e., 25% correct) to approximately 95% correct.
Fig. 5.
Correlation of the tone production scores (% correct) between the neural network analysis and perceptual judgment of the native-Mandarin-speaking adult listeners. The arrows indicate the mean values of the tone production scores.
C. Relationship between tone perception and production
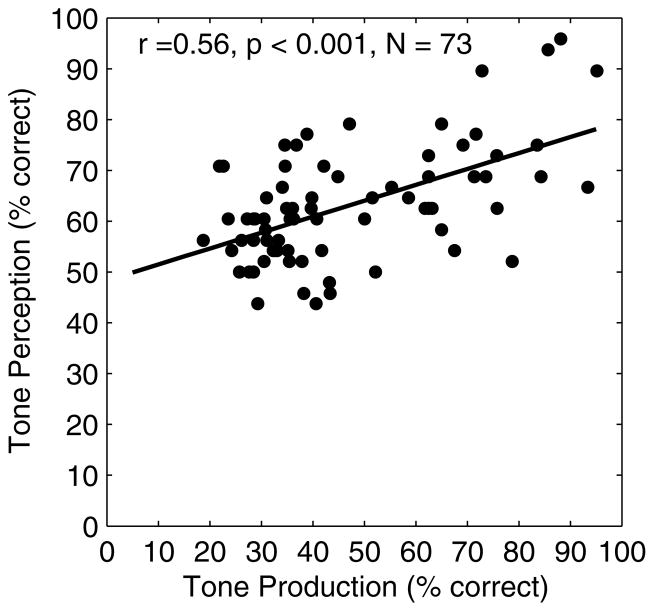
The overall accuracy of tone perception and production by the CI group was significantly correlated (r = 0.56, p < 0.001) (Fig. 6). The confusion matrices (Fig. 2) indicate an association between perception and production patterns for tones 1 and 4. On the other hand, perception of tones 2 and 3 did not seem to predict the performance of production. The relationship between perception and production for individual tones was examined and the correction coefficients between percent correct scores of tone perception and production across subjects were calculated for each of the four tones. The correlations were found to be statistically significant for tone 4 (p = 0.01), marginally significant for tone 1 (p = 0.06), and not significant for tones 2 and 3 (p > 0.05).
Fig. 6.
Correlation between tone perception and production performance in the CI subjects.
D. Predictor variables to tone perception and production performances
The dependent variables for the linear regression models were percent correct scores on the tone perception test and tone production accuracy evaluated by the native-Mandarin-speaking adult listeners. The predictor variables (i.e., demographic, family, cochlear implant, and educational variables) were entered step-wise into a linear regression model for analysis.
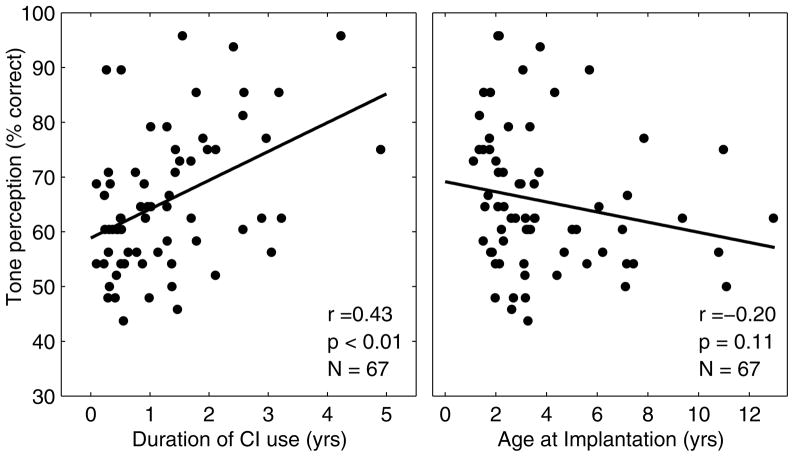
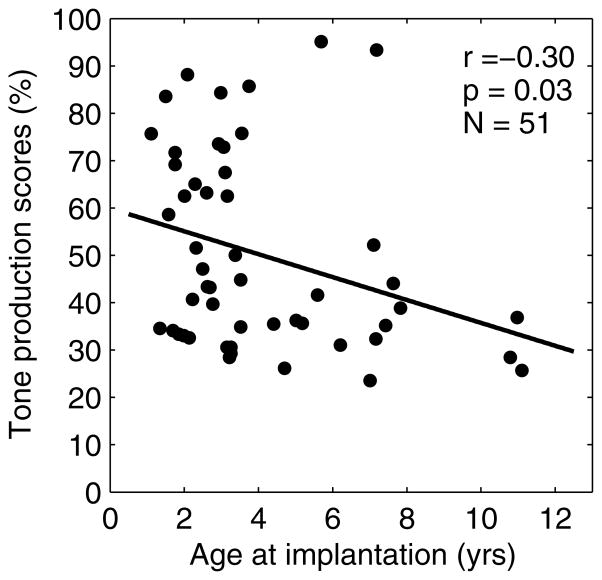
Duration of CI use and age at implantation were two significant predictor variables for tone perception. The marginal correlations between the two predictor variables and tone perception are shown in Fig. 7. Although age at implantation was not marginally correlated with the perception outcome, when entered with duration of CI use, it explained a significant amount of unique variance in tone perception (p = 0.003). Jointly, age at implantation and duration of CI use explained 28.6% of the total variance for tone perception outcome. Age at implantation was the only significant predictor for tone production performance (Fig. 8).
Fig. 7.
Correlations between tone perception performance and duration of CI use (left panel) and age at implantation (right panel) in the CI subjects.
Fig. 8.
Correlations between age at implantation and tone production in the CI subjects.
IV. Discussion
Pediatric CI subjects showed large variability in tone perception performance ranging from chance level to perfect scores, in contrast to the much less variable and better performance of the NH group (Fig. 1). Note that the mean chronological age of the NH group was older (mean = 6.74 years) than that of the CI group (mean = 5.23 years) with the distribution of the CI group being skewed toward younger ages. The difference in hearing age between the two groups was even larger (mean CI experience = 1.27 years). Therefore, we caution direct comparisons of performance between the two groups. Studies showed that typically developing NH children acquire tones at a fairly early age, well in advance of the acquisition of segmentals (27, 28). However, Mandarin-speaking children residing in the US showed delays in tone acquisition (26), perhaps due to altered language environments. The CI subjects with limited device experience could still be learning tone perception. The fact that the perception performance of the CI group was dependent on duration of CI use (Fig. 7) also shows evidence of learning. A future longitudinal study is warranted to illustrate the learning curves for lexical tones in prelingual deaf pediatric cochlear implantees.
Tone production from both the CI and NH subjects was analyzed acoustically, automatically recognized by a neural network, and evaluated by native Mandarin-speaking listeners. The acoustic analysis reveals the degree of consistency that a set of F0s is used to produce a given tone, for a particular speaker. Additionally, it reveals the degree of differentiation of these F0 distributions among the four tone categories. The relatively large tonal ellipse sizes (Fig. 3) seen in the CI group indicated that the F0s produced by the CI subjects were not consistent for a given tone category. The F0 distributions also overlapped considerably among tones. These results suggest that the CI subjects were able to produce a normal pitch range, but they were unable to use the correct and differentiable F0 contours consistently for the tone targets. The objective measure of tone production by the neural network and the subjective perceptual measure were found to be highly correlated (r = 0.94, Fig. 5). This result suggests that the neural network analysis can be used as an objective, fast, and automatic recognition tool for tone production assessment in hearing-impaired population either with CIs or with other rehabilitative devices in clinical practices (10, 24, 25).
The overall accuracy of perception averaged across tones predicts the overall accuracy in production, but the perception and production for individual tones, particularly tones 2 and 3, were not related. The link between speech perception and production has been the assumption for classic speech perception theories for NH listeners. Lashley (1951) argued that perception and production have too much in common to depend on wholly different mechanisms (29). The relationship between perception and production of later acquired speech in the prelingually-deafened population is not clear. Our results indicated that the poor production of tone 2 does not seem to be attributed to the ability to perceive this tone, as revealed by the contrast in the overall percent correct scores (Fig. 2) and the lack of correlation between perception and production across individual subjects. Poor production is likely due to the efforts needed to produce the rising pitch. The ability to perceive tone 3 cannot fully explain the difficulties in producing tone 3, which has the most sophisticated pitch contour. It is therefore conceivable that accurate perception is necessary but not sufficient for correct production.
Previous studies that examined the factors of age at implantation and duration of CI use in tone development of pediatric CI users have produced mixed results, with correlations present in some samples but not others (5, 16, 18, 21–23). The results of the regression analysis in the present study, which measured a much larger sample size than previous studies (N = 68) indicated that duration of CI use was a stronger predictor for tone perception relative to age at implantation. However, when both variables were entered into the regression model, in the presence of duration of CI use, age at implantation also explained a significant amount of unique variance in tone perception. The results indicate that although the performance of perception is bound to improve with experience, early implantation may facilitate learning. Age at implantation seems to be a consistently identified factor for tone production (9, 16). Taken together, the results of the present study indicate that pediatric CI users are expected to perceive tones better with experience, but production is dependent only on early implantation.
Acknowledgments
Xiaoyan Zhao and Rebecca Berger provided valuable technical support during data collection and manuscript preparation.
Work supported by an NIH NIDCD Grant (R15-DC009504) and a research contract from Advanced Bionics.
References
- 1.Friesen LM, Shannon RV, Baskent D, et al. Speech recognition in noise as a function of the number of spectral channels: comparison of acoustic hearing and cochlear implants. J Acoust Soc Am. 2001;110:1150–63. doi: 10.1121/1.1381538. [DOI] [PubMed] [Google Scholar]
- 2.Moore BCJ. Coding of sounds in the auditory system and its relevance to signal processing and coding in cochlear implants. Otol Neurotol. 2003;24:243–54. doi: 10.1097/00129492-200303000-00019. [DOI] [PubMed] [Google Scholar]
- 3.McKay CM, McDermott HJ, Clark GM. Pitch percepts associated with amplitude-modulated current pulse trains in cochlear implantees. J Acoust Soc Am. 1994;96:2664–73. doi: 10.1121/1.411377. [DOI] [PubMed] [Google Scholar]
- 4.Zeng FG. Temporal pitch in electric hearing. Hearing Res. 2002;174:101–6. doi: 10.1016/s0378-5955(02)00644-5. [DOI] [PubMed] [Google Scholar]
- 5.Han D, Liu B, Zhou N, et al. Lexical tone perception with HiResolutionR 120 speech-processing strategy in Mandarin-Speaking children. Ear Hear. 2009;30:169–77. doi: 10.1097/AUD.0b013e31819342cf. [DOI] [PMC free article] [PubMed] [Google Scholar]
- 6.Schatzer R, Krenmayr A, Au DKK, et al. Temporal fine structure in cochlear implants: Preliminary speech perception results in Cantonese-speaking implant users. Acta Otolaryngol. 2010;130:1031–9. doi: 10.3109/00016481003591731. [DOI] [PubMed] [Google Scholar]
- 7.Wong LLN, Vandali AE, Ciocca V, et al. New cochlear implant coding strategy for tonal language speakers. Int J Audiol. 2008;47:337–47. doi: 10.1080/14992020802070788. [DOI] [PubMed] [Google Scholar]
- 8.Xu L, Li Y, Hao J, et al. Tone production in Mandarin-speaking children with cochlear implants: A preliminary study. Acta Otolaryngol. 2004;124:363–7. doi: 10.1080/00016480410016351. [DOI] [PubMed] [Google Scholar]
- 9.Han D, Zhou N, Li Y, et al. Tone production of Mandarin Chinese speaking children with cochlear implants. Int J Pediatr Otorhinolaryngol. 2007;71:875–80. doi: 10.1016/j.ijporl.2007.02.008. [DOI] [PMC free article] [PubMed] [Google Scholar]
- 10.Zhou N, Xu L. Development and evaluation of methods for assessing tone production skills in Mandarin-speaking children with cochlear implants. J Acoust Soc Am. 2008;123:1653–64. doi: 10.1121/1.2832623. [DOI] [PMC free article] [PubMed] [Google Scholar]
- 11.Xu L, Zhou N. Tonal languages and cochlear implants. In: Zeng F-G, Popper AN, Fay RR, editors. Auditory Prostheses: New Horizons. New York: Springer Science+Business Media, LLC; 2011. pp. 341–64. [Google Scholar]
- 12.Whalen DH, Xu Y. Information for Mandarin tones in the amplitude contour and in brief segments. Phonetica. 1992;49:25–47. doi: 10.1159/000261901. [DOI] [PubMed] [Google Scholar]
- 13.Xu L, Tsai Y, Pfingst BE. Features of stimulation affecting tonal-speech perception: Implications for cochlear prostheses. J Acoust Soc Am. 2002;112:247–58. doi: 10.1121/1.1487843. [DOI] [PMC free article] [PubMed] [Google Scholar]
- 14.Zhou N, Xu L. Lexical tone recognition with spectrally mismatched envelopes. Hear Res. 2008;246:36–43. doi: 10.1016/j.heares.2008.09.006. [DOI] [PMC free article] [PubMed] [Google Scholar]
- 15.Wei WI, Wong R, Hui Y, et al. Chinese tonal language rehabilitation following cochlear implantation in children. Acta Otolaryngol. 2000;120:218–21. doi: 10.1080/000164800750000955. [DOI] [PubMed] [Google Scholar]
- 16.Peng SC, Tomblin JB, Cheung HT, et al. Perception and production of mandarin tones in prelingually deaf children with cochlear implants. Ear Hear. 2004;25:251–64. doi: 10.1097/01.aud.0000130797.73809.40. [DOI] [PubMed] [Google Scholar]
- 17.Ciocca V, Francis AL, Aisha R, et al. The perception of Cantonese lexical tones by early-deafened cochlear implantees. J Acoust Soc Am. 2002;111:2250–6. doi: 10.1121/1.1471897. [DOI] [PubMed] [Google Scholar]
- 18.Lee KYS, van Hasselt CA, Chiu SN, et al. Cantonese tone perception ability of cochlear implant children in comparison with normal-hearing children. Int J Pediatr Otorhinolaryngol. 2002;63:137–47. doi: 10.1016/s0165-5876(02)00005-8. [DOI] [PubMed] [Google Scholar]
- 19.Wong AOC, Wong LLN. Tone perception of Cantonese-speaking prelingually hearing-impaired children with cochlear implants. Otolaryngol Head Neck Surg. 2004;130:751–8. doi: 10.1016/j.otohns.2003.09.037. [DOI] [PubMed] [Google Scholar]
- 20.Barry JG, Blamey PJ. The acoustic analysis of tone differentiation as a means for assessing tone production in speakers of Cantonese. J Acoust Soc Am. 2004;116:1739–48. doi: 10.1121/1.1779272. [DOI] [PubMed] [Google Scholar]
- 21.Xu L, Chen X, Lu H, et al. Tone perception and production in pediatric cochlear implant users. Acta Otolaryngol. 2011;131:395–8. doi: 10.3109/00016489.2010.536993. [DOI] [PMC free article] [PubMed] [Google Scholar]
- 22.Lee KYS, van Hasselt CA, Tong MCF. Lexical tone perception ability of profoundly hearing-impaired children: Performance of cochlear implant and hearing aid users. Otol Neurotol. 2010;31:1079–87. doi: 10.1097/MAO.0b013e3181eb3242. [DOI] [PubMed] [Google Scholar]
- 23.Lee KYS, van Hasselt CA, Tong MCF. Age sensitivity in the acquisition of lexical tone production: Evidence from children with profound congenital hearing impairment after cochlear implantation. Ann Otol Rhinol Laryngol. 2010;119:258–65. doi: 10.1177/000348941011900409. [DOI] [PubMed] [Google Scholar]
- 24.Xu L, Chen X, Zhou N, et al. Recognition of lexical tone production of children with an artificial neural network. Acta Otolaryngol. 2007;127:365–9. doi: 10.1080/00016480601011477. [DOI] [PMC free article] [PubMed] [Google Scholar]
- 25.Zhou N, Zhang W, Lee C-Y, et al. Lexical tone recognition with an artificial neural network. Ear Hear. 2008;29:326–35. doi: 10.1097/AUD.0b013e3181662c42. [DOI] [PMC free article] [PubMed] [Google Scholar]
- 26.Wong P, Schwartz GR, Jenkins JJ. Perception and production of lexical tones by 3-year-old Mandarin-speaking children. J Speech Lang Hear Res. 2005;48:1065–79. doi: 10.1044/1092-4388(2005/074). [DOI] [PubMed] [Google Scholar]
- 27.Li CN, Thompson SA. The acquisition of tone in Mandarin-speaking children. J Child Lang. 1997;4:185–99. [Google Scholar]
- 28.Zhu H, Dodd B. The phonological acquisition of Putonghua (Modern Standard Chinese) J Child Lang. 2000;27:3–42. doi: 10.1017/s030500099900402x. [DOI] [PubMed] [Google Scholar]
- 29.Lashley KS. The problem of serial order in behavior. In: Jeffress LA, editor. Cerebral Mechanisms in Behavior. New York: Wiley; 1951. pp. 112–36. [Google Scholar]


