

Abstract
Green tea-based dietary supplements (GTDSs) have gained popularity in the U.S. market in recent years. This study evaluated the phytochemical composition difference of GTDS in comparison with green tea leaves using an HPLC/MS fingerprinting technique coupled with chemometric analysis. Five components that are most responsible for class separation among samples were identified as (−) epicatechin gallate, strictinin, trigalloylglucose, quercetin-3-O-glucosylrhamnosylglucoside, and kaempferol-3-O-galactosyl-rhamnosylglucoside, according to the accurate mass measurements and MS/MS data. The similarity coefficients between the GTDSs in solid form with green tea were 0.55 to 0.91, while for the GTDSs in liquid form they were 0.12 to 0.89, which suggested that chemical composition variance across the GTDSs was significant. Flavonol aglycone concentrations were higher in GTDSs than in tea leaves, indicating the degradation of flavonol glycosides or the oxidation of catechin during the manufacturing and storage processes. In some GTDS samples, compounds were identified that were on the label. The results demonstrate the urgency of QC for GTDS products.
Tea (Camellia sinensis) has been consumed as the most globally popular beverage, aside from water (1). It is usually consumed in unfermented (green tea; GT), semifermented (oolong teas), and fermented (black, red, and cooked pu-erh) forms, with GT the most popular. Compared to the fermented teas, green tea contains more antioxidant polyphenolic catechins. The major GT catechins are epicatechin, epigallocatechin, epicatechin gallate, and epigallocatechin gallate (EGCG; 2). Tea catechins exhibit a large range of biological activities such as angiogenesis, alteration of cell signaling (3–7), and weight loss (8, 9). Because of its diverse health effects, green tea extract has gained popularity as the fourth most commonly used dietary supplement in the U.S. market in recent years (10). Commercial GT-based dietary supplements (GTDSs) are available in solid (capsules and tablets) and liquid forms. Commercial GTDSs claim to be “standardized” for levels of polyphenols and catechins. However, the extraction and manufacturing procedures of GTDSs are not standardized, and the recommended daily intake amounts (equivalent to the respective labeled standardized GTE amount) of different manufacturers range from 100 to 6000 mg.
As GTDSs become more and more popular in the United States, questions remain as to the quality and efficacy of these products. There are very few studies comparing GTDSs and GT. Currently, there are several reports showing that the actual content of catechin or polyphenols was not consistent with the label claims (11–13). These studies were all carried out with the traditional approach of targeted compound quantitation. The traditional approach requires multiple standards and is expensive, laborious, and time-consuming. Moreover, this approach focuses only on selected targets (often catechins) and ignores other known or unknown constituents. A compositional comparison of GTDSs and tea leaves was not performed in those studies. This approach is not suitable for detection of adulteration or loss of compounds in GTDSs.
A non-targeted chromatographic fingerprinting technique with principal component analysis (PCA) can be effectively used to profile phytochemical differences among samples from different origins or varieties. Previously in our laboratory, this approach has been used successfully in the quality evaluation of Ginkgo biloba and Pycnogenol-based dietary supplements (14, 15). HPLC/MS is one of the most powerful analytical tools. Moreover, when accurate mass measurement is used, HPLC/MS allows for identification of the components if needed. HPLC/MS has been successfully used in the characterization of flavan-3-ols, flavonoids, gallic acid, quinic esters of caffeine, thearubigins, and alkaloids in different kinds of tea (16–22).
The aim of this study was to compare the phytochemical composition of GTDSs with GT leaves using an HPLC/MS fingerprinting approach and chemometric analysis. Twenty commercially available GTDS samples and eight GT samples (leaves) were evaluated. Constituents in GTDS and GT samples were identified using accurate mass measurement and MS/MS. A PCA model was established to distinguish the chemical differences between GT and GTDS samples.
Experimental
Reagents, Standards, and Samples
-
(a)
Water.—Optima grade (Fisher Scientific, Pittsburgh, PA).
-
(b)
Acetonitrile.—Optima grade (Fisher Scientific).
-
(c)
Methanol.—Optima grade (Fisher Scientific).
-
(d)
Formic acid.—MS grade (Sigma-Aldrich, St. Louis, MO).
-
(e)
Reference standards.—(+)-Catechin, (−)-epicatechin, (−)-gallocatechin, (−)-epigallocation, (−)-epicatechin3-gallate, (−)-catechin 3-gallate, (−)-epigallocatechin 3-gallate, and (−)-gallocatechin 3-gallate were obtained from Sigma-Aldrich. Theaflavin and theaflavin 3,3′-digallate were obtained from Chromadex, Inc. (Irvine, CA).
-
(f)
HPLC mobile phase.—Mobile phase A was 0.1% formic acid in water and mobile phase B was 0.1% formic acid in acetonitrile.
-
(g)
Samples.—Twenty GTDS samples representing most of the big dietary supplement manufacturers were purchased commercially. Table 1 shows the label claims of the 20 GTDS samples. All of the samples were labeled as GTE, and no details were provided about extraction procedures. Ten of the samples were encapsulated extracts, two were tablets, and the remaining eight were liquids. All of the extracts had label claims as total catechin, total polyphenol, or total standardized GTE contents. Product J claimed to be decaffeinated, and Products N and Q specified that Luo Han Guo (the fruit of Siraitia grosvenorii) and stevia leaf extracts were added. Eight GT leaf samples from China, Japan, and Taiwan were used as listed in Table 2. Six of them were common grade tea and two of them (T5 and T8) were special grade (much more expensive), categorized commercially. The eight GT leaves were selected based on their chemical composition according to a previous study (21). The goal was to select a group of GT samples with as much chemical difference as possible to be representative of all types.
Table 1.
Label claims of GT extract based GTDSs
| Supplement | Serving form | Labeled GT extract weight, mg/serving size | Total polyphenols | Catechins, % | EGCG, % |
|---|---|---|---|---|---|
| A | Tablet | 500 | — | — | 35 |
| B | Capsule | 500 | 40% | 30 | 14.81 |
| C | Capsule | 300 | 80% | 40 | — |
| D | Capsule | 250 | 95% | 75 | 55 |
| E | Capsule | 400 | 60% | 40 | — |
| F | Capsule | 500 | — | — | 14 |
| G | Capsule | 2000 | 50% | — | — |
| H | Capsule | 600 | 50% | — | — |
| I | Capsule | 1000 | 20% | — | — |
| J | Capsule | 250 | 20% | — | 14 |
| K | Tablet | 600 | 90% | — | — |
| L | Capsule | 600 | 50% | — | — |
| M | Liquid | 2000 | — | — | — |
| N | Liquid | 100 | 90% | — | 50 |
| O | Liquid | 2000 | 150 mg | — | — |
| P | Liquid | 2000 | 7.5% | — | — |
| Q | Liquid | 100 | — | — | — |
| R | Liquid | 103 | — | — | — |
| S | Liquid | 2000 | 150 mg | — | — |
| T | Liquid | — | — | — | — |
Table 2.
GT sample information
| Sample name | Tea name | Location |
|---|---|---|
| T1 | Mingqian green tea | Sichuan, China |
| T2 | Japanese green tea | Japan |
| T3 | Japanese Sancha | Japan |
| T4 | Yinhou tea | Zhejiang, China |
| T5 | Maojian tea | Henan Xinyang, China |
| T6 | Tenren Pilochun | Taiwan |
| T7 | Japanese Bancha | Japan |
| T8 | Jiangxi Maofeng | Jiangxi, China |
Apparatus
-
(a)
HPLC system.—Agilent 1100 HPLC system (Agilent Technologies, Palo Alto, CA) consisting of a quaternary pump with a vacuum degasser, a thermostatted column compartment, an autosampler, and a diode array detector (DAD).
-
(b)
Mass spectrometer.—LCQ Classic ion-trap mass spectrometer (Thermo Fisher Scientific Inc., Waltham, MA) and Agilent 6530 accurate-mass quadrupole-time of flight (Q-TOF) mass spectrometer equipped with an electrospray ionization (ESI) probe were used for accurate mass measurement.
-
(c)
Centrifuge.—IEC Clinical Centrifuge (Danon/IEC Division, Needham Heights, MA).
-
(d)
HPLC column.—Phenomenex (Sigma-Aldrich) Hydro RP C18 column (4 μm particle size, 250 × 2.0 mm id) with Column-Saver™ precolumn filter (MAC-MOD Analytical, Inc., Chadds Ford, PA).
-
(e)
HPLC conditions.—The mobile phase consisted of a combination of A (0.1% formic acid in water) and B (0.1% formic acid in acetonitrile). The gradient increased linearly from 10 to 25% B (v/v) at 30 min and to 65% B at 60 min with a flow rate of 0.25 mL/min. The post-run time for re-equilibrating the system with the beginning mobile phase was 15 min. The DAD was set at 350 and 270 nm, and UV spectra were continuously recorded from 190 to 450 nm.
-
(f)
MS conditions.—ESI was performed in the negative ion and positive ion modes over the range of m/z 100–1500. For the LCQ, the following conditions were used: sheath gas flow rate, 80 arbitrary units; auxiliary gas flow rate, 10 arbitrary units; spray voltage, 4.50 kV; heated capillary temperature, 220°C; capillary voltage, 34 V for positive and −7 V for negative mode; and tube lens offset, 25 V.
For accurate mass measurement, the Q-TOF was operated in both the positive and negative modes with a capillary voltage of 3500 V; nebulizer 30 psig; drying gas, 12.0 L/min; sheath gas flow, 16.3 L/min, gas temperature, 300°C; fragmentor, 165 V; skimmer, 60 V; OCT DC1, 46 V; and OCT RFV, 750 V. The samples were run in the data-dependent MS/MS mode. Mass spectra were recorded over a mass range of 100 to 1600 Da. The multichannel plate detector voltage was 650 V and the photomultiplier tube voltage was 659 V. Mass calibration was performed with an Agilent tune mix from 100 to 1600 Da.
Sample Preparation
-
(a)
Solid form GTDS samples.—Twenty-five tablets of each sample were weighed to 0.1 mg accuracy and ground into a fine powder; 25 capsules of each capsule sample were opened and the contents weighed to 0.1 mg accuracy. A 100 mg amount of powder from each sample was mixed with 10.00 mL methanol–water (6 + 4, v/v) in a 15 mL centrifuge tube and sonicated for 1 h at room temperature. The slurry mixture was centrifuged at 5000 × g for 10 min. Then the supernatant was filtered through a 0.20 μm PVDF syringe filter (VWR Scientific, Seattle, WA). Finally, a 2 μL aliquot was injected for HPLC/MS analysis.
-
(b)
Liquid form GTDS samples.—Each bottle was vortexed 30 s prior to extraction. Then 200 μL of the sample was diluted by 10 with methanol–water (60 + 40, v/v) to 2.00 mL, and votexed again for 30 s. The mixture was filtered through a 0.20 mm PVDF syringe filter, and 2 μL was injected for HPLC/MS analysis.
-
(c)
GT leaves.—Each of the tea samples was finely powdered and passed through a 20-mesh sieve prior to extraction. Each powdered tea sample (100 mg) was extracted with 10.00 mL of methanol–water (60 + 40, v/v) in a 15 mL centrifuge tube and sonicated for 1 h at room temperature. The slurry mixture was centrifuged at 5000 × g for 10 min. Then the supernatant was filtered through a 0.20 μm PVDF syringe filter, and 2 μL was injected for HPLC/MS analysis.
Multivariate Statistical Analysis
The HPLC/MS raw files were converted to NetCDF (Network Common Data Form) format with Xcalibur (Thermo Fisher Scientific Inc.) and subsequently processed by the XCMS package (Version 1.14.1, http://metlin.scripps.edu/download/) under R (Version 2.10.1, the R project for statistical computing, www.r-project.org) using default settings of the XCMS. The resulting table from XCMS was then exported to Microsoft Excel (Chevy Chase, MD). Normalization was performed against the EGCG peak intensity prior to multivariate analyses. The resulting matrix involving peak index (m/z, retention time pair), sample names, and normalized peak area percent were introduced into a SIMCA-P 11.5 software package (Umetrics AB, Umea°, Sweden) for the PCA analysis.
Similarity Analysis
First, all peaks were aligned using the software SpectraAlign (Version 2.4, Cartwright Group, PTCL, University of Oxford, Oxford, UK), and then a reference chromatogram was calculated using the average of eight GT samples (T1–T8). The similarity of each chromatogram against this reference chromatogram was then calculated based on the average Pearson's correlation coefficient of each chromatogram with the equation:
where x and y are the sample means of X and Y, and sx and sy are the sample SD values of X and Y. Cluster analysis was performed based on Ward's method using R (Version 2.10.1, the R project for statistical computing, www.r-project.org).
Results and Discussion
Peak Identification
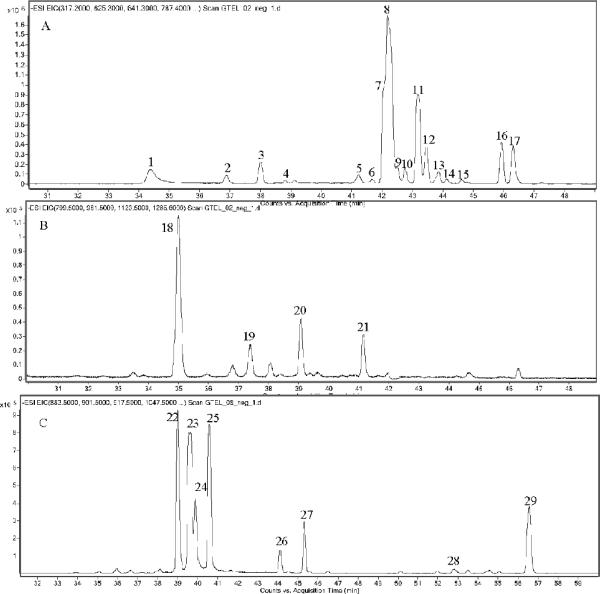
The HPLC method used in this study was an improved version of the method reported previously by our group (21) using a newer HPLC column (narrower diameter and smaller particle size) for better separation and reduced solvent usage (Figures 1–3). Accurate mass measurement was used in this study to assist in the identification of the constituents. A total of 66 constituents from various GTDSs have been identified according to their retention times, the accurate mass measurements, their MS/MS spectra, and literature reports (Table 3). The chemical differences between GTDS and GT samples were mainly in flavonoid contents and theaflavins. Many components reported in fermented tea (oolong tea, pu-erh tea, and black tea) were identified in GTDS samples, especially in the liquid form.
Figure 1.

The UV chromatograms detected at 350 nm of all GTDS and GT samples.
Figure 3.
Extracted ion chromatograms showing the additives identified in Supplements N, Q, and S (Table 1); constituents from (A) stevia leaves, (B) Luo Han Guo, and (C) fenugreek.
Table 3.
Constituents identified in GTDS and green tea leaf samples with accurate mass measurement
| Peak No. | Rt | Formula | [M−H]− | Main product ions | Δm, ppm | Identification |
|---|---|---|---|---|---|---|
| 1 | 2.59 | C7H14N2O3 | 175.1086a | 158, 129, 84, 70 | −5.06 | Theanine |
| 2 | 2.75 | C7H12O6 | 191.0578 | 85, 127 | −8.79 | Quinic acid |
| 3 | 2.81 | C13H16O10 | 331.0687 | 169, 191, 271, 89 | −4.81 | Galloylglucose |
| 4 | 3.41 | C30H26O14 | 609.1259 | 347, 191, 305, 271, 423 | −1.50 | Theasinensin C |
| 5 | 3.53 | C14H16O10 | 343.0656 | 191, 169, 125 | 4.27 | 3-O-galloylquinic acid |
| 6 | 3.67 | C14H16O10 | 343.0651 | 191, 169, 125 | 5.73 | 5-O-galloylquinic acid |
| 7 | 3.77 | C14H16O10 | 343.0655 | 191, 169, 125 | 4.56 | 4-O-galloylquinic acid |
| 8 | 3.97 | C7H6O5 | 169.0121 | 125, 81 | 12.63 | Gallic acid |
| 9 | 5.01 | C7H8N4O2 | 181.0707a | 163, 138 | 7.23 | Theobromine |
| 10 | 5.69 | C15H14O7 | 305.0650 | 125, 167, 251, 219, 165, 209, 261, 139, 137 | 5.48 | Gallocatechin |
| 11 | 9.81 | C7H8N4O2 | 181.0725a | 163, 135, 107, 153, 145 | −2.77 | Theophylline |
| 12 | 9.96 | C37H39O18 | 761.1355 | 609, 591, 453, 471 | 0.15 | Theasinensin B or E |
| 13 | 10.47 | C16H1808 | 337.0914 | 289, 173, 163, 119, 93 | 4.41 | 3-p-Coumaroylquinic acid |
| 14 | 12.04 | C15H14O6 | 289.0703 | 245, 205, 109, 125, 203, 151, 123,137 | 5.04 | Catechin |
| 15 | 12.24 | C8H10N4O2 | 195.0731a | 138,110 | −0.01 | Caffeine |
| 16 | 12.53 | C27H22O18 | 633.0734 | 301, 463, 275, 249, 169 | −0.10 | Strictinin |
| 17 | 13.53 | C30H26O12 | 577.1331 | 407, 289, 125, 245, 451 | 3.55 | (Epi)catechin(epi)catechin |
| 18 | 14.51 | C30H26O12 | 577.1334 | 407, 289, 125, 245, 451 | 3.03 | Procyanidin B2 |
| 19 | 15.09 | C37H30O17 | 745.1391 | 423, 305, 593, 125 | 2.58 | Gallocatechin catechingallate |
| 20 | 15.54 | C44H34O22 | 913.1477 | 632, 494, 806 | −0.88 | Theasinensin A or D |
| 21 | 16.68 | C15H14O6 | 289.071 | 245, 205, 109, 125, 203, 151, 123, 137 | 2.63 | Epicatechin |
| 22 | 16.99 | C16H1808 | 337.091 | 289, 173, 163, 119, 93 | 5.59 | 5-p-Coumaroylquinic acid |
| 23 | 17.75 | C22H18O11 | 457.0774 | 305, 169, 125, 161, 331 | 0.51 | Epigallocatechin gallate |
| 24 | 18.49 | C37H30O16 | 729.1444 | 169, 125, 305, 423,577 | 2.34 | Procyanidin B2 3′-O-gallate |
| 25 | 19.49 | C37H30O16 | 729.1447 | 407, 289, 169, 125, 575, 593, 305, 271 | 1.93 | Procyanidin B3-3-O-gallate |
| 26 | 19.94 | C22H18O11 | 457.0775 | 169, 125, 305 | 0.29 | Epigallocatechin gallate |
| 27 | 20.32 | C27H22O18 | 635.0876 | 465, 483, 313, 169, 125 | 0.46 | Trigalloylglucose |
| 28 | 20.67 | C37H30O16 | 729.146 | 169, 305, 635, 465, 407, 577, 125, 687, 595 | 0.15 | Procyanidin B3-3-O-gallate or isomer |
| 29 | 20.89 | C26H28O14 | 563.1397 | 169, 305, 353, 125 | 1.65 | Apigenin 6-C glucosyl-8-C-arabinoside or apigenin 6-C-arabinoyl-8-C-glucoside |
| 30 | 21.76 | C20H34O22 | 625.144 | 316, 317, 465, 169, 125 | 4.63 | Myricetin 3-O-rhanmosylglucoside |
| 31 | 22.16 | C21H20O13 | 479.0816 | 316, 317, 125 | 3.15 | Myricetin 3-O-galactoside |
| 32 | 22.57 | C21H20O13 | 479.0822 | 316, 317, 127, 431, 341, 97 | 1.90 | Myricetin 3-O-glucoside |
| 33 | 23.44 | C33H40O21 | 771.1991 | 301, 169, 125 | −0.22 | Quecetin 3-O-galactosylrutinoside |
| 34 | 23.68 | C27H30O15 | 593.1489 | 293, 413, 473, 169 | 3.86 | 4″-O-glucosylvitexin |
| 35 | 23.59 | C23H20O11 | 471.092 | 305, 183, 161, 125, 139 | 2.72 | (−)-Epigallocatechin-3-O-(3-O-methyl)gallate |
| 36 | 24.45 | C33H40O21 | 771.1997 | 301, 169, 125 | −0.99 | Qucercetin 3-O-glucosylrutinoside |
| 37 | 25.22 | C21H20O10 | 431.0968 | 311, 283, 169, 341 | 3.63 | Vitexin |
| 38 | 25.58 | C27H30O14 | 577.1546 | 413, 293, 169, 353, 457 | 2.90 | Vitexin-2″-O-rhamnoside |
| 39 | 25.35 | C44H30O20 | 881.1565 | 169, 289, 441 | 0.64 | ECG dimer |
| 40 | 25.58 | C27H30O14 | 577.1546 | 413, 293, 169, 353, 457 | 2.90 | Vitexin-2″-O-rhamnoside |
| 41 | 26.07 | C27H30O16 | 609.1461 | 300, 311, 463, 271, 169 | 0.01 | Quercetin 3-O-rhamnosylgalactoside or rutin |
| 42 | 26.24 | C21H20O10 | 431.0968 | 311, 283, 169, 341 | 3.63 | Isovitexin |
| 43 | 26.27 | C22H18O10 | 441.0827 | 289, 169, 245 | 0.05 | Epicatechin gallate |
| 44 | 27.15 | C21H20O12 | 463.0862 | 300, 301, 169 | 4.31 | Quercetin 3-O-glucoside |
| 45 | 27.22 | C22H18O10 | 441.0816 | 289, 169, 245 | 2.53 | Catechin gallate |
| 46 | 27.97 | C33H40O20 | 755.2045 | 285, 169 | −0.64 | Kaempferol 3-O-glucosylrutinoside |
| 47 | 30.04 | C27H30O15 | 593.1497 | 285, 169, 97, 125, 305 | 2.51 | Kaempferol 3-O-rhamnosylgalactoside |
| 48 | 31.72 | C21H20O11 | 447.0921 | 284, 285, 357, 169 | 2.64 | Kaempferol 3 -O-glucoside |
| 49 | 31.94 | C23H20O11 | 455.0970 | 289, 183, 245, 125, 205 | 3.00 | Methoxyepiafzelechine gallatea |
| 50 | 32.47 | C22H18O9 | 425.0866 | 273, 169, 125, 341, 229 | 2.83 | Epiafzelechin gallatea |
| 51 | 33.80 | C15H10O8 | 317.0285 | 179, 151, 257, 289, 299, 193, 165, 163 | 5.63 | Myricetin |
| 52 | 39.76 | C47H54O27 | 1049.2785 | 301, 903, 431 | −0.50 | Quercetin 3-O-acylglycoside |
| 53 | 40.36 | C49H42O17 | 901.2373 | 285, 755, 737, 615, 145, 113 | −2.63 | Quercetin 3-O-p-coumaroyl-pentosyl-rhamnosylhexoside |
| 54 | 40.54 | C41H44O22 | 887.2241 | 301, 300, 741, 169, 723 | 1.18 | Quercetin 3-O-p-coumaroyl-pentosyl-rhamnosylhexoside |
| 55 | 40.66 | C41H44O22 | 887.2239 | 301, 300, 285, 741, 431, 113, 163, 145 | 2.30 | Quercetin 3-O-p-coumaroyl-pentosyl-rhamnosylhexoside |
| 56 | 41.30 | C29H24O12 | 563.1178 | 545, 527, 519, 501 | 3.01 | Theaflavin |
| 57 | 41.91 | C49H42O17 | 901.2397 | — | −5.29 | Quercetin 3-O-p-coumaroyl-pentosyl-rhamnosylhexoside |
| 58 | 42.61 | C36H28O16 | 715.1302 | 545, 563, 527, 671 | 0.36 | Theaflavin 3-gallate |
| 59 | 42.67 | C42H46O21 | 885.2450 | 285, 431, 739, 575, 145 | 1.00 | Kaempferol 3-O-p-coumaroyl dirhamnosylhexoside |
| 60 | 43.10 | C15H10O7 | 301.0334 | 151, 179, 273, 107 | 6.54 | Quercetin |
| 61 | 43.28 | C43H32O20 | 867.1398 | 715, 697, 679, 527, 545, 559, 565 | 1.86 | Theaflavin-3,3'-digallate |
| 62 | 44.60 | C30H26O13 | 593.1285 | 285, 145, 447 | 2.63 | Kaempferol 3-O-p-coumaroyl glucoside |
| 63 | 47.70 | C15H10O6 | 285.0390 | 151, 179 | 5.11 | Kaempferol |
| 64 | 50.50 | C39H32O15 | 739.1652 | 285, 453, 145, 163, 593, 575 | 2.22 | Kaempferol 3-O-di-p-coumaroyl glucoside |
| 65 | 50.92 | C39H32O15 | 739.1657 | 285, 453, 145, 163, 593, 575 | 1.55 | Kaempferol 3-O-di-p-coumaroyl glucoside |
| 66 | 51.52 | C39H32O15 | 739.1640 | 285, 453, 145, 163, 593, 575 | 3.84 | Kaempferol 3-O-di-p-coumaroyl glucoside |
Identified by [M + H]+ and positive MS/MS data.
Flavonoids Contents
Figure 1 shows the chromatograms detected at 350 nm of GT (T1–T8) and GTDS (A–K, solid form; L–T, liquid form) samples. There were some obvious differences in peak intensities and/or additional peaks in the GTDS samples compared with the GT samples. The most obvious is Sample T, for which peaks corresponding to tea constituents were detected either by UV or MS (Figures 1 and 2, respectively). The chromatogram for Sample T was almost identical to the blank run. The label of Sample T did not provide any information regarding to the amount of GTE or other polyphenols. The product was light brown colored with sediments by visual inspection.
Figure 2.

HPLC/ESI-MS total ion chromatograms of all GTDS and GT samples.
Among the other samples, peaks 51, 60, and 63 in Table 3, with retention times at 33.8, 43.1, and 47.7 min, respectively, were obviously higher in GTDSs than those in GT leaves. Furthermore, these three peaks were higher in liquid form GTDSs than those in solid form GTDSs. The molecular composition of Peak 51 (m/z 317.0285, M-H) is C15H12O8 [Δm = (measured mass − theoretical mass)/theoretical mass] = 5.63 ppm. The collision induced dissociation (CID)-MS/MS generated product ions at m/z 289 (0,2A−), 271 (0,2A− –H2O), 179 (1,3A−), and 151 (1,3A− –CO) with the loss of one CO, CO plus H2O, C7H6O3, and C8H6O4, respectively. The ion at m/z 179 was generated through retro-Diels-Alder (RDA) fission. All of the above information was consistent with myricetin, and a flavonol glycone previously characterized in tea. Similarly, peaks at 60 and 63 min were identified as quercetin and kaempferol by their high resolution MS and MS/MS data, respectively. These three flavonols were considered to be the fundamental structures of many flavonol glycosides detected in GT. According to the literature (23), the relative contents of myricetin, quercetin, and kaempferol increased when a new oolong tea was converted into an old one due to the degradation of flavonol glycosides. In the GTDS samples, especially liquid samples, these three basic flavonol aglycones were in much higher concentration than those in the raw leaves, indicating that degradation of flavonol glycoside took place during the manufacturing and storage processes.
Peaks 37 and 42 (Table 3) with retention time at 25.2 and 26.2 min, respectively, had the same m/z (431.0968, M–H), which gave the chemical composition C21H20O10. In the negative CID-MS/MS spectra, significant product ions at m/z 341, 311, and 283 were observed in keeping with the cross ring cleavage of a flavonol-C-monoglycoside (24–26). Based on retention times and the mass fragmentation data, these two peaks were identified as vitexin and isovitexin, respectively. These two flavonol-C-glycosides existed mainly in GTDS samples and may have been formed via the degradation product of vitexin diglycosides or isovitexin diglycosides.
Figure 2 shows the HPLC/MS profiles of all samples. Peak 16 with a retention time of 12.5 min, was high in GT samples but very low in GTDS samples. The m/z of the peak was 633.0734 [M-H]−, suggesting that the molecular composition was C27H22O18 (Δm = 0.10 ppm). The product ions at m/z 463 and 301 corresponded to the cleavage of gallic acid (−C7H6O5, 170.0210 Da, Δm = 3.08 ppm) and gallic acid plus glucosyl residue (−C13H16O10, 332.0728 Da, Δm = 4.66 ppm). A product ion at m/z 169 was consistent with the deprotonated ion of gallic acid. Based on literature reports (20, 21), this compound was identified as strictinin, a known component in GT.
Ten peaks (52, 53, 54, 55, 57, 59, 62, 64, 65, and 66), corresponding to the acylated flavonol O-glycosides in T5 and T8, were characterized. These components were not found in most of the GTDS samples except for Sample B. The acylated flavonol glycosides are considered to have a positive correlation with the GT grade (21). Hence, it can be deduced that most of the GTDS products are made from lower-grade GT.
Theaflavins
GT chemical composition may vary with the origin, harvest time, and drying conditions. However, theaflavins were seldom reported in GT leaves. Peaks 56, 58, and 61 at 41.3, 42.6, and 43.3 min, and with deprotonated ions at m/z 563, 715, and 867, respectively, of samples A, C, D, E, J, K, and L were not found in GT leaves. These three peaks were identified as theaflavins. The main MS2 (MS/MS) product ions of m/z 563 were m/z 545, 527, 519, 501, and 407, corresponding to the loss of a H2O, two H2O, CO2, CO2 plus H2O, and a 156 Da unit, respectively. The fragment of 156 Da was consistent with the loss of H2O and RDA fission (138 unit). This peak was identified as theaflavin and confirmed with a reference standard. Similarly, Peaks 58 and 61 were identified as theaflavin 3-gallate and theaflavin-3,3′-digallate, respectively. As reported in the literature (1), these constituents are major theaflavins found in fermented tea, such as black tea, and are the products of catechin oxidation during the fermentation process. Therefore, it can be concluded that the oxidation occurred during the manufacturing process of GTDSs.
Additives in GTDSs
GTDS products in liquid form were all deeply dark-colored and tasted bitter except for Sample T. Despite the label claims that no sugar was added, a peak corresponding to sucrose (m/z 341.1082, C12H22O11, Δm = 2.15 ppm) was a common component in liquid GTDS products. The sucrose peak was not detected in GT samples, so sugar must have been added to some of the GTDSs for taste despite the label claims.
The labels of Samples N and Q claimed that natural sweeteners Luo Han Guo and stevia leaf were added. As shown in Figure 3, the HPLC/MS profiles of Samples N and Q were obviously different from the other samples. The constituents corresponding to Luo Han Guo and stevia leaf were characterized according to the accurate MS and MS/MS measurements. From the MS/MS experiments the primary fragments of the parent ions of these natural sweeteners was the loss of glucose. Taking Peak 13 (Table 4, Figure 3A) as an example, the deprotonated ion at m/z 625.3218 suggested the molecular formula is C32H50O12 (1.84 ppm). The MS/MS spectrum gave a typical fragmentation pattern of glycone glycosides with successive losses of a rhamnosyl residue and a hexosyl-rhamnosyl group (Figure 4). The product ion at m/z 317 was steviol glycones (C20H30O3). The formula and MS/MS spectrum are consistent with the structure of esteviolbioside, which is a component from stevia leaf. In total, 17 peaks from stevia leaves and five peaks from Luo Han Guo were identified, as listed in Table 4 (27–31).
Table 4.
Constituents identified from additives in supplements N, Q, and S, identified in Table 1
| Peak No. | Formula | [M−H]− | Theoretical value | Identification | Error, Δm ppm | Main product ions, m/z |
|---|---|---|---|---|---|---|
| 1 | C20H30O3 | 317.2107 | 317.2117 | Steviola | 4.77 | — |
| 2 | C44H70O23 | 965.4231 | 965.4235 | Rebaudioside Ea | −0.43 | — |
| 3 | C50H80O28 | 1127.4785 | 1127.4763 | Rebaudioside Da | −1.92 | 965, 856, 803, 641, 169 |
| 4 | C44H70O22 | 949.4306 | 949.4286 | Rebaudioside Ca or isomer | −2.11 | 641, 806, 479, 169 |
| 5 | C38H60O18 | 803.3712 | 803.3707 | Stevioside or rebaudioside B isomera | −0.64 | 641, 479, 317, 161 |
| 6 | C50H80O28 | 1127.4785 | 1127.4763 | Rebaudioside Da or isomer | −1.92 | 965, 641, 169 |
| 7 | C44H70O23 | 965.4252 | 965.4235 | Rebaudioside Aa | −1.75 | 463, 441 |
| 8 | C38H60O18 | 803.3700 | 803.3701 | Steviosidea | 0.86 | 641, 479, 317, 161 |
| 9 | C44H70O23 | 965.4242 | 965.4235 | Rebaudioside E or isomera | −0.71 | — |
| 10 | C38H60O18 | 803.3712 | 803.3701 | Rebaudioside Ba | −0.64 | 641, 479, 169 |
| 11 | C43H68O22 | 935.4143 | 935.4124 | Rebaudioside Fa | −1.44 | 773, 611 |
| 12 | C44H70O22 | 949.4306 | 949.4286 | Rebaudioside Ca | −2.11 | 787, 625, 479 |
| 13 | C32H50O12 | 625.3218 | 625.3230 | Esteviolbiosidea | 1.84 | 625, 641, 479, 317, 169 |
| 14 | C38H60O18 | 803.3700 | 803.3707 | Stevioside or rebaudioside Ba | 0.86 | 641, 479 |
| 15 | C44H70O22 | 949.4280 | 949.4286 | Rebaudioside Ca | 0.63 | 806, 787, 625 |
| 16 | C44H70O23 | 965.4230 | 963.4280 | Rebaudioside Aa | −0.53 | 463, 441 |
| 17 | C32H50O13 | 641.3169 | 641.3173 | Steviobioside or rubusosidea | 1.50 | 479, 317, 113 |
| 18 | C60H102O29 | 1285.8471 | 1285.6434 | Mogroside Vb | 2.88 | 1123, 179, 961, 799 |
| 19 | C54H92O24 | 1123.5904 | 1123.5906 | Mogroside IVb | 0.16 | 961, 799, 641, 169 |
| 20 | C48H82O19 | 961.5369 | 961.5378 | Mogroside IIIb | 0.58 | 805, 641, 543, 169, 479 |
| 21 | C42H72O14 | 799.4845 | 799.4849 | Mogroside II Eb | 0.54 | 641, 683, 521, 479 |
| 22 | C57H94O28 | 1225.5904 | 1225.5894 | Trigoneoside XIIIac | −0.82 | 1063, 901, 755, 89 |
| 23 | C51H84O23 | 1063.5371 | 1063.5331 | Trigoneoside IVac | −3.79 | 901, 755, 1047, 89, 119, 59, 101 |
| 24 | C51H84O22 | 1047.5375 | 1047.5381 | Trigonelloside Cc | 0.62 | 901, 755, 89, 119, 101 |
| 25 | C45H74O18 | 901.4828 | 901.4837 | Trigofoenoside A or Glycoside Dc | −2.84 | 755, 89, 119, 59, 101 |
| 26 | C51H82O22 | 1045.5254 | 1045.5225 | Graecunin Ec | 0.09 | 883, 737 |
| 27 | C45H72O17 | 883.4702 | 883.4697 | Graecunin Gc | −0.59 | 737, 293, 89, 119, 59, 101, 163, 179, 203 |
| 28 | C61H94O27 | 1257.5903 | 1257.5910 | Foliatheasaponin IIIc | 0.53 | 1091, 1125, 89, 191, 205, 247, 119 |
| 29 | C45H72O17 | 883.4705 | 883.4697 | Graecunin G or isomer | −0.93 | 721, 575, 89, 119, 179, 205, 289 |
From stevia leaf.
From Luo Han Guo.
From fenugreek.
Figure 4.
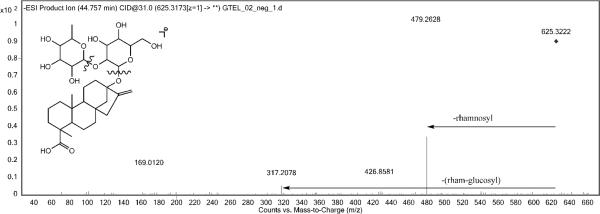
The MS/MS fragmentation of esteviolbioside. The product ion with m/z 317 is the steviol aglycone.
The label of Sample S, a GTDS, indicated its only additive was glycerin, but its HPLC-UV/MS chromatographic profile was quite different from other GTDS samples, as shown in Figure 2. Several peaks with high abundance, observed between 35 to 60 min (Figure 3), were not tea constituents. The fragmentation behavior of these peaks suggested the successive losses of hexosyl or rhamnosyl groups. For Peak 25 (Table 4), the deprotonated ion at m/z 901.4828 suggested the molecular formula is C45H74O18 (−2.84 ppm). The MS/MS spectrum displayed product ions at m/z 755 [M-H-146]− and 593 [M-H-146–162]−, representing the loss of methylpenosyl and hexosyl sugar units, respectively. The product ions at m/z 59, 89, 101, and 119 were consistent with the cross-ring cleavage of a terminal glycoside. Altogether, seven components with similar mass fragmentation behavior were characterized in Sample S. A library search revealed that these peaks belonged to steroidal saponins from fenugreek (Trigonella foenum-graecum L.; 32–34). Therefore, a fenugreek extract dietary supplement product made by the same manufacturer was purchased and analyzed (data not shown). The result verified our speculation that fenugreek extract was either added or was a contaminant during the manufacturing process for Sample S.
Similarity and Cluster Analysis
To evaluate the similarity between GTDS and tea leaf samples, Pearson's correlation coefficient was calculated for the chromatographic profiles. Chromatograms were first aligned using the method of peak alignment by fast fourier transform (35). A reference chromatogram was calculated as the average of eight GT samples. Then Pearson's correlation coefficient was calculated for the chromatogram of each sample against the reference chromatogram of GT leaf samples. As shown in Figure 5, the similarity coefficient between the GTDS samples in solid form (Samples H–L) with GT was 0.55 to 0.91, while for the GTDS samples in liquid form (Samples M–T) was 0.12 to 0.89, which suggests that the chemical variance across the GTDS samples was significant. Samples M, N, S, and T were quite different from tea samples. Samples H, I, J, K, and O, on the other hand, showed consistency with the tea reference. A hierarchical clustering analysis was used based on Pearson's correlation coefficient matrix for the measurement of similarity between the samples. The 20 GTDS samples were separated into three clusters according to their similarities to the reference chromatogram (Figure 6). Cluster I (M, N, P, Q, R, and S) contained all the liquid GTDSs. Cluster III was mainly solid GTDSs that have similar chemical composition compared with the GT reference. Sample T was classified as a separate cluster due to its poor quality. This sample could be easily picked out by cluster analysis and using the Pearson correlation coefficient.
Figure 5.
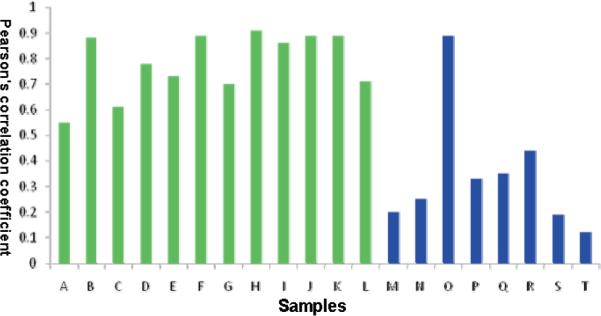
The similarity of GTDS and green tea samples based on the Pearson's correlation coefficient. Green-GTDS in liquid form (samples A–L); Blue- GTDS in solid form (samples M–T).
Figure 6.

The cluster dendrogram of 20 GTDS samples. Cluster I (M, N, P, Q, R, S) is composed of mainly liquid GTDS samples. Cluster III is mainly solid GTDS samples that have a chemical composition similar to that of the GT reference. Sample letters are identified in Table 1.
Principal Component Analysis (PCA)
While a simple visual inspection of chromatograms may detect some obviously outlying samples, PCA was thought to be the best method for revealing chemical variance between samples. PCA involves a mathematical procedure that transforms a number of possibly correlated variables into a smaller number of non-correlated variables called principal components. It is the simplest of the true eigenvector-based multivariate analyses.
The peak list with m/z, retention time (Rt), and ion abundance information for PCA was generated from XCMS (Scripps Center for Mass Spectrometry, http://masspec.scripps.edu/xcms/), which is an HPLC/MS based data analysis package with nonlinear retention time alignment, matched filtration, peak detection, and peak matching (36). Sample T was excluded prior to the XCMS peak detection as almost no peaks were detected in the sample. Eighty-one variables (m/z, Rt) were found with the XCMS default setting. EGCG was selected as the reference peak and the other 80 peaks were normalized against EGCG, which gave a matrix of 30 samples × 80 peaks. Pareto scaling was used for data preprocessing. The application of PCA allowed the large HPLC/MS data set to be reduced to three principal components, PC1, PC2, and PC3, that accounted for 85% of the total variance with 56% predictability in the multidimensional space. The liquid GTDS samples were clearly separated from the solid samples and GT samples in the PCA score plot (Figure 7A), which suggests that the variability across liquid samples was huge, especially for Samples M and P. The cluster of solid samples was relatively tight and had a better chemical consistency than that of the liquid samples or GT leaves. The GT leaves exhibited a wide variability of the chemical composition. This is expected since the GT samples used in this study were selected to have as much chemical variance as possible based on a previous study (21). T8 is a special grade (commercially categorized) Maofeng, and only the very young leaves were used during the manufacturing process. It was not surprising that this sample was separated in the score plot from the other samples. According to the loading plot (Figure 7B), peaks 16, 27, 36, 42, and 46 (Table 3) were mainly responsible for the separation of liquid GTDSs from other kinds of samples. These five peaks were identified as (−) epicatechin gallate, strictinin, trigalloylglucose, quercetin-3-O-glucosylrhamnosylglucoside, and kaempferol-3-O-galactosyl-rhamnosylglucoside. The PCA results showed clearly the poor qualities of the liquid GTDS samples, which is consistent with the results of the similarity and cluster analyses.
Figure 7.
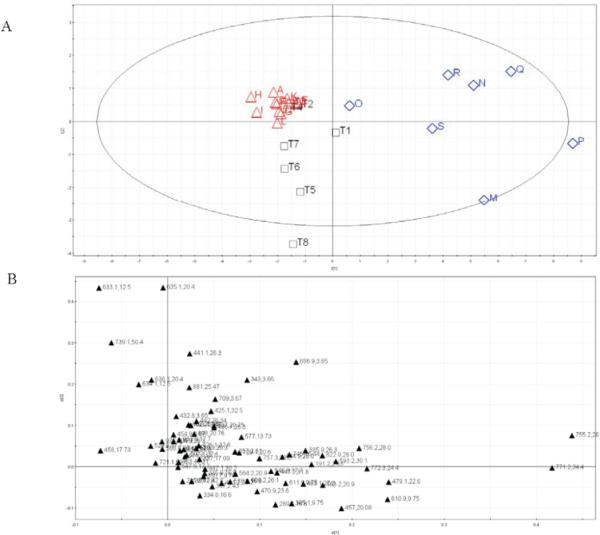
PCA score (A) and loading plot (B) derived from the HPLC/MS dataset of GTDS samples and GT leaves. ▲, GTDS solid form; ◇, GTDS liquid form; □, GT samples.
Conclusions
Our results showed that a wide variability of chemical composition exists between GTDS and GT samples. The nontargeted HPLC/MS approach found constituents from other botanical extracts in some GTDSs. Although there are some good GTDS products, there is no way for the consumer to know the qualities of the GTDS products from reading the labels. More importantly, the consumer may ingest other botanical extracts unintentionally. Our study demonstrated that degradation of flavonol glycosides or oxidation of catechin occurred during the manufacturing and storage processes for GTDS samples; some additives in the GTDSs were not labeled; the daily intake amount recommended by the labels varies significantly; the quality of GTDS varies significantly; and the solid GTDS products are more chemically similar to tea leaves compared to their liquid counterparts. The claim that a GTDS is a good alternative for tea leaves is questionable from a chemical composition point of view.
Acknowledgments
This research was supported by the Agricultural Research Service of the U.S. Department of Agriculture and an Interagency Agreement with the Office of Dietary Supplements of the National Institutes of Health. We would like to thank Agilent Technologies Inc. for the accurate mass measurements.
References
- (1).Graham HN. Prev. Med. 1992;21:334–350. doi: 10.1016/0091-7435(92)90041-f. [DOI] [PubMed] [Google Scholar]
- (2).Lakenbrink C, Lapczynski S, Maiwald B, Engelhardt UH. J. Agric. Food Chem. 2000;48:2848–2852. doi: 10.1021/jf9908042. [DOI] [PubMed] [Google Scholar]
- (3).Ju J, Hong J, Zhou JN, Pan Z, Bose M, Liao J, Yang GY, Liu YY, Hou Z, Lin Y, Ma J, Shih WJ, Carothers AM, Yang CS. Cancer Res. 2005;65:10623–10631. doi: 10.1158/0008-5472.CAN-05-1949. [DOI] [PubMed] [Google Scholar]
- (4).Shimizu M, Shirakami Y, Moriwaki H. Int. J. Mol. Sci. 2008;9:1034–1049. doi: 10.3390/ijms9061034. [DOI] [PMC free article] [PubMed] [Google Scholar]
- (5).Nance CL, Siwak EB, Shearer WT. J. Allergy Clin. Immunol. 2009;123:459–465. doi: 10.1016/j.jaci.2008.12.024. [DOI] [PMC free article] [PubMed] [Google Scholar]
- (6).Tang FY, Chiang EP, Shih CJ. J. Nutr. Biochem. 2007;18:391–399. doi: 10.1016/j.jnutbio.2006.07.004. [DOI] [PubMed] [Google Scholar]
- (7).Cho KN, Sukhthankar M, Lee SH, Yoon JH, Baek SJ. Eur. J. Cancer. 2007;43:2404–2412. doi: 10.1016/j.ejca.2007.07.020. [DOI] [PMC free article] [PubMed] [Google Scholar]
- (8).Maki KC, Reeves MS, Farmer M, Yasunaga K, Matsuo N, Katsuragi Y, Komikado M, Tokimitsu I, Wilder D, Jones F, Blumberg JB, Cartwright Y. J. Nutr. 2009;139:264–270. doi: 10.3945/jn.108.098293. [DOI] [PubMed] [Google Scholar]
- (9).Hursel R, Westerterp-Plantenga MS. Am. J. Clin. Nutr. 2009;89:822–830. doi: 10.3945/ajcn.2008.27043. [DOI] [PubMed] [Google Scholar]
- (10).Sarma DN, Barrett ML, Chavez ML, Gardiner P, Ko R, Mahady GB, Marles RJ, Pellicore LS, Giancaspro GI, Low Dog T. Drug Safety. 2008;31:469–484. doi: 10.2165/00002018-200831060-00003. [DOI] [PubMed] [Google Scholar]
- (11).Manning J, Roberts JC. J. Herb. Pharmacother. 2003;3:19–32. [PubMed] [Google Scholar]
- (12).Seeram NP, Henning SM, Niu Y, Lee R, Scheuller HS, Heber D. J. Agric. Food. Chem. 2006;54:1599–1603. doi: 10.1021/jf052857r. [DOI] [PubMed] [Google Scholar]
- (13).Weiss DJ, Austria EJ, Anderton CR, Hompesch R, Jander A. J. Chromatogr. A. 2006;1117:103–108. doi: 10.1016/j.chroma.2006.03.057. [DOI] [PubMed] [Google Scholar]
- (14).Chen P, Ozcan M, Harnly J. Anal. Bioanal. Chem. 2007;389:251–261. doi: 10.1007/s00216-007-1386-9. [DOI] [PMC free article] [PubMed] [Google Scholar]
- (15).Chen P, Song F, Lin LZ. J. AOAC Int. 2009;92:624–632. [PubMed] [Google Scholar]
- (16).Beretta G, Furlanetto S, Regazzoni L, Zarrella M, Facino RM. J. Pharm. Biomed. Anal. 2008;48:606–611. doi: 10.1016/j.jpba.2008.05.036. [DOI] [PubMed] [Google Scholar]
- (17).Clifford MN, Stoupi S, Kuhnert N. J. Agric. Food Chem. 2007;55:2797–2807. doi: 10.1021/jf063533l. [DOI] [PubMed] [Google Scholar]
- (18).Menet MC, Sang S, Yang CS, Ho CT, Rosen RT. J. Agric. Food Chem. 2004;52:2455–2461. doi: 10.1021/jf035427e. [DOI] [PubMed] [Google Scholar]
- (19).Del Rio D, Stewart AJ, Mullen W, Burns J, Lean ME, Brighenti F, Crozier A. J. Agric. Food Chem. 2004;52:2807–2815. doi: 10.1021/jf0354848. [DOI] [PubMed] [Google Scholar]
- (20).Dou J, Lee VS, Tzen JT, Lee MR. J. Agric. Food Chem. 2007;55:7462–7468. doi: 10.1021/jf0718603. [DOI] [PubMed] [Google Scholar]
- (21).Lin LZ, Chen P, Harnly JM. J. Agric. Food Chem. 2008;56:8130–8140. doi: 10.1021/jf800986s. [DOI] [PMC free article] [PubMed] [Google Scholar]
- (22).Mulder TP, van Platerink CJ, Wijnand Schuyl PJ, van Amelsvoort JM. J. Chromatogr. B. 2001;760:271–279. doi: 10.1016/s0378-4347(01)00285-7. [DOI] [PubMed] [Google Scholar]
- (23).Gonzalez-Barrio R, Trindade LM, Manzanares P, de Graaff LH, Tomas-Barberan FA, Espin JC. J. Agric. Food. Chem. 2004;52:6136–6142. doi: 10.1021/jf0490807. [DOI] [PubMed] [Google Scholar]
- (24).Lesimple A, Di Falco M, Richard Y, Lesimple S, Wang Z, Chan TH, Mamer OA. Rapid Commun. Mass Spectrom. 2005;19:3253–3258. doi: 10.1002/rcm.2186. [DOI] [PubMed] [Google Scholar]
- (25).Lee VS, Dou J, Chen RJ, Lin RS, Lee MR, Tzen JT. J. Agric. Food Chem. 2008;56:7950–7956. doi: 10.1021/jf801688b. [DOI] [PubMed] [Google Scholar]
- (26).Fu Y, Zu Y, Liu W, Zhang L, Tong M, Efferth T, Kong Y, Hou C, Chen L. J. Sep. Sci. 2008;31:268–275. doi: 10.1002/jssc.200700312. [DOI] [PubMed] [Google Scholar]
- (27).Waridel P, Wolfender JL, Ndjoko K, Hobby KR, Major HJ, Hostettmann K. J. Chromatogr. A. 2001;926:29–41. doi: 10.1016/s0021-9673(01)00806-8. [DOI] [PubMed] [Google Scholar]
- (28).Pereira CA, Yariwake JH, McCullagh M. Phytochem. Anal. 2005;16:295–301. doi: 10.1002/pca.820. [DOI] [PubMed] [Google Scholar]
- (29).Qi XY, Chen WJ, Zhang LQ, Xie BJ. Nutr. Res. 2008;28:278–284. doi: 10.1016/j.nutres.2008.02.008. [DOI] [PubMed] [Google Scholar]
- (30).Jaitak V, Bikram Singh B, Kaul VK. Phytochem. Anal. 2009;20:240–245. doi: 10.1002/pca.1120. [DOI] [PubMed] [Google Scholar]
- (31).Soejarto DD, Kinghorn AD, Farnsworth NR. J. Nat. Prod. 1982;45:590–599. doi: 10.1021/np50023a013. [DOI] [PubMed] [Google Scholar]
- (32).Carakostas MC, Curry LL, Boileau AC, Brusick DJ. Food Chem. Toxicol. 2008;46:S1–S10. doi: 10.1016/j.fct.2008.05.003. [DOI] [PubMed] [Google Scholar]
- (33).Li D, Ikeda T, Matsuoka N, Nohara T, Zhang H, Sakamoto T, Nonaka G. Chem. Pharm. Bull. 2006;54:1425–1428. doi: 10.1248/cpb.54.1425. [DOI] [PubMed] [Google Scholar]
- (34).Kassaian N, Azadbakht L, Forghani B, Amini M. Int. J. Vitam. Nutr. Res. 2009;79:34–39. doi: 10.1024/0300-9831.79.1.34. [DOI] [PubMed] [Google Scholar]
- (35).Wong JW, Cagney G, Cartwright HM. Bioinformatics. 2005;21:2088–2090. doi: 10.1093/bioinformatics/bti300. [DOI] [PubMed] [Google Scholar]
- (36).Smith CA, Want EJ, O'Maille G, Abagyan R, Siuzdak G. Anal. Chem. 2006;78:779–787. doi: 10.1021/ac051437y. [DOI] [PubMed] [Google Scholar]