Figure 4.
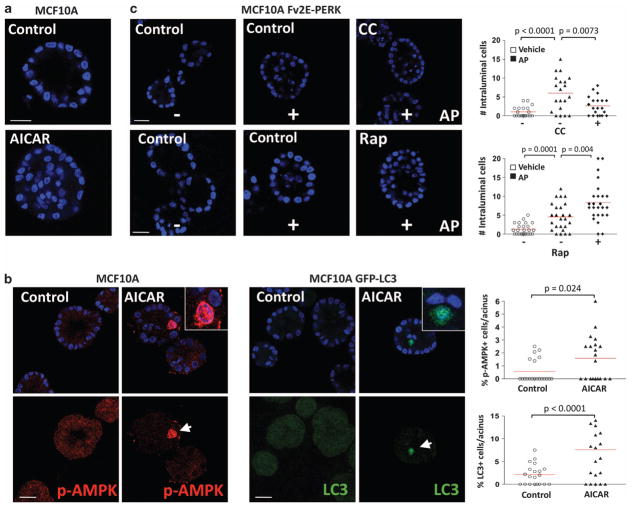
Impact of modulating AMPK activity on luminal filling in 3D culture. (a) Representative confocal images of day 12 MCF10A acini, treated from day 6 to day 12 with 10 μM AICAR showing intraluminal cell accumulation. Scale bars indicate 10 μm. (b) Confocal equatorial images from parental (left set) or GFP-LC3 (right set) MCF10A acini treated from day 6 to day 12 with 10 μM AICAR and stained with the indicated antibodies (Abs). Magnifications show intraluminal p-AMPK (red) or GFP-LC3 (green) staining in AICAR-treated acini. The percent of positive events per acinus was scored and plotted (right graphs, n = 20). Scale bars indicate 25 μm. (c) Confocal equatorial images from Fv2E-PERK MCF10A acini treated with or without 100 pM AP and/or 10 μM compound C (CC), and/or 50 nM rapamycin (Rap) fixed at day 12 of morphogenesis showing intraluminal filling. Right graphs show the distribution and mean of intraluminal cells for each equatorial section of a single acinus (n = 20). Scale bars indicate 15 μm. P-values were determined by the Student’s t-test.

