

Abstract
We report the imaging of β-cyclodextrin/benzoic acid binding at 14T using hyperpolarized 13C magnetic resonance (MR). Benzoic acid was polarized using a dynamic nuclear polarization (DNP) approach and combined with β-cyclodextrin in aqueous solution. As anticipated, decreases in the spin-lattice relaxation constant (T1) were observed with decreases in the ligand/ receptor ratio. The calculated log K was approximately 1.7, similar to previously reported binding constants. Hyperpolarized [1-13C] benzoic acid was used to interrogate solutions of variable β-cyclodextrin concentration, with the mixtures imaged at 14T using a 3D frequency-selective MR sequence. Differences in β-cyclodextrin concentration were easily visualized. These results suggest that hyperpolarized 13C MR could be used in vivo to determine the presence, and density of receptors for a given ligand-receptor pair.
At the core of modern pharmacotherapy is molecular recognition between small molecule ligands and their protein targets (typically enzymes) in water. The hydrophobic effect is critical in this process. The driving force for the hydrophobic phenomenon is primarily entropic, where water must adopt an “organized” structure as it solvates non-polar molecules, thereby reducing solvent entropy1. This effect has been studied extensively using various complexes of β-cyclodextrin, a naturally occurring cyclic polysaccharide composed of β-D-glucose residues linked through α-1,4 glycosidic bonds2. These molecules have been of interest as a result of their amphiphilic nature: while the hydroxyl groups confer high water solubility, the cyclic arrangement of sugars creates a hydrophobic cavity. The cyclodextrin ligand-receptor system has been used to mimic a variety of interactions between proteins and small molecules3-5. Here, we report the imaging of this model system using hyperpolarized 13C MR, a technique that can be extended in vivo to a variety of biomolecules relevant to the treatment of human disease.
Recent developments in the fields of low temperature physics, electron paramagnetic resonance (EPR), and NMR have allowed the application of dynamic nuclear polarization (DNP) to traditional liquids NMR6,7. This process typically requires the sample of choice to exist as an amorphous solid at 1°K in the presence of a stable organic free radical. This technique has been used to study in vivo metabolism by polarizing a metabolite, at close to physiologic levels (in the mM range), and injecting it into a system to observe its conversion8-11 or distribution by MRI/MRSI7. Bench-top studies have also been conducted to investigate ways the hyperpolarized signal can be used indirectly. These have focused on observing other nuclei, typically 1H via direct bond12, or secondarily labeling a compound by way of chemical reaction13.
It is still unclear how to interpret changes of hyperpolarized signal as a function of the nuclear environment. The dominant force associated with decay of the hyperpolarized signal is spin-lattice relaxation (or T1). The hyperpolarized signal of long T1 carbons lasts longer and this signal can be converted into an ordered spin state using an appropriate pulse sequence14. In most DNP studies, the T1 relaxation time is used as a parameter for determining what spins to label and observe. The goal of this study was to use T1 relaxation to understand the effect of hydrophobic binding on hyperpolarized signals, and use T1 changes to image a model ligand-receptor system in aqueous solution.
It is well known that in fast exchange systems, changes in parameters such as observed magnetization, chemical shift, and spin relaxation rates (T1, T2, T1ρetc…) can be used to estimate equilibrium constants such as the binding constant in a ligand-receptor system15. In this case we used the well-characterized system of benzoic acid (ligand) and β-cyclodextrin (receptor)16,17. In the presence of β-cyclodextrin, the aromatic ring of benzoic acid preferentially inserts itself into the inner-core of the cyclodextrin molecule, confirmed by x-ray crystallography (Figure 1a).18
Figure 1.

(a) Structure of the β-cyclodextrin- benzoic acid complex, as solved by X-ray crystallography in 2003 by Aree et al. (b) 13C NMR spectrum of natural abundance hyperpolarized benzoic acid, obtained in a single 5° pulse at 36.4 mM (310K, pH = 7.8). All carbons are observed: C1-176.6 ppm, C2-137.3 ppm, C3,C7- 129.8 ppm, C4,C6- 129.3 ppm and C5-132.2 ppm.
To explore this system, samples of natural abundance benzoic acid were dissolved in dimethylacetamide (DMA) to a concentration of 3.6M. 2mg of the Finland radical19 per 100mg of benzoic acid was used as the organic free radical. Prepared samples were polarized for approximately 1 hour (at 94.094 Ghz) in a Hypersense® (Oxford Instruments, Oxford UK) and dissolved in 5mL of 100 mM phosphate buffer (pH=7.8). For binding studies, the hyperpolarized benzoic acid solution was mixed with 0.5mM β-cyclodextrin in the same 100mM phosphate buffer. All NMR studies were conducted at 310K in a 10mm broadband probe on a 500Mhz (125Mhz for 13C) Varian INOVA NMR spectrometer. All data were acquired using a 5° flip angle and 3s repetition time. Apparent T1 relaxation times were fit to a mono-exponential equation in Matlab (Mathworks) as previously described13,20,21.
As seen in Figure 1b, all carbons of natural abundance benzoic acid were hyperpolarized, observed and resolved in one 5° degree pulse at a concentration of 36.4mM.
Hyperpolarized benzoic acid was then mixed in increasing concentrations relative to 0.5 mM β-cyclodextrin to assess the changes in T1. The hyperpolarized decay of the C1 and C2 carbons of benzoic acid, as well as the effect of changing the ligand-receptor ratio are shown in Figure 2. Overall signal decreased more rapidly in time as a result of the interaction of the benzoic acid carbons and β-cyclodextrin. For example, when benzoic acid β-cyclodextrin were combined at concentrations of 36.4 and 0.5 mM respectively, the apparent T1 decreased from 34.9 s and 19 s to 28.8 s and 16.4 s for the C1 and C2 carbons. Increasing concentrations of benzoic acid relative to a constant β-cyclodextrin were used to generate the plot depicted in Figure 2b, where ΔObs is defined as 1/T1obs-1/T1free. The y-intercept of the linear fit can be used to determine the log binding constant (log K) as a result of changes in the observed T1 for the C1 and C215. The log K derived from the fits of the C1 and C2 changes were 1.74 and 1.68 respectively. These constants were within the range of reported log K measurements of benzoic acid (1.5-2.2) interacting with β-cyclodextrin16. Due to significantly lower T1, the hyperpolarized signal for the other benzoic acid carbons could not be used for reliable T1 calculations. This approach was further extended to natural abundance 2-naphthaleneacetic acid, 6-methoxy-α-methyl-sodium salt (naproxen), a drug used to treat inflammation that is a known β-cyclodextrin guest. For these studies, 6.5mM hyperpolarized naproxen was mixed with 0.5 mM β-cyclodextrin. The T1 relaxation time of the free naproxen C1 was 14.8 ± 0.3 secs (n=3) and when in the presence of the host was reduced ∼30% to 10.6 ± 0.4 secs (n=3) (Supplementary Figure 1). The other carbons were not observed in the presence of the cyclodextrin host, in keeping with previous work showing loss of hyperpolarized 13C signal with binding22.
Figure 2.

(a) Hyperpolarized signal decay of the C1 carbon of benzoic acid without the β-cyclodextrin host present (TR = 3 s, calculated T1 = 34.9 s at 11.7T). (b) Decay for the C2 carbon (calculated T1 = 19.0 s) (c) Plot of [β-cyclodextrin]/ΔObs as a function of increased benzoic acid [BA] concentration. The R2 of the C1 and C2 fits were 0.995 and 0.953 respectively.
We hypothesized that benzoic acid- cyclodextrin binding could be used to create image contrast in a 13C MR experiment at 14T. This strategy would take advantage of the T1- dependent loss of hyperpolarized signal observed in the presence of the cyclodextrin receptor, effectively creating negative contrast. A similar phenomenon would be expected in vivo for a given ligand/ receptor pair. [1-13C] benzoic acid was polarized as described previously for the natural abundance substrate. The enriched [1-13C] benzoic acid samples were polarized to 10%, corresponding to a signal enhancement of approximately 9000-fold at 14T. Imaging studies were performed on a 14T, 600WB micro-imaging spectrometer equipped with 100G/cm gradients (Varian Instruments). For hyperpolarized 13C imaging, a 3D frequency-selective echo planar sequence was used to acquire a 3D image for [1-13C] benzoic acid with an acquisition time of approximately 180ms23. The final concentration of [1-13C] benzoic acid was 2.5 mM, combined with the β-cyclodextrin host at final concentrations of 0.5, 2.5, and 10 mM. These results are described in Figure 3, with loss of hyperpolarized 13C signal observed with increasing concentrations of β-cyclodextrin. Figure 3a shows both 1H and 13C imaging of the four cyclodextrin-containing solutions as well as a 5M [1-13C] benzoic acid phantom (in 6mm glass tubes). 1H gradient echo imaging reveals similar signal for the five samples, while the hyperpolarized MR image shows diminished signal corresponding to the concentration of the cyclodextrin host. The same 3D MR sequence was used to image the tubes at equilibrium, with only the 13C benzoic acid phantom visible. The 1H image was used to define regions of interest (ROI's) and the mean 13C MR signal intensities for the cyclodextrin solutions were used to construct the graph displayed in Figure 3b, providing a gross correlate to the T1 experiments conducted previously.
Figure 3.
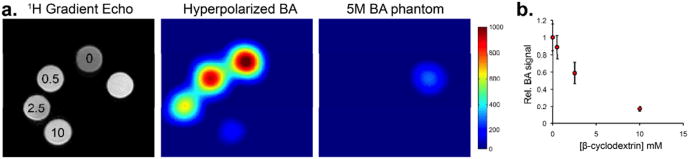
Hyperpolarized 13C MR imaging experiment conducted at 14T. (a) 1H imaging shows the orientation of tubes containing variable β-cyclodextrin concentration (0–10 mM final concentration). Also included is a [1-13C] benzoic acid phantom (5 M). The hyperpolarized 13C MR imaging study was performed using a 3D frequency-selective sequence after administration of hyperpolarized [1-13C] benzoic acid (final concentration 2.5 mM), and demonstrates loss of signal corresponding with increasing [β-cyclodextrin].(b) Graph of hyperpolarized [1-13C] benzoic acid MR signals observed with variable [β-cyclodextrin], quantified for the imaging experiment.
In a typical modern 1H MRI exam, tissue contrast is obtained by differences between the intrinsic T1 and T2 of various tissues. Our results suggest a new mechanism of MR contrast, whereby changes in T1 of an administered hyperpolarized 13C probe can be correlated with the concentration of a cellular target. As the arsenal of hyperpolarized 13C probes expands, numerous ligand-receptor pairs relevant to the treatment of human disease may be investigated simultaneously24, and non-invasively. In the context of a biologically relevant ligand/ receptor pair, we would expect to observe T1- mediated loss of hyperpolarized signal in the presence of receptor, that in many cases would be clinically significant. For example, 13C steroid probes could be used to determine the estrogen/ progesterone receptor status in patients with breast cancer, or predict response to anti-androgen therapy in prostate cancer. This technique will benefit from the tighter binding seen in biologic systems, allowing receptors at smaller concentrations to be interrogated.
Supplementary Material
Footnotes
Electronic Supplementary Information (ESI) available: Spectroscopoic data for the described ligand-receptor binding experiments. This material is available free of charge via the internet at http://www.rsc.org. See DOI: 10.1039/b000000x/
Notes and references
- 1.Kyte J. Biophys Chem. 2003;100:193–203. doi: 10.1016/s0301-4622(02)00281-8. [DOI] [PubMed] [Google Scholar]
- 2.Szejtli J. Chem Rev. 1998;98:1743–1753. doi: 10.1021/cr970022c. [DOI] [PubMed] [Google Scholar]
- 3.Breslow R, Zhang XJ, Huang Y. J Am Chem Soc. 1997;119:4535–4536. [Google Scholar]
- 4.Breslow R, Hammond M, Lauer M. J Am Chem Soc. 1980;102:421–422. [Google Scholar]
- 5.Tabushi I, Kuroda Y, Yamada M, Higashimura H, Breslow R. J Am Chem Soc. 1985;107:5545–5546. [Google Scholar]
- 6.Ardenkjaer-Larsen JH, Fridlund B, Gram A, Hansson G, Hansson L, Lerche MH, Servin R, Thaning M, Golman K. Proc Natl Acad Sci USA. 2003;100:10158–10163. doi: 10.1073/pnas.1733835100. [DOI] [PMC free article] [PubMed] [Google Scholar]
- 7.Golman K, Ardenkjaer-Larsen JH, Petersson JS, Mansson S, Leunbach I. Proc Natl Acad Sci USA. 2003;100:10435–10439. doi: 10.1073/pnas.1733836100. [DOI] [PMC free article] [PubMed] [Google Scholar]
- 8.Keshari KR, Kurhanewicz J, Bok R, Larson PE, Vigneron DB, Wilson DM. Proc Natl Acad Sci U S A. 2011;108:18606–18611. doi: 10.1073/pnas.1106920108. [DOI] [PMC free article] [PubMed] [Google Scholar]
- 9.Albers MJ, Bok R, Chen AP, Cunningham CH, Zierhut ML, Zhang VY, Kohler SJ, Tropp J, Hurd RE, Yen YF, Nelson SJ, Vigneron DB, Kurhanewicz J. Cancer Res. 2008;68:8607–8615. doi: 10.1158/0008-5472.CAN-08-0749. [DOI] [PMC free article] [PubMed] [Google Scholar]
- 10.Chen AP, Kurhanewicz J, Bok R, Xu D, Joun D, Zhang V, Nelson SJ, Hurd RE, Vigneron DB. Magnetic resonance imaging. 2008;26:721–726. doi: 10.1016/j.mri.2008.01.002. [DOI] [PMC free article] [PubMed] [Google Scholar]
- 11.Gallagher FA, Kettunen MI, Day SE, Hu DE, Ardenkjaer-Larsen JH, in't Zandt R, Jensen PR, Karlsson M, Golman K, Lerche MH, Brindle KM. Nature. 2008;453:940–U973. doi: 10.1038/nature07017. [DOI] [PubMed] [Google Scholar]
- 12.Merritt ME, Harrison C, Mander W, Malloy CR, Sherry AD. J Magn Reson. 2007;189:280–285. doi: 10.1016/j.jmr.2007.09.011. [DOI] [PMC free article] [PubMed] [Google Scholar]
- 13.Wilson DM, Hurd RE, Keshari KR, Van Criekinge M, Chen AP, Nelson SJ, Vigneron DB, Kurhanewicz J. Proc Natl Acad Sci USA. 2009 doi: 10.1073/pnas.0810190106. [DOI] [PMC free article] [PubMed] [Google Scholar]
- 14.Warren WS, Jenista E, Branca RT, Chen X. Science. 2009;323:1711–1714. doi: 10.1126/science.1167693. [DOI] [PMC free article] [PubMed] [Google Scholar]
- 15.Fielding L. Progress in Nuclear Magnetic Resonance Spectroscopy. 2007;51:219–242. [Google Scholar]
- 16.Rekharsky MV, Inoue Y. Chem Rev. 1998;98:1875–1917. doi: 10.1021/cr970015o. [DOI] [PubMed] [Google Scholar]
- 17.Schneider HJ, Hacket F, Rudiger V, Ikeda H. Chem Rev. 1998;98:1755–1785. doi: 10.1021/cr970019t. [DOI] [PubMed] [Google Scholar]
- 18.Aree T, Chaichit N. Carbohydr Res. 2003;338:439–446. doi: 10.1016/s0008-6215(02)00485-8. [DOI] [PubMed] [Google Scholar]
- 19.Cage B, McNeely JH, Russek SE, Halpern HJ. J Appl Phys. 2009;105 doi: 10.1063/1.3073992. [DOI] [PMC free article] [PubMed] [Google Scholar]
- 20.Deichmann R, Hahn D, Haase A. Magnetic Resonance in Medicine. 1999;42:206–209. doi: 10.1002/(sici)1522-2594(199907)42:1<206::aid-mrm28>3.0.co;2-q. [DOI] [PubMed] [Google Scholar]
- 21.Keshari KR, Wilson DM, Chen AP, Bok R, Larson PE, Hu S, Van Criekinge M, Macdonald JM, Vigneron DB, Kurhanewicz J. J Am Chem Soc. 2009;131:17591–17596. doi: 10.1021/ja9049355. [DOI] [PMC free article] [PubMed] [Google Scholar]
- 22.Lerche MH, Meier S, Jensen PR, Baumann H, Petersen BO, Karlsson M, Duus JO, Ardenkjaer-Larsen JH. J Magn Reson. 2010;203:52–56. doi: 10.1016/j.jmr.2009.11.020. [DOI] [PubMed] [Google Scholar]
- 23.Lippert AR, Keshari KR, Kurhanewicz J, Chang CJ. J Am Chem Soc. 2011;133:3776–3779. doi: 10.1021/ja111589a. [DOI] [PMC free article] [PubMed] [Google Scholar]
- 24.Wilson DM, Keshari KR, Larson PE, Chen AP, Hu S, Van Criekinge M, Bok R, Nelson SJ, Macdonald JM, Vigneron DB, Kurhanewicz J. J Magn Reson. 2010;205:141–147. doi: 10.1016/j.jmr.2010.04.012. [DOI] [PMC free article] [PubMed] [Google Scholar]
Associated Data
This section collects any data citations, data availability statements, or supplementary materials included in this article.