A major question confronting sustainability research today is to what extent our planet, with a finite environmental resource base, can accommodate the faster than exponentially growing human population. Although these concerns are generally attributed to Malthus (1766–1834), early attempts to estimate the maximum sustainable population (ergo, the carrying capacity K) were reported by van Leeuwenhoek (1632–1723) to be at 13 billion people (1). Since then, the concept of carrying capacity has evolved to accommodate many resource limitations originating from available water, energy, and other ecosystem goods and services (1, 2). In PNAS, Suweis et al. (3) apply the concept of carrying capacity using fresh water availability on a national scale as the limiting resource to infer the global K. They estimate a decline in global human population by the middle of this century. We ask to what extent models that are premised on a constant global K as in Suweis et al. (3) agree with an alternative class of carrying capacity models on predicting the timing for unsustainable global population growth. In particular, factors that symbolize innovation and adaptation lead to K representations that are not constant (4, 5) but may depend on a dynamic population size.
The workhorse model for describing population growth remains the logistic equation (6–8). Attributed to Pierre-François Verhulst (9) and popularized by Pearl and Reed (10), the logistic equation is dN(t)/dt = rN(t)(1 − N(t)/K), where N(t) is the population, t is time, and r is the growth rate. For a constant K and r, the solution is an S-shaped function saturating to a constant population size N(∞) = K. Suweis et al. (3) determine the r and K for each country, using a population time series from 1970 to 2010, water availability, and water use per capita. If a country has a water surplus, it can export water to water-poor countries as virtual water (VW) in the form of food. The momentary K of a nation is based on a combination of local and traded VW that provides water-poor countries the possibility to extend their population size above the local carrying capacity. The global K was assumed to be constant in time, reflecting the finite fresh water supply of the planet. A point of departure from this assumption is provided by two dynamic-K models allowing for innovative solutions. The one assumes K changes instantaneously with N(t) (4, 5), whereas the other considers large-scale social changes introduced with delays in the dependence between N and K (8, 11).
In 1960, von Foerster et al. (5) humorously developed the first model type to predict a doomsday associated with a mathematical singularity in population dynamics on November 13, A.D. 2026. They concluded that “[…] our great-great-grandchildren will not starve to death. They will be squeezed to death” (5, 12). To illustrate occurrences of singularities in finite times, the logistic equation can be recasted as dN(t)/dt = r′N(t)(K − N(t)). Von Foerster et al. (5) made the assumption that K(t) ∼ N(t)δ with δ > 1. For a large N, this yields a solution as N(t) ∼ (tc − t)−1/δ. Here, tc is known as the doomsday (4, 5). The singularity originates from N(t) and K(t) becoming infinite as t approaches a finite tc. However, given the finite resources of the planet, the singularity only signifies a “regime shift” to qualitatively different dynamics (4), such as population decline. Fitting this model to available population records in 1958, von Foerster et al. (5) determined a tc ≈ 2027.
Their ansatz reveals that even in this optimistic view of an infinite K(t), a decrease in the population is inevitable. Von Foerster et al. (5) labeled the constant-K model capping N(t) as a pessimistic view, resonating with Suweis et al. (3).
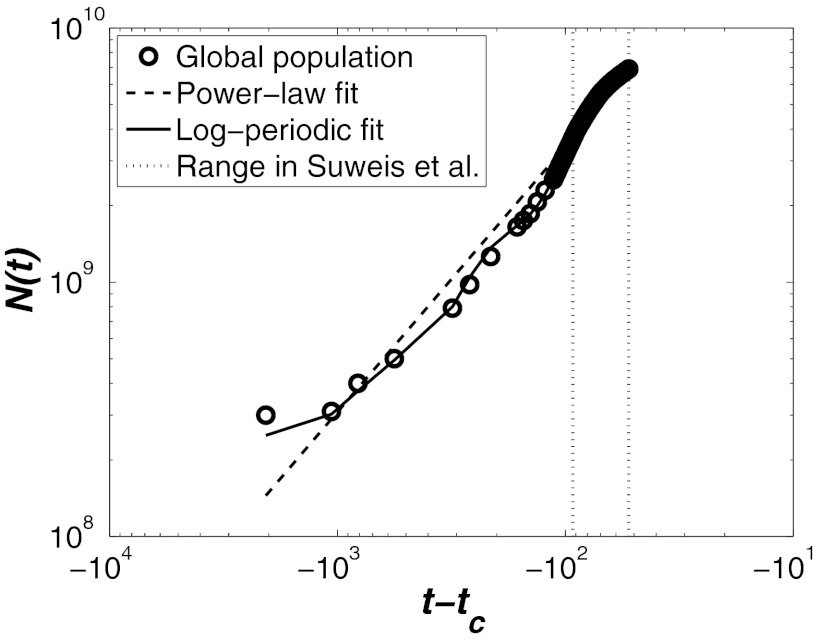
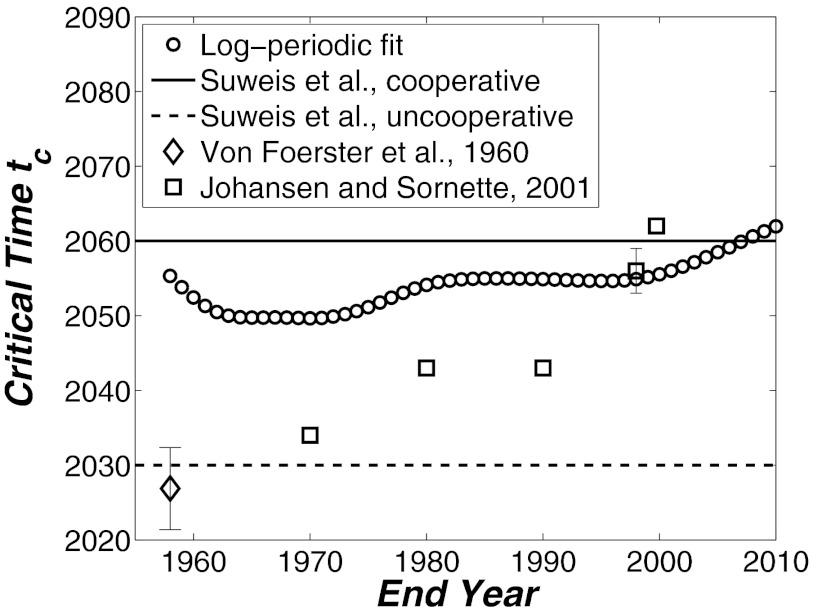
A refinement to the first model type was proposed by Johansen and Sornette (4) to explain nonrandom oscillatory behavior in N(t) around the previous power-law solution (Fig. 1). They added an imaginary component to the exponent δ without providing physical justification but noted that numerous complex systems exhibit log-periodic oscillations before a collapse (4, 13). This amendment increased the model parameters to seven but reproduced the observed N(t) as shown in Fig. 1. Because of the large number of parameters, the robustness of the calculated tc remains to be determined. To address this, we analyzed the available data by terminating them at different dates t ∈ [0, 2010]. An ending date of 1985 then signifies fitting the log-periodic function for t ∈ [0, 1985]. Fig. 2 summarizes the tc estimates obtained by von Foerster et al. (5), Johansen and Sornette (4), and our fits. The results are bounded by times determined by Suweis et al. (3) for a population decline under various VW trade scenarios and anticipated innovative potentials. It is evident that all these independent approaches suggest a regime shift in population dynamics around the middle of this century (i.e., tc ∈ [2030, 2060]).
Fig. 1.
Log-log representation of the United Nations reported global population (symbols) N(t) as a function of time t ∈ [0, 2010] to the critical time tc. The log-periodic and power-law fits to the data, as determined by us, are shown in lines. Note the nonrandom oscillatory behavior in global population dynamics superimposed on the power-law growth. The data range that Suweis et al. (3) use is shown as vertical lines.
Fig. 2.
Variation of the critical time tc inferred by us from nonlinear regression with the log-periodic approach to fit population data in [0, t], where t is the terminal date or end year. Estimates of tc as the original doomsday (4, 5) and from the analysis of Suweis et al. (3) are shown.
Another conceptually different tactic that Suweis et al. (3) use is to consider the global population as a complex network that couples nations governed by independent logistic dynamics in a VW trade system. Complex network dynamics emerge through the interplay of all nodes and edges, and they exhibit peculiar critical phenomena and singularities (14). Suweis et al. (3) group 52 countries according to their water availability into water-poor and water-rich countries, where interconnections resemble VW trade. They use three random graph topologies and one that resembles the existing global VW trade network to establish their effect on the national and global population sizes. Their findings show that among those, the current VW trade network seems the least efficient for sustaining larger population numbers for a longer period of time (3). Questions about alterations to the existing VW trade network that might be implemented so as to optimize the water distribution and increase the Earth’s carrying capacity logically follow. In real-world spatial networks, modifications on the node properties or network topology can be expected to spread slowly, thereby changing the macroscopic dynamics of the system with some time delay τ. To accommodate delays, it is conceivable that the global K or the growth parameter at time t depends on the history of population dynamics throughout (t − τ). When K(t) varies with N(t − τ), N(t) exhibits regimes that resemble a stepwise or epochal growth, with a constant frequency corresponding to lag τ, and can accommodate singularities (8). This is an interesting direction for understanding observations in population data that were identified in the early 1920s and fitted with a sequence of growth episodes rather than a single logistic curve (6).
Despite ad hoc assumptions to describe complex dynamics arising from interactions between humans and their environment, dynamic K(t) models appear to agree with the conclusions of Suweis et al. (3) about the decline of the population within 2030 and 2060. Demographic models that expand conventional approaches via probabilistic treatments of fertility, mortality, and migration support a peak population forecast at around 2070 followed by a decline (15). On this note, it would be a remiss if the collection of articles published in Science Magazine’s 125th anniversary on the most compelling issues facing science today were not mentioned. Whether “Malthus will continue to be wrong” was ranked in the top 20 list (www.sciencemag.org/site/feature/misc/webfeat/125th/). Malthus’ argument is that population growth will be reined in due to large-scale catastrophes attributed to a finite K (7). One answer to this puzzle was foreshadowed by von Foerster et al. (5), showing that a global population crash need not be associated with a finite K. In fact, von Foerster et al. (5) summed up the discussion on K in their witty style by labeling pessimists (i.e., those who argue that finite carrying capacity will limit global population) as “Malthusians by profession” and optimists [i.e., those who argue that technology and human innovation will neutralize these limitations (16)] as “Malthusians at heart.” In other words, even optimists are “hoping” that Malthus will not continue to be wrong. The work by Suweis et al. (3) and the evidence in this commentary hint that these hopes may materialize within the coming five decades no matter what limits are assumed for the planet carrying capacity.
Footnotes
The authors declare no conflict of interest.
See companion article on page 4230.
References
- 1.Cohen JE. Population growth and earth’s human carrying capacity. Science. 1995;269(5222):341–346. doi: 10.1126/science.7618100. [DOI] [PubMed] [Google Scholar]
- 2.Arrow K, et al. Economic growth, carrying capacity, and the environment. Science. 1995;268(5210):520–521. doi: 10.1126/science.268.5210.520. [DOI] [PubMed] [Google Scholar]
- 3.Suweis S, Rinaldo A, Maritan A, D’Odorico P. Water-controlled wealth of nations. Proc Natl Acad Sci USA. 2013;110:4230–4233. doi: 10.1073/pnas.1222452110. [DOI] [PMC free article] [PubMed] [Google Scholar]
- 4.Johansen A, Sornette D. Finite-time singularity in the dynamics of the world population, economic and financial indices. Physica A. 2001;294(3-4):465–502. [Google Scholar]
- 5.von Foerster H, Mora PM, Amiot LW. Doomsday: Friday, 13 November, A.D. 2026. At this date human population will approach infinity if it grows as it has grown in the last two millennia. Science. 1960;132(3436):1291–1295. doi: 10.1126/science.132.3436.1291. [DOI] [PubMed] [Google Scholar]
- 6.Kingsland S. The refractory model: The logistic curve and the history of population ecology. Q Rev Biol. 1982;57(1):29–52. [Google Scholar]
- 7.Smith DA. Human population growth: Stability or explosion? Math Mag. 1977;50(4):186–197. [Google Scholar]
- 8.Yukalov VI, Yukalova EP, Sornette D. Punctuated evolution due to delayed carrying capacity. Physica D. 2009;238(17):1752–1767. [Google Scholar]
- 9.Verhulst PF. Notice sur la loi que la population suit dans son accroissement. Correspondance Math Phys. 1838;10:113–121. French. [Google Scholar]
- 10.Pearl R, Reed LJ. On the rate of growth of the population of the United States since 1790 and its mathematical representation. Proc Natl Acad Sci USA. 1920;6(6):275–288. doi: 10.1073/pnas.6.6.275. [DOI] [PMC free article] [PubMed] [Google Scholar]
- 11.Arino J, Wang L, Wolkowicz GSK. An alternative formulation for a delayed logistic equation. J Theor Biol. 2006;241(1):109–119. doi: 10.1016/j.jtbi.2005.11.007. [DOI] [PubMed] [Google Scholar]
- 12.Umpleby SA. The scientific revolution in demography. Popul Environ. 1990;11(3):159–174. [Google Scholar]
- 13.Sornette D. Predictability of catastrophic events: Material rupture, earthquakes, turbulence, financial crashes, and human birth. Proc Natl Acad Sci USA. 2002;99(Suppl 1):2522–2529. doi: 10.1073/pnas.022581999. [DOI] [PMC free article] [PubMed] [Google Scholar]
- 14.Dorogovtsev SN, Goltsev AV, Mendes JFF. Critical phenomena in complex networks. Rev Mod Phys. 2008;80(4):1275–1335. [Google Scholar]
- 15.Lutz W, Sanderson W, Scherbov S. The end of world population growth. Nature. 2001;412(6846):543–545. doi: 10.1038/35087589. [DOI] [PubMed] [Google Scholar]
- 16.(2008) Economics focus. Malthus, the false prophet. The Economist. 2008 The Economist Newspaper Limited, May 15, 2008. [Google Scholar]


