

Abstract
The aim of the present study was to assess the effect of iron and copper consumption on weight gain and development of oxidative stress in adipose tissue of rats. Control rats obtained pure drinking water. Iron-treated groups of animals obtained FeSO4•12H2O with drinking water in concentrations of 3 and 6 mg/l, while copper-treated rats obtained CuSO4 in concentrations of 4.88 and 9.76 mg/l. The animals of the 6th group received a mixture of FeSO4•12H2O and CuSO4 in the respective concentrations of 3 and 4.88 mg/l in drinking water. All animals received a standard chow. The final weight of rats from all the experimental groups, especially in those obtaining the combination of iron and cooper, exceeded the control values. Maximal weight of fat pads was observed in animals receiving drinking water with 3 mg/l FeSO4•12H2O, 4.88 and 9.76 mg/l CuSO4, and the mixture of FeSO4•12H2O and CuSO4. The maximal intensity of free radical processes, as estimated by the concentration of fluorescent modified amino acids and the intensity of chemiluminescence in adipose tissue homogenates, was observed in rats obtaining iron in the concentration of 3 mg/l in the drinking water.
Keywords: metals, oxidative stress, weight gain, rat
Introduction
Obesity has been recognized as a global epidemic by the end of the 20th century (James 2008). Officially it is defined as an excess of body adiposity (Caballero, 2007). According to classic theories, obesity develops due to high-caloric intake, physical inactivity and genetic predisposition (Bailie-Hamilton, 2002). In the past decade, the role of ecology in obesity induction has been investigated. Numerous widely spread chemicals, predominantly polyaromatic hydrocarbons and polychlorinated biphenyls, are able to cumulate in adipose tissue (Mullerova & Kopecky, 2007) and induce weight gain (Irigaray et al., 2006; Arsenescu et al., 2008) in cases of impaired neural or humoral regulation (Bailie-Hamilton, 2002). At the same time it is known that obesity is characterized not only by growing mass of adipose tissue but also by development of oxidative stress and inflammation (Suzuki et al. 2003; Nadal-Casellas et al., 2011). Moreover, it is supposed that activation of free radical oxidation processes is one of the mechanisms leading to impaired adipose tissue signaling and subsequent increase of fat depots (Evans et al., 2003; Grimsrud et al., 2007). Oxidative stress itself can be caused by redox-metals, which are widely spread in the environment. Though there are data indicating iron-induced impairment of adipose tissue signaling (Dongiovanni et al., 2011), the ability of d-metals to induce weight gain has only partially been studied (Tajima et al., 2011; Tinkov et al., unpublished results). The aim of our research was to assess the effect of iron and copper consumption on weight gain and development of oxidative stress in adipose tissue of rats.
Materials and methods
Chemicals
Bovine serum albumin was obtained from Sigma (St. Louis, USA), Sodium di-hydrogen Phosphate 2-hydrate and di-Sodium Hydrogen Phosphate 2-hydrate for phosphate buffer were obtained from Panreac (Barcelona, Spain). All other chemicals used were of analytical or higher purity.
Animals
The current research was performed according to the rules of the Local Ethics Committee. One-month-old female Wistar rats (n=36) were divided into six groups. Female rats were used due to the physiologically larger content of adipose tissue than present in males. This anatomical feature provides the opportunity to obtain more representative results. The light and the dark cycles in the animal room were 12 hours each. The rats had been acclimatized to the laboratory conditions for one week before the study began. All animals were fed ad libitum. A granulated chow (“Orenburg food mixture factory”, Orenburg, Russia) containing 270 kcal/100g (20% protein, 70% carbohydrate, 10% fat) was used as the diet. Food consumption was registered daily at the same time. Body weight was determined once a week. After 90 days of experiment, the rats were sacrificed by decapitation.
Treatment
All groups of animals, except the control group, received FeSO4·12H2O and CuSO4 with drinking water. The concentrations of iron and copper used were calculated on the basis of maximum permissible concentrations (MPC) for these chemicals in the Russian Federation and were consequently ecologically relevant. MPCs for single chemicals Fe2+ and Cu2+ are 0.3 and 1.0 mg per liter of drinking water, respectively. Rats of the first group were used as controls and received high-quality drinking water with general mineralization less than 250 mg/l (“Aqua Vita”, Orenburg, Russia; certified by the A. N. Sysin Research Institute of Human Ecology and Environmental Health). Animals of the 2nd and the 3rd groups received drinking water containing 3 and 6 mg/l FeSO4·12H2O, respectively. Rats of the 4th and the 5th groups consumed CuSO4 with water in concentrations of 4.88 and 9.76 mg/l, respectively. Animals from the 6th group received the mixture of FeSO4·12H2O and CuSO4 in the respective concentrations of 3 and 4.88 mg/l in drinking water. With the purpose of creating natural conditions, the animals were given an unlimited access to water. Water consumption was measured daily with the use of graduated bottles. The daily measurement showed no significant difference in water consumption of animals of the control and of the experimental groups.
Morphometric studies
Body length and the final weight were determined before dissection and were used to calculate the body mass index (BMI) according to the equation (Novelli et al., 2007):
BMI = body weight (g) / length2 (cm2)
Hair of the rats was cut from the dorsal surface for subsequent analysis of copper and iron concentration in hair. During dissection, parametrial and periovarial fat was removed. The total weight of these fat pads was measured immediately. Harvested parametrial adipose tissue was used for histologic evaluation, determination of iron and copper content, and of oxidative stress markers, oxidatively modified amino acids, and chemiluminescence in particular.
Histological evaluation
Fragments of harvested parametrium were fixed in 10% neutral formalin solution, embedded in paraffin and then stained with hematoxylin and eosin. In the obtained histological sections cellular content of adipose tissue was evaluated visually.
Iron and copper assay
Hair analysis was used for determination of metal content since the concentration of the elements in hair reflects the influence of environmental factors and correlates with the concentration of chemical elements in other tissues of the organism (Creason et al., 1975). The dissected parametrium was used also for determination of metals in adipose tissue. Iron and copper in harvested tissues were determined by the respective methods of atomic-emission and mass-spectrometry with inductively coupled plasma (µg/g of tissue). For elemental content of tissues, determination spectrometer Optima 2000 DV (Perkin-Elmer, USA) and spectrometer Elan 9000 (Perkin-Elmer, USA) were used.
Fluorescence studies
Oxidatively modified amino acids in adipose tissue were determined fluorometrically in order to assess the intensity of protein oxidation. Adipose tissue was homogenized in 20 volumes of ice cold phosphate buffer. The final volume of probes for analysis was 2 ml and contained 1.9 ml of 1/15 phosphate buffer (pH=7.4) and 0.1 ml of the adipose tissue homogenate. All probes were diluted to the final protein concentration of 5µg/ml. The protein concentration was determined by the method of Lowry (Lowry et al., 1951) using bovine serum albumin as standard. The formation of dityrosines was evaluated by measuring the emission spectra (380–440 nm) at excitation wavelength 325 nm (slit width 5 nm) (Giulivi & Davies, 1994). Fluorescence emission spectra were measured in the range of 420–480 nm in order to determine the concentration of conjugates of lipid peroxidation products with free amino groups of proteins, primarily lysine (Lys-LPO) (Dousset et al., 1994). The excitation wavelength was 365 nm (slit width 5 nm). The concentration of oxidatively modified amino acids was expressed in relative fluorescent units (RFU). All fluorescence measurements were performed on Varian Cary Eclipse spectrofluorometer (Varian Inc., Australia) at 25 °C.
Chemiluminescence studies
The intensity of chemiluminescence was measured on Chemiluminomer-003 (Ufa, Russia) in order to assess the level of free radical oxidation processes in adipose tissue. Adipose tissue was homogenized in 20 volumes of isopropanol. An aliquot of 0.25 ml was added into the tube containing 4 ml of heptane-isopropanol solution (1:1). The probe (final volume 4.25 ml) was incubated for 20 minutes and after addition of 0.5 ml distilled water centrifuged at 3 000×g for 10 minutes. The upper heptane phase was pipetted for subsequent analysis since it is assumed that heptane extracts neutral lipids, which present the major lipid fraction of the adipocyte lipid drop. The final volume in the cuvette was 5 ml containing 4.9 ml of heptane-isopropanol mixture and 0.1 ml of the upper phase. After stabilization of the signal, the inductor FeSO4·7H2O was entered into the system. After induction of free-radical processes in the system, fast flash amplitude and general luminosity were recorded. Fast flash amplitude characterizes the intensity of reactive oxygen species generation as a response to Fe2+ addition and indirectly shows the concentration of hydroperoxides in serum. General luminosity serves as an indicator of free radical oxidation of biomolecules in serum. The intensity of chemiluminescence was expressed in conventional units (c.u.) of luminosity (Lopukhin et al., 1983).
Statistical analysis
The data were expressed as mean values ± SEM and evaluated using Mann-Whitney U-test at the significance level 2 alpha = 0.05.
Results
Weight gain and food consumption
Table 1 shows that the mass of all animals increased during the experiment. The intensity of weight gain during the first month was similar in the control and the experimental groups. By the end of the second month, the mean weight values of rats became relatively higher in all experimental groups compared to controls. The maximal weight gain was registered in animals obtaining the mixture of FeSO4·12H2O and CuSO4 in the respective concentrations of 3 mg/l and 4.88 mg/l. At the end of the experiment, the maximal weight gain was observed in rats obtaining 6 mg/l FeSO4·12H2O, 4.88 mg/l CuSO4, and the combination of FeSO4·12H2O and CuSO4 in the above mentioned concentrations.
Table 1.
Intensity of food consumption and weight gain in rats.
| No | Obtained chemical (mg/l) | Initial weight (g) | Food consumption during 1st month (g) | Weight after 1st month (g) | Food consumption during 2nd month (g) | Weight after 2nd month (g) | Food consumption during 3d month (g) | Weight after 3d month (g) | Total weight gain (g) |
|---|---|---|---|---|---|---|---|---|---|
| 1 | Control (–) | 173.0±1.8 | 18.63±0.81 | 237.8±1.8 | 18.33±0.43 | 284.4±1.9 | 19.15±0.55 | 291.6±1.7 | 118.6±2.3 |
| 2 | Fe2+ (3) | 172.5±4.5 | 19.85±1.40 | 236.7±4.9 | 18.89±0.40 | 285.9±6.5 | 19.33±0.78 | 292.0±8.1 | 119.5±4.6 |
| 3 | Fe2+ (6) | 176.8±1.9 | 18.50±1.21 | 239.1±4.0 | 18.91±0.62 | 294.0±7.0 | 19.54±1.46 | 302.6±6.0 | 125.8±6.7 |
| 4 | Cu+ (4.88) | 169.8±2.2 | 22.15±1.38 | 232.5±4.4 | 22.31±0.78* | 287.5±5.8 | 22.81±1.39 | 297.0±5.6 | 127.2±6.1 |
| 5 | Cu2+ (9.76) | 174.2±4.2 | 20.22±0.99 | 243.8±2.1 | 19.54±0.51 | 285.8±3.0 | 19.24±0.91 | 298.7±3.0 | 124.5±4.3 |
| 6 | Fe2+/Cu2+ (3/4.88) | 171.8±3.2 | 20.78±1.11 | 244.9±1.8 | 20.43±0.67 | 296.3±4.8 | 21.29±0.73 | 308.7±4.7* | 136.9±5.7* |
All data represented as Mean ± SEM
p < 0.05 vs control group of animals
Food consumption dynamics increased in animals receiving metals with drinking water during the experiment. The maximal food consumption was observed in rats obtaining water containing 4.88 mg/l CuSO4 and the combination of FeSO4·12H2O and CuSO4 in the respective concentrations of 3 and 4.88 mg/l.
Morphometric parameters of rats
Table 2 shows that the mean values of fat pad weight were higher in the experimental groups of animals than in controls. The maximal weight of fat pads was observed in animals receiving drinking water with 3 mg/l FeSO4·12H2O, 4.88 and 9.76 mg/l CuSO4, and the mixture of FeSO4·12H2O and CuSO4 in the above mentioned concentrations. In these groups the mean values of this parameter exceeded control values by 45–60%. BMI was relatively higher in the experimental groups than in controls but the difference was not significant.
Table 2.
Rat morphometric parameters.
| N2 | Obtained chemical (mg/l) | Fat pad weight (g) | Percentage of fat pad weight from body weight (%) | BMI |
|---|---|---|---|---|
| 1 | Control (–) | 4.97±0.13 | 1.70±0.04 | 0.65±0.01 |
| 2 | Fe2+ (3) | 7.50±0.51* | 2.62±0.12 * | 0.69±0.02 |
| 3 | Fe2+ (6) | 6.17±0.37 | 2.03±0.15 | 0.70±0.02 |
| 4 | Cu+ (4.88) | 7.43±0.27* | 2.50±0.13 * | 0.69±0.01 |
| 5 | Cu2+ (9.76) | 7.22±0.42 * | 2.41±0.12 * | 0.69±0.01 |
| 6 | Fe2+/Cu2+ (3/4.88) | 7.95±0.67 * | 2.57±0.21 * | 0.67±0.01 |
All data represented as Mean ± SEM
p<0.05 vs control group of animals
Iron and copper content in tissues
The obtained data in Table 3 show that the concentration of iron and copper in tissues depends on the incoming dose. The maximal concentration of iron in rat hair was observed in animals obtaining 6 mg/l iron with drinking water, exceeding control values by 20%. Iron content in groups of animals receiving 3 mg/l FeSO4·12H2O and the mixture of FeSO4·12H2O and CuSO4 in the above mentioned concentrations also exceeded the control group values, though this difference was not significant. Concentration of copper in hair was significantly higher in experimental animals receiving drinking water containing 9.76 mg/l of CuSO4 than in controls. It is important to mention that an increase of copper content in rat hair was observed in all experimental animals compared to controls, especially in animals receiving the metal mixture, although this increase was not significant.
Table 3.
Iron and copper content in hair and adipose tissue of rats.
| No | Obtained chemical (mg/l) | Concentration of metals in hair (µg/g) | Concentration of metals in adipose tissue (µg/g) | ||
|---|---|---|---|---|---|
|
| |||||
| Fe | Cu | Fe | Cu | ||
| 1 | Control (–) | 19.31±0.67 | 12.32±0.37 | 6.62±0.81 | 0.27±0.02 |
| 2 | Fe2+ (3) | 21.83±0.63 | 12.93±0.40 | 7.63±0.70 | 0.23±0.03 |
| 3 | Fe2+ (6) | 22.93±1.21* | 13.11±0.54 | 10.24±1.45* | 0.25±0.02 |
| 4 | Cu+ (4.88) | 19.79±0.31 | 13.54±1.01 | 8.28±2.29 | 0.27±0.06 |
| 5 | Cu2+ (9.76) | 18.67±2.11 | 13.77±0.27* | 8.75±0.97 | 0.24±0.02 |
| 6 | Fe2+/Cu2+ (3/4.88) | 21.14±2.40 | 14.25±1.14 | 7.06±0.36 | 0.27±0.02 |
All data represented as Mean ± SEM
p<0.05 vs control group of animals
As seen in Table 3, the most notable difference in the concentration of metals in adipose tissue was observed in the case of iron. In hair of animals receiving 6 mg/l FeSO4·12H2O with drinking water, the iron content in adipose tissue was significantly higher by 55% than in controls.. It is important to notice that in animals receiving 4.88 and 9.76 mg/l CuSO4, the concentration of iron in adipose tissue was higher than in controls by 25 and 32%, respectively, though the difference was not significant. In case of copper, no significant increase in adipose tissue was observed.
Oxidative stress markers in adipose tissue
As seen in Table 4, fluorescence of dityrosines in animals receiving drinking water containing iron in either concentration and in the combination of FeSO4·12H2O and CuSO4 exceeded control values by approximately 25%. Fluorescence of Lys-LPO was higher than in controls in all experimental groups, while the maximal fluorescence exceeded control values by 50% in animals obtaining 3 mg/l FeSO4·12H2O and CuSO4 in both concentrations.
Table 4.
Markers of oxidative stress in adipose tissue homogenates.
| N2 | Obtained chemical (mg/l) | Dityrosine, RFU | Lys-LPO, RFU | Fast flash amplitude (c. u.) | General luminosity (c. u.) |
|---|---|---|---|---|---|
| 1 | Control (–) | 0.79±0.06 | 0.59±0.04 | 0.66±0.03 | 1.66±0.05 |
| 2 | Fe2+ (3) | 1.00±0.05* | 0.95±0.09* | 1.75±0.27* | 2.17±0.12* |
| 3 | Fe2+ (6) | 0.97±0.09 | 0.67±0.12 | 0.73±0.03 | 1.83±0.09 |
| 4 | Cu+ (4.88) | 0.79±0.07 | 0.87±0.09* | 0.71±0.05 | 1.80±0.14 |
| 5 | Cu2+ (9.76) | 0.79±0.10 | 0.88±0.05* | 0.73±0.07 | 2.07±0.11* |
| 6 | Fe2+/Cu2+ (3/4.88) | 0.94±0.05* | 0.71±0.05* | 0.87±0.15 | 2.07±0.13* |
All data represented as Mean ± SEM
p<0.05 vs control group of animals
Mean values of chemiluminescent parameters were enhanced in groups of animals receiving metals. The maximal intensity of flash amplitude was observed in animals with drinking water containing the combination of FeSO4·12H2O and CuSO4 and FeSO4·12H2O in the concentration of 3 mg/l. In the last case a 3-fold increase in the fast flash amplitude was recorded. Mean values of general luminosity were also higher in the experimental groups than in controls. The maximal general luminosity was measured in adipose tissue of rats obtaining 3 mg/l of FeSO4·12H2O, 9.76 mg/l of CuSO4, and the combination of iron and copper. The data exceeded control values by 30, 25 and 25%, respectively.
Adipose tissue morphology
The histological evaluation of adipose tissue revealed lymphoid infiltration of parametrium in all experimental groups. It is important to mention that the intensity of lymphoid infiltration revealed practically no difference between research groups. The most representative control and experimental slices of adipose tissue are shown in Figure 1.
Figure 1.
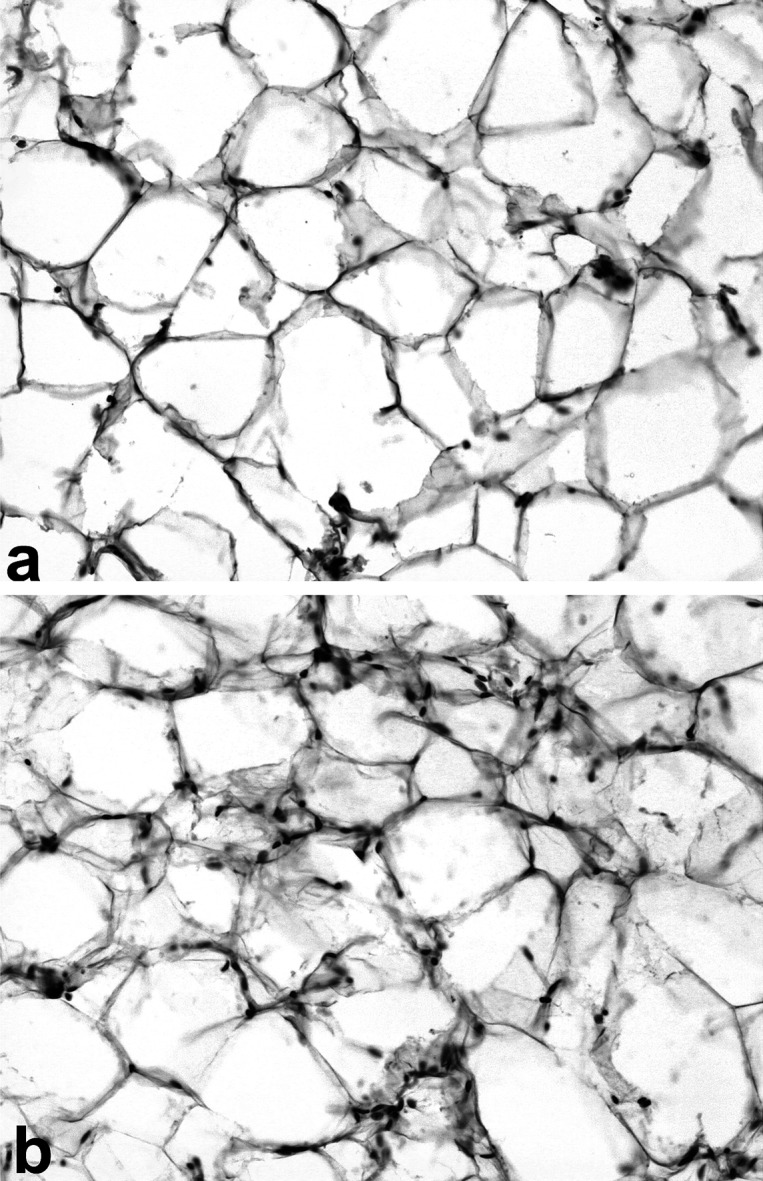
Histology of rat adipose tissue. Hematoxylin and eosin stains (×200). (a) adipose tissue of control rat. Only single lymphoid cells are present; (b) adipose tissue of rats obtaining FeSO4·12H2O and CuSO4 in respective concentrations of 3 and 4.88 mg/l. Lymphoid infiltration of adipose tissue is observed.
Discussion
The obtained data substantiate the following conclusions: i) consumption of iron and copper with drinking water led to excessive weight gain and increase of adipose tissue mass in comparison with control rats; ii) consumption of iron and copper with drinking water resulted in elevated levels of metals in rat hair; iii) entrance of metals into the organism led to iron accumulation in adipose tissue, whereas copper content in adipose tissue did not change; iv) on entering the organism, the above mentioned metals induced oxidative stress and inflammation in adipose tissue.
All the observed effects of metal consumption are undoubtedly the consequence of their cumulation in the organism. In case of single metal consumption, the concentrations of iron and copper in hair seem to depend on the dose of the incoming metal. In animals obtaining a combination of the above mentioned metals, a slight potentiation of cumulation was observed. Such an effect can be the consequence of copper and iron interaction during their intestinal absorption. This hypothesis is supported by several articles indicating enhanced iron absorption during copper repletion (Han and Wessling-Resnick, 2002) on the one hand, and by observations of iron deficiency induced by insufficient copper entrance (Reeves, 2004) on the other.
The mechanisms of the observed cumulation of iron in adipose tissue of all experimental animals, including copper-treated animals, require further investigations. Theoretically, such an effect can be the consequence of iron sequestration in adipose-tissue macrophages induced by obesity (Yanoff et al., 2007; Zekanowska et al., 2011).
The observed induction of oxidative stress by iron and copper is a consequence of their prooxidant features, which were shown and discussed in numerous works (Leonard et al., 2004; Jomova and Valko, 2011; Krasikov et al., 2011). Oxidative stress itself exhibits inadequate production of reactive oxygen species and their reactive metabolites (Durackova, 2011) leading to cell damage and consequently to several diseases (Aruoma, 1998; Pryor et al., 2006). Activation of free radical processes stimulates also the development of inflammation in adipose tissue and its growth (Martinez, 2006; Matsuzawa-Nagata et al., 2008). Inflammation is accompanied first by lymphoid and then by macrophagal infiltration in adipose tissue (Kintscher et al., 2008; Nishimura et al., 2009), leading to subsequent intensification of free radical processes (Fantone and Ward, 1982). On the other hand, there is evidence of orexigenic action of copper via stimulation of neuropeptide Y expression in the hypothalamus (Li et al., 2008). These data support our results indicating enhancement of food consumption and weight gain in rats obtaining copper. Potentiation of the above mentioned effects in case of combined consumption of copper and iron is possibly a consequence of two mechanisms acting simultaneously: orexigenic effect of copper and prooxidant effect of iron.
In conclusion, we showed that consumption of drinking water containing iron and copper led to intensified weight gain and increase in adipose tissue mass. Entrance of the metals tested into the organism resulted also in development of oxidative stress in fat pads that can be one of the mechanisms leading to increased adipose tissue mass. Yet elucidation of the delicate mechanisms of the observed effects of copper and iron call for further detailed investigations.
REFERENCES
- 1.Arsenescu V, Arsenescu RI, King V, Swanson H, Cassis LA. Polychlorinated biphenyl-77 induces adipocyte differentiation and proinflammatory adipokines and promotes obesity and atherosclerosis. Environ Health Perspect. 2008;116:761–768. doi: 10.1289/ehp.10554. [DOI] [PMC free article] [PubMed] [Google Scholar]
- 2.Aruoma OI. Free radicals, oxidative stress, and antioxidants in human health and disease, Journal of the American Oil Chemists. Society. 1998;75:199–212. doi: 10.1007/s11746-998-0032-9. [DOI] [PMC free article] [PubMed] [Google Scholar]
- 3.Baillie-Hamilton PF. Chemical toxins: a hypothesis to explain the global obesity epidemic. J Altern Complement Med. 2002;8:185–192. doi: 10.1089/107555302317371479. [DOI] [PubMed] [Google Scholar]
- 4.Caballero B. The global epidemic of obesity: An overview. Epidemiol Rev. 2007;29:1–5. doi: 10.1093/epirev/mxm012. [DOI] [PubMed] [Google Scholar]
- 5.Creason JP, Hinner TA, Bumgarner JE, Pinkerton C. Trace elements in hair, as related to exposure in metropolitan New York. Clin Chem. 1975;21:603–612. [PubMed] [Google Scholar]
- 6.Dongiovanni P, Ruscica M, Benedan L, Borroni V, Recalcati S, Steffani L, Passafaro L, Cairo G, Magni P, Gatti S, Fargion S, Valenti L. Dietary iron overload induces visceral adipose tissue insulin resistance and hyper-resistinemia, and synergizes with obesity and fatty liver in inducing systemic insulin resistance. Digestive and Liver Disease. 2011;43:97. [Google Scholar]
- 7.Dousset N, Ferretti G, Taus M, Valdiguie P, Curatola G. Fluorescence analysis of lipoprotein peroxidation. Methods Enzymol. 1994;233:459–469. doi: 10.1016/s0076-6879(94)33052-2. [DOI] [PubMed] [Google Scholar]
- 8.Durackova Z. Some current insights into oxidative stress. Physiol Res. 2010;59:459–469. doi: 10.33549/physiolres.931844. [DOI] [PubMed] [Google Scholar]
- 9.Evans JL, Goldfine ID, Maddux BA, Grodsky GM. Are oxidative stress-activated signaling pathways mediators of insulin resistance and beta-cell dysfunction? Diabetes. 2003;52:1–8. doi: 10.2337/diabetes.52.1.1. [DOI] [PubMed] [Google Scholar]
- 10.Fantone JC, Ward PA. Role of oxygen-derived free radicals and metabolites in leukocyte-dependent inflammatory reactions. Am J Pathol. 1982;107:395–418. [PMC free article] [PubMed] [Google Scholar]
- 11.Giulivi C, Davies KJ. Dityrosine: a marker for oxidatively modified proteins and selective proteolysis. Methods Enzymol. 1994;233:363–371. doi: 10.1016/s0076-6879(94)33042-5. [DOI] [PubMed] [Google Scholar]
- 12.Grimsrud PA, Picklo MJSr, Griffin TJ, Bernlohr DA. Carbonylation of adipose proteins in obesity and insulin resistance: identification of adipocyte fatty acid-binding protein as a cellular target of 4-hydroxynonenal. Mol Cell Proteomics. 2007;6:624–637. doi: 10.1074/mcp.M600120-MCP200. [DOI] [PubMed] [Google Scholar]
- 13.Han O, Wessling-Resnick M. Copper repletion enhances apical iron uptake and transepithelial iron transport by Caco-2 cells. Am J Physiol Gastrointest Liver Physiol. 2002;282:527–533. doi: 10.1152/ajpgi.00414.2001. [DOI] [PubMed] [Google Scholar]
- 14.Irigaray P, Ogier V, Jacquenet S, Notet V, Sibille P, Méjean L, Bihain BE, Yen FT. Benzo[a]pyrene impairs beta-adrenergic stimulation of adipose tissue lipolysis and causes weight gain in mice. A novel molecular mechanism of toxicity for a common food pollutant. FEBS J. 2006;273:1362–1372. doi: 10.1111/j.1742-4658.2006.05159.x. [DOI] [PubMed] [Google Scholar]
- 15.James WP. WHO recognition of the global obesity epidemic. Int J Obes (London) 2008;32:120–126. doi: 10.1038/ijo.2008.247. [DOI] [PubMed] [Google Scholar]
- 16.Jomova K, Valko M. Advances in metal-induced oxidative stress and human disease. Toxicology. 2011;283:65–87. doi: 10.1016/j.tox.2011.03.001. [DOI] [PubMed] [Google Scholar]
- 17.Kintscher U, Hartge M, Hess K, Foryst-Ludwig A, Clemenz M, Wabitsch M, Fischer-Posovszky P, Barth TF, Dragun D, Skurk T, Hauner H, Blüher M, Unger T, Wolf AM, Knippschild U, Hombach V, Marx N. T-lymphocyte infiltration in visceral adipose tissue: a primary event in adipose tissue inflammation and the development of obesity-mediated insulin resistance. Arterioscler Thromb Vasc Biol. 2008;28:1304–1310. doi: 10.1161/ATVBAHA.108.165100. [DOI] [PubMed] [Google Scholar]
- 18.Krasikov SI, Tinkov AA, Sharapova NV, Bogatov MA. The nonlinear dependence between administered pro-oxidant doses and intensity of free-radical processes observed in rats. J Appl Biomed. 2011;9:219–224. [Google Scholar]
- 19.Leonard SS, Harris GK, Shi X. Metal-induced oxidative stress and signal transduction. Free Radic Biol Med. 2004;37:1921–1942. doi: 10.1016/j.freeradbiomed.2004.09.010. [DOI] [PubMed] [Google Scholar]
- 20.Li J, Yan L, Zheng X, Liu G, Zhang N, Wang Z. Effect of high dietary copper on weight gain and neuropeptide Y level in the hypothalamus of pigs. J Trace Elem Med Biol. 2008;22:33–38. doi: 10.1016/j.jtemb.2007.10.003. [DOI] [PubMed] [Google Scholar]
- 21.Lopukhin YM, Vladimirov YA, Molodenkov MN. Registration of serum constituents in presence of iron (In Russian) Bull Exp Biol Med. 1983;95:61–63. [Google Scholar]
- 22.Lowry OH, Rosebrough NJ, Farr AL, Randall RJ. Protein measurement with the folin phenol reagent. J Biol Chem. 1951;193:265–275. [PubMed] [Google Scholar]
- 23.Martínez JA. Mitochondrial oxidative stress and inflammation: a slalom to obesity and insulin resistance. J Physiol Biochem. 2006;62:303–306. doi: 10.1007/BF03165759. [DOI] [PubMed] [Google Scholar]
- 24.Matsuzawa-Nagata N, Takamura T, Ando H, Nakamura S, Kurita S, Misu H, Ota T, Yokoyama M, Honda M, Miyamoto K, Kaneko S. Increased oxidative stress precedes the onset of high-fat diet-induced insulin resistance and obesity. Metabolism. 2008;57:1071–1077. doi: 10.1016/j.metabol.2008.03.010. [DOI] [PubMed] [Google Scholar]
- 25.Mullerova D, Kopecky J. White adipose tissue: storage and effector site for environmental pollutants. Physiol Res. 2007;56:375–381. doi: 10.33549/physiolres.931022. [DOI] [PubMed] [Google Scholar]
- 26.Nadal-Casellas A, Proenza AM, Gianotti M, Llad I. Brown adipose tissue redox status in response to dietary-induced obesity-associated oxidative stress in male and female rats. Stress. 2011;14:174–184. doi: 10.3109/10253890.2010.524681. [DOI] [PubMed] [Google Scholar]
- 27.Nishimura S, Manabe I, Nagasaki M, Eto K, Yamashita H, Ohsugi M, Otsu M, Hara K, Ueki K, Sugiura S, Yoshimura K, Kadowaki T, Nagai R. CD8+ effector T cells contribute to macrophage recruitment and adipose tissue inflammation in obesity. Nat Med. 2009;15:914–20. doi: 10.1038/nm.1964. [DOI] [PubMed] [Google Scholar]
- 28.Novelli EL, Diniz YS, Galhardi CM, Ebaid GM, Rodrigues HG, Mani F, Fernandes AA, Cicogna AC, Novelli Filho JL. Anthropometrical parameters and markers of obesity in rats. Lab Anim. 2007;41:111–119. doi: 10.1258/002367707779399518. [DOI] [PubMed] [Google Scholar]
- 29.Pryor WA, Houk KN, Foote CS, Fukuto JM, Ignarro LJ, Squadrito GL, Davies KJ. Free radical biology and medicine: it's a gas, man! Am J Physiol Regul Integr Comp Physiol. 2006;291:491–511. doi: 10.1152/ajpregu.00614.2005. [DOI] [PubMed] [Google Scholar]
- 30.Reeves PG, Demars LC, Johnson WT, Lukaski HC. Dietary copper deficiency reduces iron absorption and duodenal enterocyte hephaestin protein in male and female rats. J Nutr. 2005;135:92–98. doi: 10.1093/jn/135.1.92. [DOI] [PubMed] [Google Scholar]
- 31.Suzuki K, Ito Y, Ochiai J, Kusuhara Y, Hashimoto S, Tokudome S, Kojima M, Wakai K, Toyoshima H, Tamakoshi K, Watanabe Y, Hayakawa N, Maruta M, Watanabe M, Kato K, Ohta Y, Tamakoshi A. Relationship between obesity and serum markers of oxidative stress and inflammation in Japanese. Asian Pac J Cancer Prev. 2003;4:259–266. [PubMed] [Google Scholar]
- 32.Tajima S, Ikeda Y, Sawada K, Yamano N, Horinouchi Y, Kihira Y, Ishizawa K, Izawa-Ishizawa Y, Kawazoe K, Tomita S, Minakuchi K, Tsuchiya K, Tamaki T. Iron reduction by deferoxamine leads to amelioration of adiposity via the regulation of oxidative stress and inflammation in obese and type 2 diabetes KKAy mice. Am J Physiol Endocrinol Metab. 2012;302:77–86. doi: 10.1152/ajpendo.00033.2011. [DOI] [PubMed] [Google Scholar]
- 33.Yanoff LB, Menzie CM, Denkinger B, Sebring NG, McHugh T, Remaley AT, Yanovski JA. Inflammation and iron deficiency in the hypoferremia of obesity. Int J Obes (Lond) 2007;31:1412–1419. doi: 10.1038/sj.ijo.0803625. [DOI] [PMC free article] [PubMed] [Google Scholar]
- 34.Zekanowska E, Boinska J, Giemza-Kucharska P, Kwapisz J. Obesity and iron metabolism. Biotechnologia. 2011;92:147–152. [Google Scholar]