Abstract
The paper describes technological advances in high-field (7 T) transceiver-phased arrays developed for magnetic resonance imaging of the human brain. The first part of this work describes an 8-element inductively decoupled split elliptical transceiver-phased array with selectable geometry, which provides an easy and efficient way of compensating for changes in mutual inductive coupling associated with difference in loading due to variability in head shape and size. The second part of the work describes a double-row 16-element (2 × 8) transceiver array to extend the homogeneous transmit B1 profile in the longitudinal direction. Multiplexing eight transmit channels between the two rows of the array provides homogeneous excitation over the entire volume. The final section describes design and construction of a double-tuned 31P/1H 16-element (8 at each frequency) array. The array improves transmission efficiency and B1 homogeneity at 1H frequency in comparison with 31P/1H quadrature transverse electromagnetic volume coil. For 31P studies, the array also improves transmission efficiency (38%), signal-to-noise ratio (SNR) for central brain locations (20%) and provides substantially greater SNR (up to 400%) for peripheral locations.
1 Introduction
Despite the availability of 7 T systems dating from late 1990s, their use in clinical applications has been slowed by technical hurdles associated with detector design. This limitation is due to a variety of factors including both increased inhomogeneity of the transmit radio-frequency (RF) magnetic field, B1, produced by conventional head-sized quadrature transmit volume coils and increased power requirements to achieve similar B1s [1–4]. For example, more than 50% variation of the transmit B1 field over axial slices located near the center of a human head has been reported [1, 4]. In the longitudinal direction (along the coil axis), volume coils also produce very inhomogeneous B1 distribution with enhanced RF field near the coil’s center and substantially weaker field toward the edges. Extending longitudinal coverage of the head volume coils at 7 T presents certain challenges. A simple increase of the coil length may not substantially increase the longitudinal coverage. For example, Nabetani et al. [5] demonstrated that for two head-sized birdcage volume coils of similar diameter but substantially different length (15 and 23 cm), the longitudinal coverage was essentially identical. In addition to the increase in inhomogeneity, Vaughan [1] also reported that the power required to achieve equivalent transmit B1 was ~4 times higher for conventional transverse electromagnetic (TEM) designs at 7 T in comparison with 4 T. To overcome this limitation substantial effort has been focused on the development of alternate RF coil designs, including transceiver-phased arrays [6–9]. Transceiver-phased arrays consist of multiple RF antennas decoupled from each other and used independently but simultaneously during both transmission and reception. It has been demonstrated both experimentally and theoretically that improved transmit B1 homogeneity and performance (B1 generated per unit of power) can be achieved with transceiver-phased arrays when combined with RF shimming [6, 8–11]. The latter term describes a procedure of varying driving phases and amplitudes of individual antennas to obtain optimal array performance for each subject. In this method driving phases and amplitudes after optimization are fixed and not varied in time.
The transmit B1 amplitude value achieved at a given power level in a transceiver array can be increased by making the array to conform more closely to the head [8]. Similarly, tighter fit can improve signal-to-noise ratio (SNR) during reception. However, changing the relative position of the coil elements to modify the size of the coil along with changes in loading associated with different head sizes alters the mutual inductive coupling between the array’s elements. Failure to adequately compensate for the changes in inductive coupling between the elements distorts the spatial profiles of the transmit B1 from individual coils and decreases the array transmission performance [12].
In this work, we describe (1) an 8-element (1 × 8) 7 T inductively decoupled split elliptical transceiver-phased array with selectable geometry, which provides an easy and efficient way of compensating for changes in mutual inductive coupling associated with difference in loading due to variability in head shape and size [13, 14]; (2) RF shimming method of optimizing driving phases and amplitudes to improve coil homogeneity and transmission performance [9]; (3) a double-row 16-element (2 × 8) transceiver array to extend the homogeneous transmit B1 profile in the longitudinal direction (three-dimensional (3-D) RF shimming) [15]; and (4) a double-tuned 31P/1H 7 T 16-element (8 at each frequency) transceiver array [16].
An important common feature of all transceiver arrays described below, examples of which are presented in Fig. 1, is inductive decoupling of individual elements. The use of inductive decoupling eliminates the need for fixed electrical connections between individual coils which allows the array to be split into multiple sections (in these examples two, top and bottom sections). The use of multiple sections to form the array in turn allows the array’s geometry to be manipulated by simply combining different sections which enables the overall array size to be configured to better conform to the head, thereby improving performance.
Fig. 1.
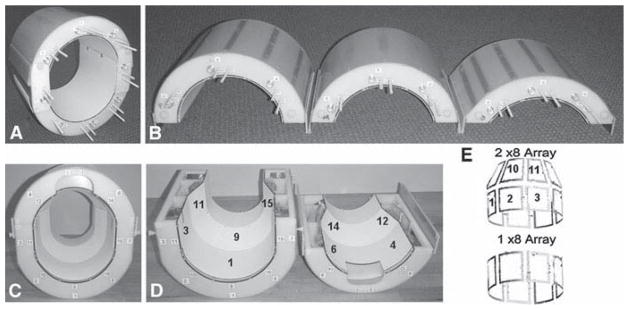
a Back view of the elliptical 8-channel (1 × 8) split transceiver-phased array. The bottom part is shown assembled with the medium size top. b Three tops of the split array. Front view of the assembled (c) and disassembled (d) elliptical 16-channel (2 × 8) split transceiver-phased array. e Schematic presentation of the 8- and 16-channel transceiver arrays. d and e Numbering of the individual surface coils in the first (1 through 8) and the second (9 through 16) rows
2 8-Channel (1 × 8) Elliptical Transceiver-Phased Array
2.1 Array Design
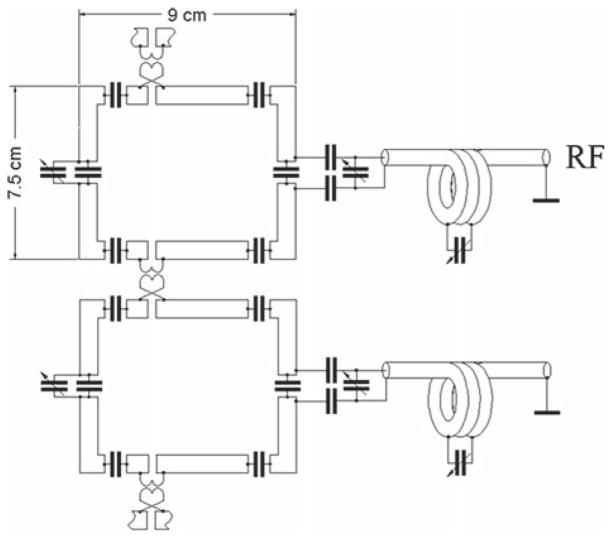
The transceiver-phased array consisted of eight evenly spaced rectangular surface coils circumscribing the head at ~45° increments [13]. Figure 2 presents schematics of the individual surface coil. For simplicity only two of the coils are shown. Each surface coil was formed from copper tape (width, 6.4 mm), with six or eight capacitors ranging from 8 to 12 pF (100C series, American Technical Ceramics, Huntington Station, NY, USA) distributed uniformly along the coil’s length. All the coils were individually tuned and matched using variable capacitors (Voltronics, Denville, NJ, USA). To prevent wave propagation on the cable shield, a trap balun grounded to the array shield was used. All adjacent surface coils were decoupled inductively using a pair of loops (diameter, ~12 mm) connected in series with each surface coil (Fig. 2) [17]. The size of the loops was experimentally chosen in such a way that when maximally coupled (closest distance to each other) they produce inductive coupling slightly greater than the mutual coupling between the adjacent surface coils in the array. The coupling between the loops was then adjusted by bending the loops away from each other, thereby decreasing their inductive coupling. With a spherical phantom (diameter, 16 cm; 80 mM NaCl), which loaded coils similarly to a human head at 7 T [18], decoupling of at least −16 dB between the adjacent coils was achieved. Decoupling between all other nonadjacent coils was similar or better than that achieved between adjacent coils. After adjusting the coil decoupling on the phantom it was then verified on human heads and further adjusted if necessary.
Fig. 2.
Schematic of two elements of the 8-element (1 × 8) transceiver-phased array
To better conform to the human head, the phased array had an “elliptical” shape. To bring the side surface coils closer to the head, two vertical straight pieces (width of one surface coil) (Fig. 1a) were introduced between two half-cylindrical sections. These two straight pieces were permanently connected to the bottom half-cylinder. To improve patient access the phased array was split in two parts with the bottom section consisting of five surface coils and the top portion of three coils. Due to “through-space” inductive decoupling no electrical connection between the two portions of the array was required. To accommodate different head sizes/shapes three different array tops (Fig. 1b) were constructed allowing the array’s height to be varied (21, 23 and 25 cm). The width for all three combinations was 19.5 cm. All of the surface coils had the same length along the axis of the main field B0 (9 cm). Surface coils in the bottom section and medium top (height, 23 cm) measured 9 × 7.4 cm2 with a gap between the coils of 1.3 cm. Surface coils and gaps in the smaller and larger tops measured 9 × 6.5 cm2/1.1 cm gap and 9 × 8.2 cm2/1.5 cm gap, respectively.
To evaluate the advantages of the elliptical symmetry we also built a circular (diameter, 25 cm) nonsplit phased array with eight surface coils (9 × 8 cm2) of the same length as the elliptical array [9]. To decrease radiation losses and improve the performance, arrays were shielded (length, 21 cm) using a 50-μm polyamide film with a 5-μm copper layer [19, 20]. The thickness of the copper layer is slightly larger than the skin depth at 298 MHz (1H frequency at 7 T) which preserves the unloaded Q-factor, QU, while suppressing gradient eddy currents [19]. The shield, located 4 cm away from the surface coils, decreased radiation losses (QU increased from 220 to 350 after placement of the shield). Loaded and unloaded Q-factors of the surface coils were measured from the absolute value of the S11 reflection coefficient as twice the ratio of the resonance frequency over the 3-dB bandwidth when the coils were tuned and matched [21].
2.2 Spectrometer
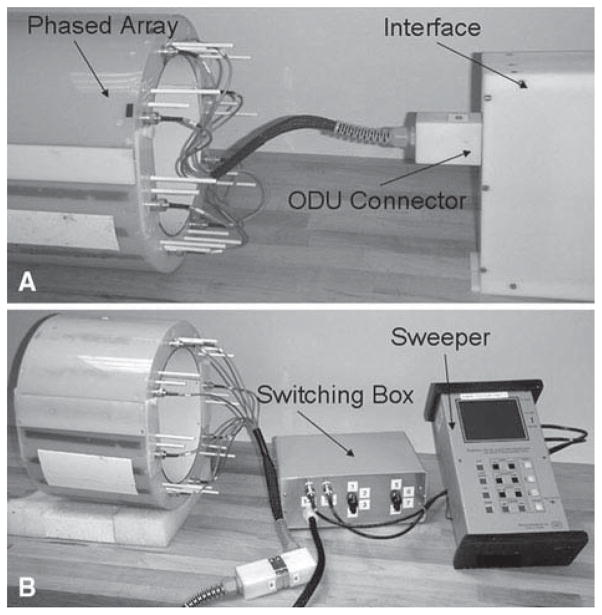
All data were acquired with a Varian Direct Drive system (Palo Alto, CA, USA) and a head-only (inner diameter, 68 cm) actively shielded 7 T magnet. For the transceiver array studies, eight fully independent transmit channels were used to drive eight 1 kW RF amplifiers. An interface was constructed to provide RF power to each of the eight surface coils during transmission and to connect the coils to preamplifiers during reception. The interface (Fig. 3a) contained eight preamplifiers (Advanced Receiver Research, Burlington, CT, USA) and eight homebuilt transmit/receive (T/R) positive–intrinsic–negative (PIN) diode switches, each capable of handling 1 kW of RF. The T/R switches were constructed using lump-element quarter-wavelength transformers and provided greater than 50 dB of isolation and less than 0.2 dB of insertion loss. A PIN diode driver was also constructed to provide 50–100 mA per diode. During the experiment the interface was placed into the magnet bore in front of the phased array (Fig. 3a) to minimize the cable length. To simplify the array tuning and matching procedure we constructed a switching box similarly as described previously by Strupp et al. [22] (Fig. 3b). Connection of the array to the interface or to the switching box was provided using multi-cable connectors (ODU-USA, Camarillo, CA, USA) combining all eight cables into a single connector (Fig. 3).
Fig. 3.
a View of the transceiver array connected to the interface with the 8-channel multi-cable connector homebuilt using ODU modules. b View of the array and the sweeper both connected to the switching box during tuning and matching procedure. The box contains mechanical RF switches allowing sequential connection of each surface coil to the sweeper to simplify the tuning and matching procedure
2.3 B1 Optimization Procedure (RF Shimming)
To optimize the transmission performance and homogeneity of the coil, an RF shimming method was used to determine the amplitude and phases of the RF applied to each coil [9]. To simplify the notation we used B1 to represent the transmission field in place of . The B1 generated at any given point within the sample from a set of n independent RF coils driven simultaneously can be expressed as
| (1) |
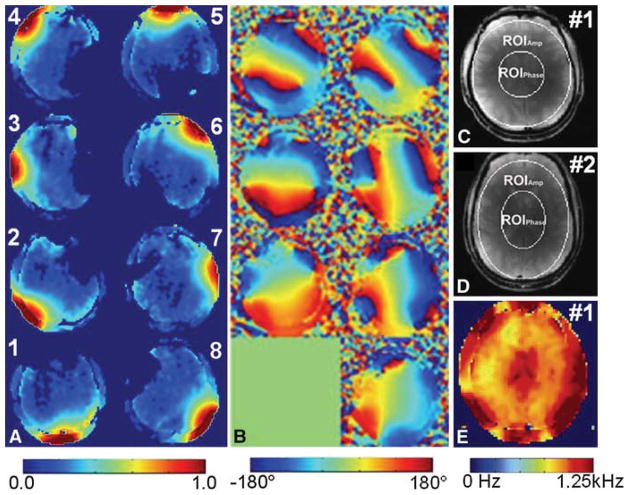
where the amplitude B1j(r) and phase Φj(r) are both functions of spatial coordinates determined by coil geometry and loading conditions, and aj and Φ0j are amplitude scaling and phase parameters set by the user. RF shimming and B1 optimization are achieved by varying aj and Φ0j. Complex B1 maps (phase and amplitude) of the individual coils (single coil transmitting) or the combined array (all coils transmitting simultaneously) were acquired using a double-excitation method [23]. An example of experimentally measured B1 maps (phase and amplitude) is shown in Fig. 4a, b. For these studies, the B1 maps used a target B1 of 1 kHz (23.5 μT) and a nominal excitation pulse of 60°. After selecting a target slice using default parameters (equal power with incremental 45° phase shifts), the B1 of each coil was mapped with each coil transmitting separately. Based on experimentally measured phase maps, the RF phases for each coil, Φ0j, were calculated to maximize the B1 over an elliptical region of interest ~60–80 mm, Fig. 4c, d) at the center of the brain, . Thus, within the central ROI, the B1 fields of the individual coils add constructively, optimizing performance. Using these phases the amplitudes, aj, were numerically optimized over the second ROI (ROIAmp ~120–160 mm, Fig. 4c, d) encompassing the majority of the brain within the slice using a least-square algorithm to optimize homogeneity. The second B1 map was then acquired with all coils transmitting simultaneously to verify achievement of the target performance (Fig. 4e). Previously we demonstrated that simultaneous numerical optimization of both the phases and amplitudes of the individual coils over the larger ROI, ROIAmp provides a small improvement in homogeneity (reduction of the standard deviation (SD) of the B1 over ROIAmp from ~10 to 8%) at the cost of ~20% increase in the RF power required to achieve the same B1 [9]. Thus, this method which maximizes constructive interference in the center of the coil provides improved transmission performance (B1/watt) while retaining good homogeneity.
Fig. 4.
a Amplitude and b phase transmit B1 maps of individual surface coils of the 8-channel transceiver array. c Axial images demonstrating corresponding ROIAmp and ROIPhase used in the RF shimming procedure for subjects #1 (c) and #2 (d). e B1 map of the same slice shown in c obtained after RF shimming. Amplitude B1 map in e is presented in kHz. The B1 map images were acquired at 64 × 64 resolution over a field of view (FOV) of 192 × 192 mm2 using a 2 mm slice thickness
2.4 8-Channel Array Performance
To demonstrate the importance of the elliptical geometry of the array we compared the performance of all four arrays (elliptical with three tops and the circular) on two subjects [13]. While subject #1 (female, Fig. 4c) was able to fit in all four arrays, subject #2 (male, Fig. 4d) could not fit in the smallest array. Since the transmission performance and homogeneity varies upon the location of an axial slice we compared the array performance for the same specific location shown in Fig. 4c, d. Results are presented in Table 1. After RF shimming the standard deviation of the B1 field over ROIAmp varied from 9 to 13% for all four arrays for both subjects (Table 1). Thus, the achieved homogeneity was largely independent of the array configuration used. Although the B1 homogeneity after RF shimming was similar for all of the array combinations they required substantially different RF power to produce the same average B1 value over ROIAmp. The elliptical arrays with closest fit for both subjects required ~40% less power than the circular array.
Table 1.
Combined RF power required for 1 kHz of B1, B1 (averaged over ROIAmp), standard deviation (SD) in the B1 value over ROIAmp for subjects #1 and 2
| Subject | 1 | 2 |
|---|---|---|
| Small top | ||
| Powera (kW) | 1.41 | – |
| 19.78 | – | |
| SD (%) | 10.4 | – |
| Medium top | ||
| Powera (kW) | 1.57 | 1.63 |
| 18.75 | 18.40 | |
| SD (%) | 9.7 | 11.1 |
| Large top | ||
| Powera (kW) | 1.81 | 1.94 |
| 17.46 | 16.86 | |
| SD (%) | 10.0 | 11.3 |
| Circular array | ||
| Powera (kW) | 1.92 | 2.33 |
| 16.95 | 15.39 | |
| SD (%) | 9.4 | 13.9 |
Power required producing average B1 of 1 kHz over ROIAmp
Averaged over ROIAmp
The dependence of achievable B1 homogeneity and transmission performance on the location of an axial slice was studied on large number of subjects with variety of head sizes and shapes [14]. Since all these examples were taken from ongoing clinical and research studies all the data were obtained using optimal arrays with the tightest fit. Table 2 summarizes the performance data and includes (1) the transmission performance evaluated as power (kW) required to generate a mean B1 value of 1 kHz over ROIAmp, (2) the mean B1 value at 1 kW of power (μT/kW) over ROIAmp, and (3) the homogeneity presented as a SD (%) of the B1 over ROIAmp. The data are grouped according to the array size used (small, medium and large) and brain location. The grouped brain locations include: (1) a superior location about the motor cortex and supplementary motor area (SMA); (2) an intermediate position, about the centrum semiovale and thalami; and (3) an inferior location which was steeply angulated along the temporal lobe including the hippocampi and medial temporal lobe (MTL). Figure 5 demonstrates different areas and how ROIAmp and ROIPhase were selected for different brain locations. Increased RF power and decreased homogeneity were observed for all arrays as the target slice was moved in the caudal (superior-to-inferior) direction. Although the homogeneity varies by brain location, within a given location, independent of which coil top is used, the achieved homogeneity is similar. This suggests that the overall homogeneity is largely determined by the brain location and angulation used (i.e., the relationship of the selected ROI to the coil geometry), while the size of the coil determines the required power.
Table 2.
Combined RF power required for 1 kHz of B1, B1 (averaged over ROIAmp), and standard deviation (SD) in the B1 value over the ROIAmp for different brain locations for 100 subjects
| Coil size | na | Location
|
||||||
|---|---|---|---|---|---|---|---|---|
| Motor and SMA
|
CSO and Thal
|
Temporal
|
||||||
| Powerb (kW) | n | Powerb (kW) | n | Powerb (kW) | ||||
| Small | 11 | 1.51 ± 0.38 | 13 | 1.70 ± 0.38 | 2 | 2.05 ± 0.05 | ||
| Medium | 11 | 1.81 ± 0.29 | 35 | 2.22 ± 0.38 | 14 | 2.59 ± 0.53 | ||
| Large | 0 | 6 | 2.28 ± 0.75 | 8 | 3.26 ± 0.57 | |||
|
| ||||||||
| Coil size | n | Location
|
||||||
| Motor and SMA
|
CSO and Thal
|
Temporal
|
||||||
|
|
n |
|
n |
|
||||
|
| ||||||||
| Small | 11 | 19.49 ± 0.66 | 13 | 18.30 ± 1.97 | 2 | 16.37 ± 0.19 | ||
| Medium | 11 | 17.68 ± 1.57 | 35 | 15.95 ± 1.37 | 14 | 14.82 ± 1.42 | ||
| Large | 0 | 6 | 14.58 ± 2.14 | 8 | 13.14 ± 1.10 | |||
|
| ||||||||
| Coil size | n | Location
|
||||||
| Motor and SMA
|
CSO and Thal
|
Temporal
|
||||||
| SD (%) | n | SD (%) | n | SD (%) | ||||
|
| ||||||||
| Small | 11 | 8.58 ± 1.84 | 13 | 10.27 ± 1.64 | 2 | 18.89 ± 1.77 | 26 | |
| Medium | 11 | 9.01 ± 2.25 | 35 | 11.41 ± 2.39 | 14 | 18.77 ± 2.61 | 60 | |
| Large | 0 | 6 | 11.23 ± 1.54 | 8 | 18.21 ± 1.43 | 14 | ||
| 22 | 54 | 24 | 100 | |||||
n indicates the number of subjects
Power required producing average B1 of 1 kHz over ROIAmp
Averaged value over the ROIAmp
Fig. 5.
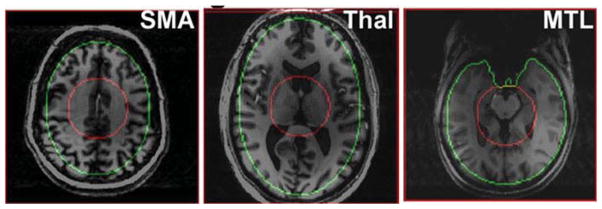
Axial images demonstrating characteristic area of the brain locations (cranial to caudal) with corresponding ROIAmp and ROIPhase used in the RF shimming procedure. These areas are used to group data shown in Table 2
The combination of an elliptical split transceiver-phased array with a selected geometry and inductive decoupling allows the coil geometry to be adjusted to optimize performance without the need to readjust decoupling between elements. In instances where the next largest size was required (e.g., medium versus small top) for reasons other than head size, isolation still was maintained at a level of approximately −14 dB or better. Thus, this design provides a simple and efficient method to obtain good decoupling for different head sizes and shapes without the need to adjust the decoupling on a subject-by-subject basis. Although one could easily increase the number of tops available, and thereby further minimize the loading variations for a given coil top, the choice of three array tops with incrementing sizes of 2 cm provides relatively consistent performance for a given brain location across a range of subjects (Table 2).
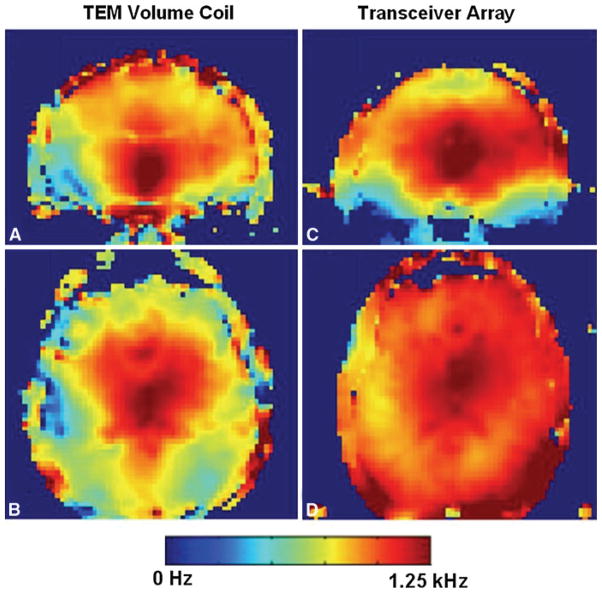
Figure 6 compares the B1 maps acquired using the elliptical array with the small top and a 17-cm-long TEM volume coil [1, 4] from the same subject. The maps were acquired using an equivalent applied total power level for both coils. Over the axial slice through the ventricles (center of the coils) the array achieved a mean value of 1.01 ± 0.09 kHz at 1.37 kW. Over the same slice and at equivalent power, the TEM achieved 0.71 ± 0.12 kHz. Homogeneity evaluated as SD over the entire brain within the slice measured 9 and 17% for the array and TEM, respectively. In comparison with the TEM, the absolute strength of B1 at equivalent power generated by the array is substantially greater over central brain regions and the majority of the cerebrum. Because the array is shorter than the TEM coil, the B1 homogeneity (and sensitivity) along the longitudinal axis (superior–inferior) of the array decreases more significantly away from the central brain region. Although the coil’s location relative to the center of the head can be positioned (prior to starting the study) to target or include these brain regions, increased B1 coverage in the longitudinal direction without significant decreases in performance would be desirable. At high field (≥7 T), a simple increase of the coil length may not substantially increase the longitudinal coverage [5], but would also reduce coil efficiency considerably. Therefore, to extend the longitudinal RF field distribution while maintaining the overall transmission performance of the coil, different approaches are required including a set of smaller surface coils extended in longitudinal direction with the 3D RF shimming applied.
Fig. 6.
a Coronal and b axial B1 maps acquired from the TEM volume coil. c and d Corresponding B1 maps acquired using an 8-element (1 × 8) transceiver array
3 Double-Row 16-Channel (2 × 8) Transceiver-Phased Array
3.1 Array Design
To improve longitudinal coverage we have developed an inductively decoupled 16-coil elliptical transceiver array (Fig. 1c, d), with the individual surface coils arranged in two rows along the z-axis of eight coils each (2 × 8 array) [15]. Each row measured ~7 cm in length with the total length of the array being equal to 15 cm. The array measured 19.5 cm in width and 22 cm in height. To better conform to the head shape the array was tapered with the superior row tilted by 19° (Fig. 1c–e). To decrease radiation losses the array was shielded with the shield positioned at 4 cm distance from the surface coils [20]. The 2 × 8 array was split (Fig. 1c, d) into two sections with the bottom section carrying ten surface coils and the top section—six coils. Similarly to the single-row (1 × 8) phased array the individual surface coils were constructed from copper tape (width, 6.4 mm), with six capacitors ranging from 8 to 10 pF distributed uniformly along the coil’s length. Schematics of the individual coils were very similar to that shown in Fig. 2. Each surface coil was individually tuned and matched and inductively decoupled from the adjacent coils using a pair of electrically connected small decoupling loops (Fig. 2). In addition, surface coils located diagonally in two different rows (for example, coil pairs #2,11 or #3,10 as shown in Fig. 1d, e) were decoupled using small insulated loops (~2 × 2 cm) strongly inductively coupled to the corresponding surface coils and connected with each other using a short coaxial cable. As a result decoupling of −14 dB or better between the surface coil was achieved with the majority of the S12 values being −20 dB or better.
3.2 “Multiplexing” of the Transmit Channels
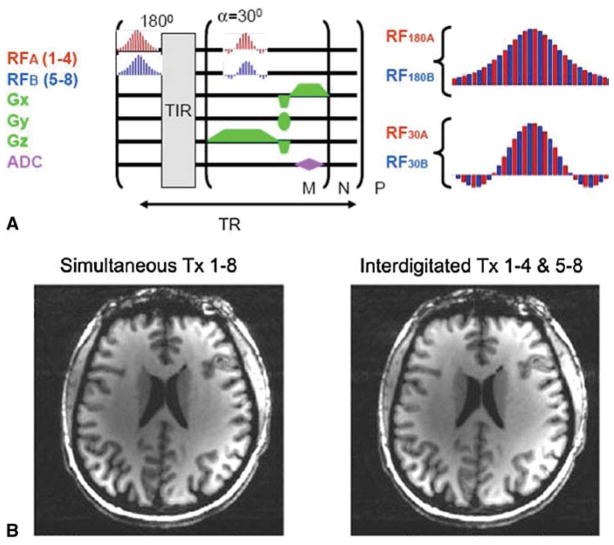
Although most human magnetic resonance (MR) systems are equipped with 16 or more independent receivers, they are typically equipped with eight (or fewer) individual transmit channels. To overcome this problem RF channels 1 through 8 were alternately routed (every 10 μs) to coils 1–8 (superior row) or 9–16 (inferior row) using a set of eight homebuilt high-speed single-pole double-throw (SPDT) switches (0.6 kW, switching time of ~0.5 μs) during each RF pulse [24]. As a result RF waveforms for all pulses were “multiplexed” to achieve performance near equivalent to true simultaneous transmission [24]. Since during the “multiplexed” pulse, only half of time (ignoring the switching time) is dedicated to coils 1–8, the B1 amplitude of each 10-μs sub-pulse needs to be doubled, and hence the RF power needs to be increased by 4 to produce the same flip angle and to keep the total pulse width unchanged. Generally the amount of total deposited power depends upon the extent of constructive and destructive interference of the electric fields of the individual coils being multiplexed. However, for highly constructive distributions [24, 25], the overall RF power deposited can be nearly identical to a true simultaneous 16-channel transmit system. Figure 7 demonstrates an example showing that smaller number of transmit channels (4 in this case) can be used to drive eight individual coils in the single-row (1 × 8) transceiver array described above. In this case 4 transmit channels were switched between coils 1–4 and 5–8 every 10 μs as shown in Fig. 7a. Images obtained using either interdigitating of four RF channels or full eight channels are practically indistinguishable (Fig. 7b).
Fig. 7.
a Pulse sequence used for multiplexing the transmit channels with RF applied to coils 1–4 and coils 5–8. b Axial images of the same slice obtained by interdigitating the transmit channels (right) or using them simultaneously (left)
3.3 16-Channel (2 × 8) Array Performance
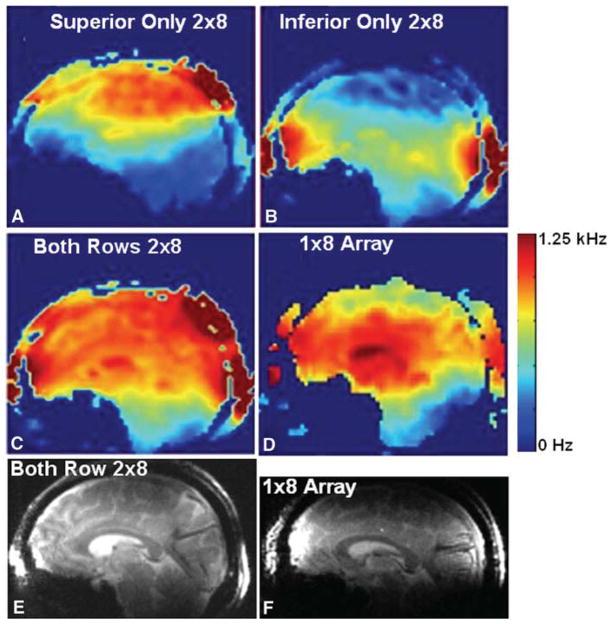
Displayed in Fig. 8 are sagittal B1 maps acquired with the 2 × 8 array using only the superior row (Fig. 8a), inferior row (Fig. 8b), four coils simultaneously from each row (Fig. 8c), or the 1 × 8 array (Fig. 8d). For these measurements the 1 × 8 array was positioned with its center (along the z-axis) to match the center of the 2 × 8 array (gap between the inferior and superior rows). When both rows are driven simultaneously, both homogeneity and coverage of the brain are dramatically improved. Comparing the transmission performance of the arrays, the superior and inferior rows of the 2 × 8 array achieved 1 kHz of B1, at 1.27 and 2.20 kW, respectively, similar to 1.19 and 2.07 kW required by the 1 × 8 array. The SNR of the superior row of the 2 × 8 array was 15% greater than that of the 1 × 8 array, while the inferior row had equal (<1% difference) SNR as the 1 × 8 array. SNR was estimated using axial images taken through the center of the 1 × 8 array or the centers of the inferior or the superior rows of the 2 × 8 array. Signal was averaged over 130 mm diameter ROI in the center of the target slice. Noise was estimated using a 10-mm diameter ROI in the corner of the image where there was no signal. Tapering the superior row not only improved the SNR but also substantially improved homogeneity. In axial slices, the standard deviation of the B1 for the superior row of the 2 × 8 array was 4.1 versus 6.4% for the 1 × 8 array from the same brain locations. Homogeneity for the inferior row of the 2 × 8 array was similar to that of the 1 × 8 array and measured 13.0 and 11.7%, respectively.
Fig. 8.
Sagittal B1 maps acquired with the 2 × 8 array using only the superior row (a), inferior row (b), 4 coils simultaneously from each row (c), or the 1 × 8 array (d). Sagittal images from the same slice obtained using 2 × 8 (e) and 1 × 8 (f) arrays
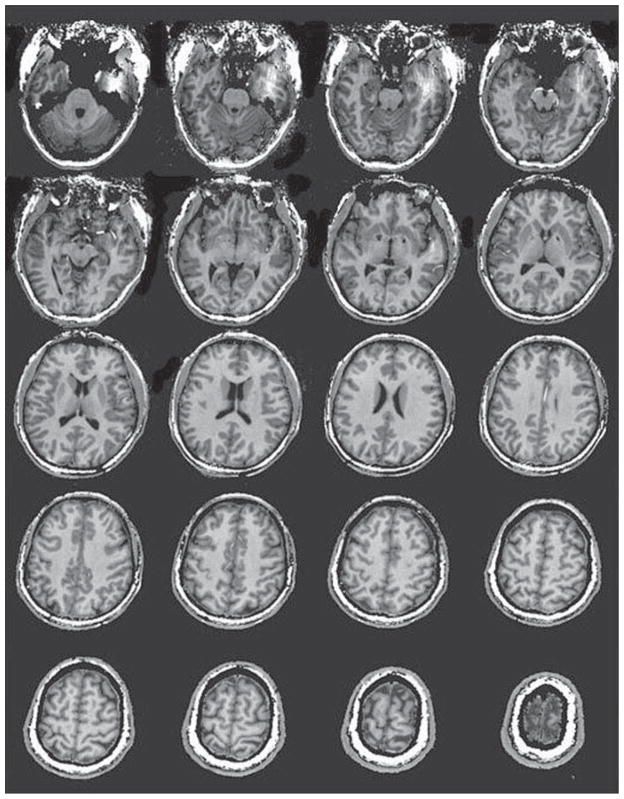
Optimization of the driving RF phases and amplitudes (RF shimming) during the comparison of two arrays was performed similarly as described above, since only a single row of the 2 × 8 array was driven. For the homogeneous excitation of the entire 16-coil array and global 3-D RF shimming, we utilized different approach. B1 amplitudes and phases were optimized for simultaneous global homogeneous excitation over the entire cerebrum, i.e., a single set of 16 amplitudes and 16 phases were used for all pulses. ROIs (ROIPhase and ROIAmp) were selected over seven axial slices separated by 1 cm and centered between the two rows of coils. Phases were calculated to maximize constructive interference over entire ROIPhase and amplitudes optimized over ROIAmp with both ROIs spanning through all seven slices. Figure 9 shows a set of multi-slice coronal images and corresponding B1 maps separately for the superior (Fig. 9a) and inferior (Fig. 9b) rows, as well as both of them combined together (Fig. 9c). The data were reconstructed as a sum of squares combination without taking into account noise correlation matrix. As seen from Fig. 9, global RF shimming combined with interdigitating of eight RF channels provided fairly homogeneous excitation of the entire cerebrum. Interestingly, B1 profiles for the superior and inferior rows nicely add to each other producing together extended and more homogeneous coverage of almost the entire brain. Finally, Fig. 10 shows a set of multi-slice inversion recovery (IR) axial images also obtained after performing global RF shimming. Although the 2 × 8 array can provide homogeneous excitation of the majority of the brain, overall power deposition (and specific energy absorption rate (SAR)) for slice-selective imaging can be reduced by only applying power to rows of coils which overlap the target slice. Addition of the third row over the cerebellum (3 × 8 array) should provide homogeneous coverage of the entire brain.
Fig. 9.
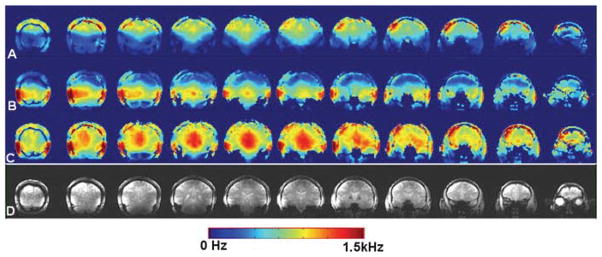
Multi-sliced coronal B1 maps acquired with the 2 × 8 array using only the superior row (a), inferior row (b) or multiplexing both rows (c). d Corresponding coronal images obtained by multiplexing both rows in the 2 × 8 array
Fig. 10.
Multi-sliced IR axial images
3.4 Double-Tuned 31P/1H Transceiver-Phased Array
The improved SNR at 7 T provides significant advantages for both 1H and lower gyromagnetic ratio nuclei such as 31P, 23Na and 13C (X nuclei). Double-resonant volume head coils, based on both birdcage [26–28] and TEM [19] designs, have been previously used at lower magnetic fields. However, at 7 T, transceiver-phased arrays provide significant advantages for transmit B1 homogeneity and efficiency over volume coils [9]. Similarly, phased arrays for reception provide additional SNR gains for peripheral locations for studies of X nuclei. Therefore, double-tuned transceiver arrays may provide substantial advantages over conventional double-tuned volume head coils.
3.5 Theory
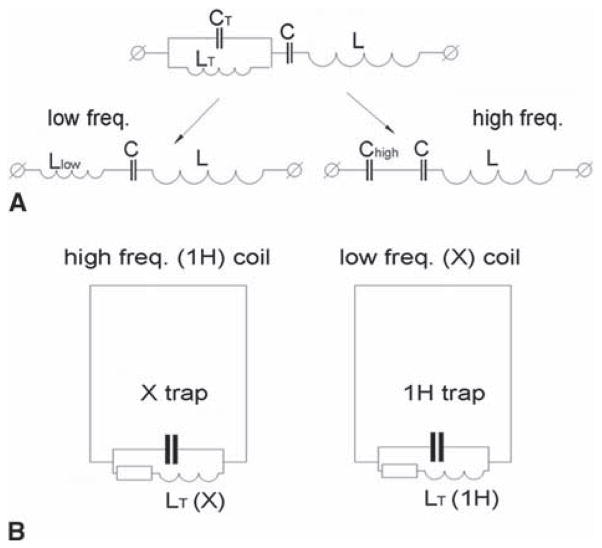
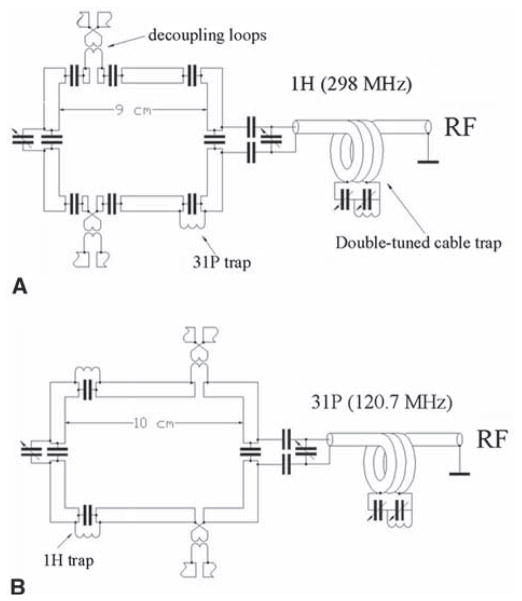
The most common way of constructing double-tuned surface coils, which presents an individual element of the phased array, is by introducing a resonance LC-trap circuit in series with each distributed capacitor [29]. Figure 11a demonstrates the general idea of constructing such a double-tuned surface coil. In this case the same inductive loop of the surface coil, L, is used to generate RF B1 field at both frequencies. A trap formed by parallel resonance circuit (LT, CT) is connected in series with a capacitor C and an inductor L. At low frequencies (ω2LTCT <1), trap’s impedance, Ztrap, is equivalent to an inductor, Llow, while at higher frequencies (ω2LTCT >1) it acts as a capacitor, Chigh, thus, producing a double-resonant circuit. The performance of the surface coil at both frequencies can be estimated as E = [PL/(PL + PT)]1/2 = [RL/(RL + RT)]1/2, where PL,T and RL,T are power losses and resistances associated with inductors L and LT. By adding sample losses we further obtain
Fig. 11.
Schematics demonstrating the general ideas of constructing single-layer LC-trap (a) and double-layer (b) double-tuned transceiver-phased arrays
| (2) |
where RS is the sample resistance and QU and QL are unloaded and loaded Q-factors, respectively. Efficiency at low, Elow, and high, Ehigh, frequencies can then be calculated using Eqs. (3) and (4) obtained from Eq. (2) similarly as in Ref. [29].
| (3) |
| (4) |
When sample losses become dominant (RS ≫ RL or QU/QL ≫ 1), double-tuned surface coils may be constructed while maintaining performance at both frequencies. However, conditions of sample loss domination are challenging to obtain for all surface coils in a head-sized phased array. This is especially true for an oversized array with the fixed geometry designed to accommodate larger head sizes and for the lower frequency (X nuclei) mode of a double-tuned coil where sample losses are less dominant. Even in the case of arrays with flexible geometries surface coils covering the forehead/nose area are still located further away from the tissue and still may not be sufficiently loaded.
Another approach of constructing the elements of the double-tuned phased array is by utilizing separate coils resonating at the X-nuclei and 1H-frequencies [30]. One element of the double-tuned (31P/1H) phased array consisting of two surface coils is shown schematically in Fig. 11b. In that case the traps become resonant and the values of the trap inductances (LT) can be optimized independently for each coil. Low-frequency performance, Elow, still can be estimated using Eq. (3) and can be further improved by minimizing LT. Ehigh can be evaluated using Eq. (2). Taking into account that , where R1 is the resistance associated with LT, ω0 is the 1H resonance frequency and ω1 is the 31P resonance frequency, and using reasoning similar to that in Ref. [29], we obtain
| (5) |
where is an inductance of the trap resonating at 31P frequency. Then even for sufficiently low QU/QL ratio of 1.2, L = 200 nH (approximately an inductance of the 8 × 9 cm2 coil) and (31P resonance with C1 = 10 pF), we obtain Ehigh = 0.98. Thus, using this approach the performance of the array can be optimized at both resonance frequencies.
Additional losses in double-tuned coils are introduced due to multiple interactions between the surface coils, between the coils and traps, between cables, etc. This results in decrease of the QU/QL ratio and, thus, in decrease of the coil’s performance. Therefore, to optimize the coil performance the QU/QL ratio must be maximized by increasing the absolute QU value (minimizing intrinsic coil losses and intercoil interaction) and by providing the tighter fit of the array to a human head. The latter, however, has to be done carefully since it may lead to an increase of the local SAR.
3.6 Array Design
The array consisted of two concentric layers of evenly spaced rectangular surface coils circumscribing the head (8 coils per layer) with the inner array resonating at 31P frequency (120.7 MHz) and the outer array resonating at 1H frequency (298 MHz) [16]. The lower frequency 31P array was placed in the inner layer, since it is less sample loss dominated. Distance between the layers measured 12 mm. The 31P and 1H arrays measured 10 and 9 cm in length, respectively. Figure 12 presents schematics of the individual 1H (Fig. 12a) and 31P (Fig. 12b) surface coils. For simplicity only one surface coil per layer is shown. Each surface coil was formed from copper tape (width, 6.4 mm), with several capacitors uniformly distributed along the coil’s length (Fig. 12). All the coils were individually tuned and matched using variable capacitors. The necessity to decouple all the array elements at both frequencies of interest substantially complicates the construction of a double-tuned phased array. To decouple adjacent surface coils in the same layer we utilized the inductive decoupling using two small (~1 cm in diameter) strongly coupled loops connected in series with each surface coil [17]. Isolation of at least −16 dB between the adjacent coils loaded with a head spherical phantom (2.0 L, 90 mM NaCl) was achieved. Isolation between all non-adjacent coils was similar or better. Isolation was then verified on human heads and further adjusted if necessary. To decouple 31P and 1H surface coils located in different layers multiple 31P and 1H parallel resonant traps were introduced into individual surface coils in series as shown in Fig. 12a, b. Isolation between 31P and 1H coils measured better than −35 dB at both frequencies. Similarly to the described above single-tuned 1 × 8 array, the double-tuned array had an elliptical shape and was split into two sections with the bottom section consisting of ten surface coils (five coils per layer) and the top portion consisting of six coils (three coils per layer). Two different array tops were constructed allowing variation in the coil’s height (21–23 cm). The width for both array combinations measured 19.5 cm. The array was shielded with the shield located 4 cm away from the 31P surface coils. To prevent wave propagation along the shield, cable traps were used (Fig. 12). It is noteworthy that for double-tuned coils, the current in the cable shield can be induced at both 31P and 1H resonance frequencies. Therefore, to suppress shield currents simultaneously at two resonance frequencies we used double-tuned cable traps (Fig. 12). The cable traps were constructed using LC-trap technique commonly utilized for double-tuned surface coils [29]. QU measured about 250 for both 31P and 1H surface coils. For single-tuned coils of the same size, QU measured 350 [14]. The drop of QU is due to residual interaction with closely located 31P surface coil. Loaded Q-factors, QL, varied depending on the location of the surface coil. At 1H frequency QL varied from ~70 (QU/QL = 3.6) for the bottom coil up to ~140 (QU/QL = 1.8). At 31P frequency QL ranged from ~90 (bottom, QU/QL = 2.8) to ~150 (top, QU/QL = 1.7).
Fig. 12.
Schematics of individual 1H (a) and 31P (b) elements (surface coils) of the 31P/1H double-tuned double-layer transceiver-phased array
To connect the array to the spectrometer we constructed an interface providing RF power to each of the 16 surface coils during transmission and connecting the surface coils to preamplifiers during reception. The interface contained 16 (8 at each frequency) preamplifiers (Advanced Receiver Research, Burlington, CT, USA) and 16 (8 at each frequency) homebuilt T/R PIN diode switches, each capable of handling 1 kW of RF. The switches provided greater than 50 dB of isolation and less than 0.2 dB of insertion loss.
We compared the array with a double-tuned 31P/1H TEM volume coil (1H coil length, 13 cm; 31P coil length, 16 cm; volume coil inner diameter, 25 cm) [16] and a single-tuned 8-channel transceiver array. For comparison we also constructed similar in geometry and size 31P/1H double-tuned transceiver array consisting of 8 double-tuned surface coils (length, 9 cm) utilizing LC-trap design [29]. In this design the adjacent surface coils were also decoupled inductively using the same method as described above with the difference that the same pair of small loops provided decoupling at both frequencies. Since the inductive decoupling is intrinsically broadband in theory it should work equally well at both frequencies of interest. Practically, however, it was difficult to optimize inductive decoupling at both frequencies at the same time. Most likely this is due to the difference in RF field distributions at the two frequencies causing differences in mutual inductive coupling. The isolation between the adjacent surface coils measured −14 dB or greater at 31P frequency and −10 to −12 dB at the 1H frequency.
To test the coil performance, gradient echo images of a human head (256 × 256 × 13 slices) were collected using 2 mm slice thickness and 8 mm gap, 19.2 × 19.2 cm2 field of view (FOV), echo time TE = 50 ms, repetition time TR = 400 ms, nominal flip angle of 15°. The 31P acquisition used a sparse Gaussian sampling scheme of 1219 encodes with a FOV of 240 × 240 × 240 mm3, with a TR of 0.5 s and 4 averages (41 min).
3.7 Performance of the Double-Tuned 31P/1H Phased Array
First, we compared performance of double-tuned 31P/1H transceiver-phased arrays, the single-tuned 1H array and the double-tuned 31P/1H quadrature TEM volume coil at 1H frequency (298 MHz) [16]. Table 3 provides quantitative comparison of data obtained on the same subject and similar brain location. The double-tuned double-layer 31P/1H phased array was almost two times more power efficient than a single-layer LC-trap array and ~2.5 times more efficient than the double-tuned TEM. This is equivalent to 40 and 60% improvement in B1 value in comparison with the LC-trap array and the TEM, respectively. Single-tuned 1H phased array was more efficient than the double-layer 31P/1H array by 68% in power and by 30% in B1 values. Also double-layer 31P/1H array provided 75% better homogeneity than the 31P/1H TEM volume coil. Homogeneity of the double-layer double-tuned and the single-tuned phased arrays was very similar. Extending the comparison over a range of several subjects and a variety of locations showed that in average the double-layer 31P/1H phased array was by 40% more efficient (B1 per kW) than the 31P/1H volume coil and by 35% less efficient than the single-tuned phased array. Again homogeneity of phased arrays was very similar and homogeneity of the volume coil was about 70% worse [16].
Table 3.
Comparison of phased arrays obtained at 1H frequency (298 MHz) for the same subject and the same brain location
| Coil | Array (top) | SD (%) | Powera (kW) |
|
|
|---|---|---|---|---|---|
| Single-tuned 1H array | Small | 8.89 | 1.33 | 20.37 | |
| Medium | 9.99 | 1.41 | 19.78 | ||
| Double-tuned, double-layer array | Small | 8.93 | 2.24 | 15.69 | |
| Medium | 9.66 | 2.78 | 14.09 | ||
| Double-tuned, single-layer array | Medium | 11.76 | 4.35 | 11.26 | |
| Double-tuned TEM | – | 15.61 | 5.66 | 9.87 |
Power required producing average B1 of 1 kHz over ROIAmp
Averaged value over the ROIAmp
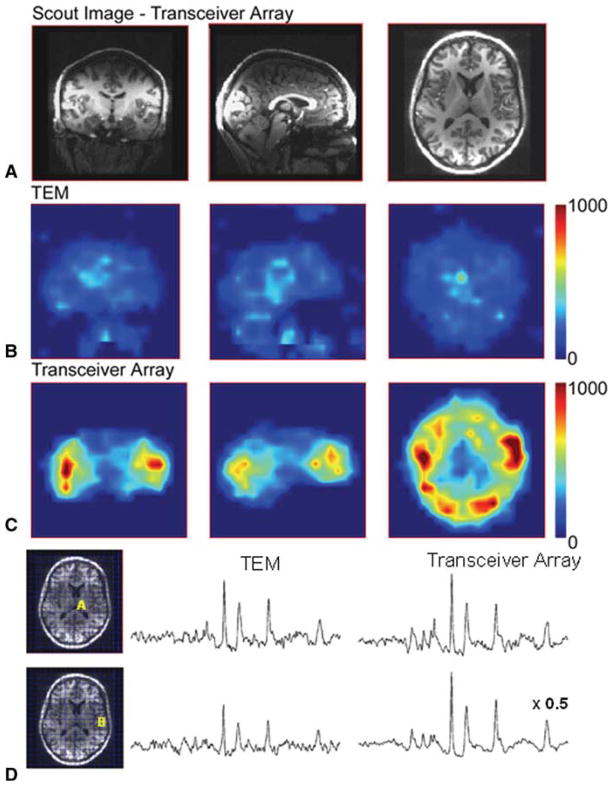
Figure 13 presents images and 31P spectroscopic data from a single subject and three different orientations obtained using the double-layer 31P/1H phased array and the 31P/1H TEM volume coil. The 31P spectroscopic images (Fig. 13b, c) show the integrated area of the phosphocreatine (PCr) resonance divided by the SD of the noise from the spectrum, in which there are no resonances (i.e., a measure of the noise). These data clearly demonstrate that SNR is improved by the phased array and also show a difference in volume coil and array longitudinal coverage. Obviously at 31P frequency the volume coil provides greater coverage being longer (16 vs. 10 cm). Figure 13d presents spectra from the same subject as in Fig. 13a from a central (thalamus) and peripheral location (temporal neocortex). The vertical scale of the spectra has been matched for SNR, except the transceiver array peripheral location which is scaled down by a factor of 2 to fit on the figure. The SNR of the array is approximately four times higher at the periphery and ~20% higher from the location at the center of the brain. Finally, Table 4 compares transmission efficiency of the double-layer 1H/31P phased array and the 1H/31P TEM at 31P frequency (120.7 MHz) measured as RF power required for 1 kHz of B1 obtained over several subjects and different locations. On average, the phased array required 38% less power than the volume coil, which is not surprising taking into account the difference in the coil length. Performance of the single-layer transceiver array at 31P frequency was very similar to that of the double-layer array.
Fig. 13.
a Scout images and 31P B1 maps obtained for the same subject and similar slice location at three projections using TEM volume coil (b) and 31P/1H double-layer array (c). d Spectra obtained from the same subject as in a from a central (thalamus) and peripheral location (temporal neocortex) using the double-layer 31P/1H phased array and the 31P/1H TEM coil. The scales of the spectra have been matched for SNR except the transceiver array peripheral location which is scaled down by a factor of 2 to fit on the figure
Table 4.
RF power required for 1 kHz of B1 obtained at 31P frequency (120.7 MHz) using the double-layer 1H/31P phased array and the 1H/31P TEM volume coil
| Subject | Double-layer 31P/1H array (kW) | 31P/1H TEM (kW) |
|---|---|---|
| 1 | 3.41 | 4.35 |
| 2 | 2.71 | 3.45 |
| 3 | 4.29 | 5.47 |
| 4 | 3.41 | 5.47 |
| 5 | 3.41 | 4.35 |
| 6 | 4.41 | 6.77 |
| Mean | 3.61 ± 0.64 | 4.98 ± 1.17 |
As we demonstrated experimentally, use of the double-layer 31P/1H allowed substantial improvement of the coil performance at 1H frequency in comparison with both the double-tuned 31P/1H TEM volume coil and the single-layer 31P/1H LC-trap array. However, the performance of the double-tuned array was still 2.3 dB (70% in power) worse than that of the single-tuned 1H array of a similar size. The drop in the performance can be explained by the larger size of the 1H part of the double-tuned array, which is located in the second layer, 12 mm away. The decrease of the QU/QL ratio of the double-tuned coils due to lower QU and higher QL under the same loading conditions is another factor contributing to the drop in the array performance. The QU at 1H frequency might be further improved by optimizing traps, their number and position within the surface coils. Optimizing the distance between the 1H surface coils and a head will improve loading of the 1H surface coils. Also shifting 31P surface coils and placing its center over the gap between 1H coils may reduce interaction between the surface coils in two layers.
4 Conclusions
At 7 T transceiver-phased arrays in combination with RF shimming have been shown to overcome intrinsic limitation of transmit head-sized volume coils, including low transmit efficiency and B1 inhomogeneity. Both transmit efficiency and the SNR of the array can be further improved by conforming the array geometry to a human head. However, changes in mutual inductive coupling between array’s elements under different loading due to variety in human head sizes/shapes make the design of the tightly fitted array complicated. To overcome this limitation we developed an 8-channel (1 × 8) elliptical split transceiver-phased array with selectable geometry. This design provides a simple and efficient way of optimizing the array geometry to achieve maximal performance. During the studies the performance of the array was characterized over 100 subjects, which defined a way for further improvements. That includes increasing the longitudinal coverage of the transceiver array. Therefore, the next step in development of head-sized transceiver array technology was a design and construction of the 16-channel double-row (2 × 8) split elliptical array with the superior row tapered to better conform to the head shape. In the 2 × 8 array longitudinal coverage, homogeneity and SNR in the human brain were substantially improved by the use of a multiple rows of transceiver arrays. Multiplexing the eight existing transmit channel between the two rows of the array provided homogeneous excitation over the entire array volume. To add to the X nuclei spectroscopic studies we developed double-tuned 31P/1H transceiver array, which to our best knowledge was the first attempt to construct a 7 T double-tuned transceiver array. The 31P/1H array increased both B1 homogeneity and efficiency for 1H transmission in comparison with the double-tuned TEM volume coil. For 31P studies, in comparison with the TEM, the transceiver array improves transmission efficiency (38% improvement in power), SNR for central brain locations (20% increase) and SNR (up to a 400% increase) for peripheral locations. In summary, transceiver-phased arrays provide a highly efficient and flexible platform for a variety of 7 T imaging studies.
References
- 1.Vaughan JT, Garwood M, Collins CM, Liu W, DelaBarre L, Adriany G, Andersen GP, Merkle H, Goebel R, Smith MB, Ugurbil K. Magn Reson Med. 2001;46:24. doi: 10.1002/mrm.1156. [DOI] [PubMed] [Google Scholar]
- 2.Van de Moortele P-F, Akgun C, Adriany G, Moeller S, Ritter J, Collins CM, Smith MB, Vaughan JT, Ugurbil K. Magn Reson Med. 2005;54:1503. doi: 10.1002/mrm.20708. [DOI] [PubMed] [Google Scholar]
- 3.Collins CM, Liu W, Schreiber W, Yang QY, Smith MB. J Magn Reson Imag. 2005;21:192. doi: 10.1002/jmri.20245. [DOI] [PubMed] [Google Scholar]
- 4.Avdievich NI, Hetherington HP, Kuznetsov AM, Pan JW. J Magn Reson Imag. 2009;29:461. doi: 10.1002/jmri.21660. [DOI] [PMC free article] [PubMed] [Google Scholar]
- 5.Nabetani A, McKinnon G, Nakada T. Proceedings of the 14th annual meeting of ISMRM; Seattle. 2006. p. 2608. [Google Scholar]
- 6.Adriany G, Van de Moortele P-F, Wiesinger F, Moeller S, Strupp JP, Andersen P, Snyder C, Zhang X, Chen W, Pruessmann KP, Boesiger P, Vaughan JT, Ugurbil K. Magn Reson Med. 2005;53:434. doi: 10.1002/mrm.20321. [DOI] [PubMed] [Google Scholar]
- 7.Pinkerton RG, Barberi EA, Menon RS. Magn Reson Med. 2005;54:499. doi: 10.1002/mrm.20583. [DOI] [PubMed] [Google Scholar]
- 8.Adriany G, Van de Moortele PF, Ritter J, Moeller S, Auerbach EJ, Akgun C, Snyder CJ, Vaughan T, Ugurbil K. Magn Reson Med. 2008;59:590. doi: 10.1002/mrm.21488. [DOI] [PubMed] [Google Scholar]
- 9.Avdievich NI, Pan JW, Baehring JM, Spencer DD, Hetherington HP. Magn Reson Med. 2009;62:17. doi: 10.1002/mrm.21970. [DOI] [PMC free article] [PubMed] [Google Scholar]
- 10.Mao W, Smith MB, Collins CM. Magn Reson Med. 2006;56:4–918. doi: 10.1002/mrm.21013. [DOI] [PMC free article] [PubMed] [Google Scholar]
- 11.Ibrahim TS, Tang L. J Magn Reson Imag. 2007;25:6–1235. doi: 10.1002/jmri.20919. [DOI] [PubMed] [Google Scholar]
- 12.Tropp J, Schirmer T. J Magn Reson. 2001;151:146. doi: 10.1006/jmre.2001.2329. [DOI] [PubMed] [Google Scholar]
- 13.Avdievich NI, Pan JW, Kuznetsov AM, Hetherington HP. Proceedings of the 17th annual meeting of ISMRM; Honolulu. 2009. p. 3002. [Google Scholar]
- 14.Hetherington HP, Avdievich NI, Pan JW. Proceedings of the 18th annual meeting of ISMRM; Stockholm. 2010. p. 3822. [Google Scholar]
- 15.Avdievich NI, Pan JW, Hetherington HP. Proceedings of the 19th annual meeting of ISMRM; Montreal. 2011. p. 328. [Google Scholar]
- 16.Avdievich NI, Pan JW, Hetherington HP. Proceedings of the 18th annual meeting of ISMRM; Stockholm. 2010. p. 1501. [Google Scholar]
- 17.Avdievich NI, Hetherington HP. J Magn Reson. 2007;186:341. doi: 10.1016/j.jmr.2007.03.001. [DOI] [PMC free article] [PubMed] [Google Scholar]
- 18.Yang QX, Wang J, Collins CM, Smith MB, Zhang X, Ugurbil K, Chen W. Magn Reson Med. 2004;52:1016. doi: 10.1002/mrm.20245. [DOI] [PubMed] [Google Scholar]
- 19.Vaughan JT, Hetherington HP, Otu JO, Pan JW, Pohost GM. Magn Reson Med. 1994;32:206. doi: 10.1002/mrm.1910320209. [DOI] [PubMed] [Google Scholar]
- 20.Harpen MD. Magn Reson Med. 1993;29:5–713. doi: 10.1002/mrm.1910290522. [DOI] [PubMed] [Google Scholar]
- 21.Sucher M, Fox J. Handbook of microwave measurements. Interscience Publishers, Polytechnic Press of the Polytechnic Institute of Brooklyn; New York: 1963. [Google Scholar]
- 22.Strupp JP, Auerbach EJ, Gozubuyuk A, Adriany G, Ugurbil K, Van De Moortele P-F. Proceedings of the 16th annual meeting of ISMRM; Toronto. 2008. p. 1135. [Google Scholar]
- 23.Pan JW, Twieg DB, Hetherington HP. Magn Reson Med. 1998;40:363. doi: 10.1002/mrm.1910400305. [DOI] [PubMed] [Google Scholar]
- 24.Hetherington HP, Avdievich NI, Pan JW. Proceedings of the 19th annual meeting of ISMRM; Montreal. 2011. p. 163. [Google Scholar]
- 25.Hetherington HP, Avdievich NI, Kuznetsov AM, Pan JW. Magn Reson Med. 2010;63:9. doi: 10.1002/mrm.22182. [DOI] [PMC free article] [PubMed] [Google Scholar]
- 26.Rath AR. J Magn Reson. 1990;86:488. doi: 10.1002/mrm.1910130304. [DOI] [PubMed] [Google Scholar]
- 27.Murphy-Boesch J, Srinivasan R, Carvajal L, Brown TR. J Magn Reson B. 1994;103:103. doi: 10.1006/jmrb.1994.1017. [DOI] [PubMed] [Google Scholar]
- 28.Shen GX, Wu JF, Boada FE, Thulborn KR. Magn Reson Med. 1999;41:268. doi: 10.1002/(sici)1522-2594(199902)41:2<268::aid-mrm9>3.0.co;2-g. [DOI] [PubMed] [Google Scholar]
- 29.Schnall MD, Subramanian VH, Leigh JS, Chance B. J Magn Reson. 1985;65:122. [Google Scholar]
- 30.Fitzsimmons JR, Beck BL, Brooker HR. Magn Reson Med. 1993;30:107. doi: 10.1002/mrm.1910300116. [DOI] [PubMed] [Google Scholar]


