

Abstract
OBJECTIVES
The aim of this study was to noninvasively detect the anti-inflammatory properties of the novel liver X receptor agonist R211945.
BACKGROUND
R211945 induces reversal cholesterol transport and modulates inflammation in atherosclerotic plaques. We aimed to characterize with 18F-fluorodeoxyglucose (FDG)–positron emission tomography (PET)/computed tomography (CT) and dynamic contrast-enhanced cardiac magnetic resonance (DCE-CMR) inflammation and neovascularization, respectively, in atherosclerotic plaques with R211945 treatment compared with atorvastatin treatment and a control.
METHODS
Twenty-one atherosclerotic New Zealand white rabbits were divided into 3 groups (control, R211945 [3 mg/kg orally], and atorvastatin [3 mg/kg orally] groups). All groups underwent 18F-FDG–PET/CT and DCE-CMR at baseline and at 1 and 3 months after treatment initiation. Concomitantly, serum metabolic parameters and histology were assessed. For statistical analysis, continuous DCE-CMR and PET/CT outcomes were modeled as linear functions of time by using a linear mixed model, whereas the histological data, animal characteristics data, and nonlinear regression imaging data were analyzed with a 2-tailed Student t test.
RESULTS
18F-FDG–PET/CT detected a decrease in mean and maximum standard uptake values (SUV) over time in the R211945 group (both p = 0.001), indicating inflammation regression. The atorvastatin group displayed no significant change (p = 0.371 and p = 0.600, respectively), indicating no progression or regression. The control group demonstrated an increase in SUV (p = 0.01 and p = 0.04, respectively), indicating progression. There was a significant interaction between time and group for mean and maximum SUV (p = 0.0003 and p = 0.0016, respectively). DCE-CMR detected a trend toward difference (p = 0.06) in the area under the curve in the atorvastatin group, suggesting a decrease in neovascularization. There was no significant interaction between time and group (p = 0.6350 and p = 0.8011, respectively). Macrophage and apolipoprotein B immunoreactivity decreased in the R211945 and atorvastatin groups (p < 0.0001 and p = 0.0004, respectively), and R211945 decreased oxidized phospholipid immunoreactivity (p = 0.02).
CONCLUSIONS
Noninvasive imaging with 18F-FDG–PET/CT and DCE-CMR and histological analysis demonstrated significant anti-inflammatory effects of the LXR agonist R211945 compared with atorvastatin. The results suggest a possible role for LXR agonists in the treatment of atherosclerosis.
Keywords: atherosclerosis, dynamic contrast-enhanced cardiac magnetic resonance, 18F-FDG–PET/CT, LXR agonist
Cardiovascular disease is the leading cause of mortality worldwide (1). Atherosclerosis is the primary cause of cardiovascular disease and is caused by the accumulation of oxidized lipids in the arterial wall that trigger the accumulation of inflammatory cells, most prominently macrophages (2,3). The ongoing recruitment of macrophages leads to the formation of fatty streaks and ultimately to the development of complex atherosclerotic plaques. Inflammation plays a central role in all stages of atherosclerosis and, in particular, when accompanied by neovascularization, promotes atherosclerotic plaque rupture and thrombosis, which cause the majority of acute coronary events (4,5).
Currently, the mainstay for the treatment of atherosclerosis is the use of low-density lipoprotein cholesterol–lowering strategies, mainly statins, which reduce the mortality risk by only 30% to 40% (6). Recently, strategies to further lower risk have been actively explored (7). High-density lipoprotein cholesterol displays a strong inverse relationship with cardiovascular disease, as demonstrated in multiple large epidemiological studies including the Framingham Heart Study (8). The mechanism by which high-density lipoprotein exerts its protective effects is mainly mediated by reverse cholesterol transport (9), a process by which peripheral tissue cells actively excrete cholesterol and phospholipids through the ATP-binding cassette transporter A1 (ABCA1) leading to the formation of high-density lipoprotein. This process is controlled by ABCA1 and is directly regulated by liver X receptors (LXRs) (10). In animal models of atherosclerosis, LXR agonists attenuate the development and reverse existing atherosclerotic plaques (11,12). First-generation LXR agonists, despite potent antiatherosclerotic effects, were accompanied by fatty liver accumulation and elevation of plasma triglycerides and low-density lipoprotein. Their translation into clinical practice was therefore limited (13). R211945, an LXR agonist, is a potent inducer of ABCA1 in rodents and cynomolgus monkeys without causing liver and metabolic side effects.
We demonstrated previously that multimodality molecular imaging using 18F-fluorodeoxyglucose (FDG)–positron emission tomography (PET)/ computed tomography (CT) and dynamic contrast-enhanced cardiac magnetic resonance (DCE-CMR) has the ability to assess macrophage content/ inflammation and neovascularization in atherosclerotic plaques at baseline and after therapeutic intervention (14–16). In this study, we aimed to assess noninvasively with 18F-FDG–PET/CT and DCE-CMR the effects of treatment with the LXR agonist R211945 on macrophage content/inflammation and neovascularization in atherosclerotic plaque in a rabbit model of atherosclerosis and to characterize its effects compared with treatment with atorvastatin.
METHODS
Animal model
Atherosclerosis was induced in 21 age- and weight-matched New Zealand White rabbits (Charles River Laboratories, Wilmington, Massachusetts) identically, as previously described (14). After 4 months on a high-fat diet, the animals were divided into 3 groups: a control group (n = 9) and 2 treatment groups (n = 6 in each). The animals in the control group were kept on a high-fat diet only, and the animals in the treatment groups were administered either R211945 (3 mg/kg body weight) or atorvastatin (3 mg/kg body weight) mixed with the high-fat diet for 3 months (Fig. 1). Three baseline age-matched animals on chow diet served as nonatherosclerotic controls at baseline and underwent PET/CT and macrophage histological staining for correlation between standard uptake value (SUV) and macrophage density. Diets were prepared by Research Diet Inc. (New Brunswick, New Jersey). All imaging and surgical procedures were performed with the animals under anesthesia by intramuscular injection of ketamine (20 mg/kg, Fort Dodge Animal Health, Fort Dodge, Iowa) and xylazine (5 mg/kg, Bayer HealthCare Pharmaceuticals, Wayne, New Jersey). The protocol was approved by the Mount Sinai School of Medicine Institute Animal Care and Use Committee.
Figure 1. Study Design.

Atherosclerotic New Zealand white rabbits after 4 months of a high cholesterol diet when imaging scans, lipid profiles, and RNA analysis were performed (baseline). Animals were then divided into control, atorvastatin, and R211945 groups. At 5 months (1-month imaging) and at 7 months (3-month imaging), imaging scans, lipid profiles, RNA analysis, and drug pharmacokinetics (PK) determination were performed. After last imaging, all animals were immediately sacrificed and tissue analysis was performed. ABCA1 = ATP-binding cassette transporter A1; DCE-CMR = dynamic contrast-enhanced cardiac magnetic resonance; MC-CMR = multicontrast cardiac magnetic resonance; PET/CT = positron emission tomography/computed tomography.
Blood analysis and immunohistology
See Online Appendix.
18F-FDG–PET/CT
PET images were acquired using a combined PET/CT scanner (Discovery LS, GE Healthcare, Milwaukee, Wisconsin). After injection of 37 MBq (1 mCi/kg) of 18F-FDG, 3 h were allowed for the 18F-FDG to circulate to lower 18F-FDG blood activity. Subsequently, a non–contrast-enhanced CT scan was performed for attenuation correction and anatomic localization of the PET signal. PET images were acquired for 10 min in a 3-dimensional mode. The acquisition covered the area from the diaphragm to the iliac bifurcation. Image reconstruction was performed using a Fourier iterative algorithm, giving a final reconstructed slice thickness of 4.25 mm.
PET/CT image analysis
PET/CT data were analyzed by an experienced observer blinded to the histology and CMR results, using a GE Healthcare Xeleris workstation. PET/CT outcome variables were the maximum and average SUVs. SUVs were recorded on contiguous axial slices in the aorta, starting from the left renal artery and to the iliac bifurcation, by drawing circular regions of interest encompassing the whole visible vessel wall. An average of 15 slices per animal were analyzed. The average maximum and mean SUV (SUVmax and SUVmean, respectively) per animal were used in the statistical analysis.
Anatomic and DCE-CMR
Rabbits were imaged using a 1.5-T clinical CMR system (Siemens Sonata, Siemens Medical Solutions USA, Inc., Malvern, Pennsylvania) using a conventional knee coil for signal reception. T1-, T2-, and proton density–weighted images were acquired from the left renal artery to the iliac bifurcation to characterize atherosclerotic plaques (17).
DCE-CMR was acquired on 1 selected axial slice using a black blood turbo spin echo after injection of 0.2 mmol/kg of gadopentetate dimeglumine (Magnevist, Bayer HealthCare Pharmaceuticals). This sequence was previously validated against histology and demonstrated excellent reproducibility (14,15,17).
Anatomic multicontrast CMR and DCE-CMR analysis
The average vessel wall area was quantified by manual tracing of the vessel wall contours on contiguous T2-weighted slices of the aorta between the left renal artery and iliac bifurcation using VesselMass software (Leiden University Medical Center, Leiden, the Netherlands).
DCE-CMR data were analyzed using custom Matlab (MathWorks, Natick, Massachusetts) software. The area under the signal intensity versus time curve of a region of interest encompassing the whole aortic wall visible in the slice acquired at 1 and 2 min after contrast agent injection was calculated (17). All CMR and DCE-CMR measurements were performed by independent operators blinded to the results of PET and immunohistology.
Statistical analysis
Continuous DCE-CMR and PET/CT outcomes were modeled as linear functions of time by using a linear mixed model; to adjust for multiple comparisons, we used the Bonferroni-Holm step-down procedure (14,18). All statistical analyses were performed using Proc Mixed in SAS Version 9.2 (SAS Institute, Cary, North Carolina). All histological data, animal characteristics data, and nonlinear regression imaging data were analyzed with a 2-tailed Student t test. Numerical values are expressed as mean ± SD. Values of p < 0.05 were considered significant.
RESULTS
Animal characteristics and serum analysis
All animals exhibited significantly elevated total cholesterol levels after 4 months on a high-fat diet (Table 1). The total cholesterol level of the control and R211945-treated groups did not change, whereas the atorvastatin group showed a reduction of 33% at 1 month and 34% at 3 months of treatment compared with baseline (Table 1). Weight and nonfasting triglyceride levels were not different between the groups (Table 1). Therapeutic plasma levels of both R211945 and atorvastatin were detected at 1 and 3 months by mass spectrometry (data not shown).
Table 1.
Animal Characteristics
| Control (n = 6) | Atorvastatin (n = 6) | R211945 (n = 6) | p Value (C/A) | p Value (C/R) | |
|---|---|---|---|---|---|
| Weight, kg | |||||
| 4 months | 3.42 ±0.33 | 3.51 ± 0.22 | 3.49 ± 0.21 | 0.59 | 0.63 |
| 5 months | 3.48 ± 0.31 | 3.47 ± 0.33 | 3.48 ± 0.26 | 0.95 | 0.97 |
| 7 months | 3.50 ± 0.30 | 3.62 ± 0.34 | 3.60 ± 0.21 | 0.49 | 0.49 |
| Total cholesterol, mg/dl | |||||
| 4 months | 1,099 ± 315 | 1,278 ± 196 | 1,228 ± 223 | 0.41 | 0.49 |
| 5 months | 1,158 ± 282 | 850 ± 433 | 1,187 ± 169 | 0.11 | 0.85 |
| 7 months | 1,124 ± 200 | 843 ± 270 | 1,119 ± 142 | 0.04* | 0.97 |
| Triglycerides, mg/dl* | |||||
| 4 months | 184 ± 110 | 180 ± 198 | 163 ± 75 | 0.97 | 0.79 |
| 5 months | 113 ± 95 | 163 ± 80 | 129 ± 102 | 0.41 | 0.82 |
| 7 months | 172 ± 163 | 161 ± 88 | 158 ± 89 | 0.91 | 0.87 |
| Glucose, mg/dl | |||||
| 4 months | 140 ± 27 | 121 ± 12 | 156 ± 41 | 0.23 | 0.49 |
| 5 months | 178 ± 40 | 169 ± 41 | 182 ± 52 | 0.68 | 0.87 |
| 7 months | 180 ± 47 | 201 ± 53 | 173 ± 27 | 0.48 | 0.81 |
| Insulin, mg/dl | |||||
| 4 months | 0.58 ± 0.38 | 0.42 ± 0.18 | 0.47 ± 0.37 | 0.48 | 0.72 |
| 5 months | 0.28 ± 0.06 | 0.38 ± 0.13 | 0.29 ± 0.13 | 0.14 | 0.85 |
| 7 months | 0.21 ± 0.14 | 0.27 ± 0.04 | 0.23 ± 0.06 | 0.43 | 0.83 |
Values are mean ± SD. Fasting values for total cholesterol, triglycerides, glucose, and insulin and weight for the control, atorvastatin, and R211945 groups. Values of p for the 3 groups are shown in separate columns.
Indicates nonfasting.
A = atorvastatin; C = control; R = R211945.
R211945 regresses inflammation and atorvastatin arrests inflammation progression as assessed by 18F-FDG–PET/CT
On completion of baseline 18F-FDG–PET/CT imaging, animals were divided into 3 matched groups (control, atorvastatin, and R211945) and subsequently imaged at 1 and 3 months (Fig. 2). The individual groups displayed similar baseline average SUVmax (0.64 ± 0.05, 0.63 ± 0.09, and 0.64 ± 0.09, respectively) and identical SUVmean (0.54 ± 0.05, 0.54 ± 0.09, and 0.54 ± 0.08, respectively) (Fig. 2). By using a linear mixed model and adjusting for multiple comparisons, we found that the SUVs of control animals showed significant differences compared with R211945-treated animals at 3 months after therapy initiation for both SUVmax (p = 0.0007) and SUVmean (p = 0.0001). On treatment, the SUV versus time slope for the R211945-treated group was negative and statistically different from zero for both SUVmax and SUVmean (p = 0.001 and p = 0.0009, respectively), indicating regression. In comparison, SUVmax and SUVmean versus time slopes for the atorvastatin-treated group were not statistically different from zero (p = 0.60 and p = 0.37, respectively), indicating halting of progression. In contrast, the SUV versus time slope for the control group was positive: SUVmax (p = 0.04) and SUVmean (p = 0.01), indicating progression. A significant difference in the slopes of R211945-treated group from those of the control group for both SUVmax (p = 0.0004) and SUVmean (p < 0.0001) was detected. Figure 2 shows scatterplots and the SUVs versus time slopes. There was a significant interaction between time and group (p = 0.0016 for SUVmax and p = 0.0003 for SUVmean).
Figure 2. 18F-Flurodeoxyglucose–PET/CT.

(A to I) Coronal PET images through the abdominal aorta (white arrowheads) from 1 representative animal per group. (A, D, G) Baseline of all groups (control, atorvastatin, and R211945, respectively). (B, E, H) All groups at 1 month. (C, F, I) All groups at 3 months. Summary showing scatterplots and standard uptake values versus time slopes (bottom). Abbreviations as in Figure 1.
R211945 does not change neovascularization, whereas atorvastatin shows a trend toward a decrease in neovascularization assessed by DCE-CMR
Figure 3 shows area under the curve (AUC) maps from 1 representative rabbit from each group and the mean AUC 1-min values over time. The AUC versus time slope for the R211945 group was negative but not statistically different from zero (AUC1 min, p = 0.14; AUC2 min; p = 0.10) (Fig. 3). The AUC versus time slope for the atorvastatin-treated group was negative and trended toward a significant difference from zero (AUC1 min, p = 0.06; AUC2 min; p = 0.06). The AUC versus time slope for the control group was not statistically different from zero for AUC measures (AUC1 min, p = 0.40; AUC2 min, p = 0.20). There was no significant interaction between time and group (p = 0.6350 for AUC1 min; p = 0.8011 for AUC2 min).
Figure 3. DCE-CMR.

(A to I) Single-slice axial T1-weighted CMR with color-coded overlay of the contrast signal at 1 min of the abdominal aorta with insert of the aorta. (A, D, G) All groups at baseline (control, atorvastatin [Atorva], and R211945, respectively). (B, E, H) All groups at 1 month. (C, F, I) All groups at 3 months. Warm colors (orange to red) indicate higher areas under the curve (AUCs); cool colors (green to blue) indicate lower AUCs. Summary showing scatterplots and AUCs versus time slopes (bottom). Abbreviations as in Figure 1.
R211945 and atorvastatin have no effect on vessel wall area as assessed by multicontrast CMR
Multicontrast CMR revealed no significant changes in aortic wall area in either group (Fig. 4).
Figure 4. MC-CMR.
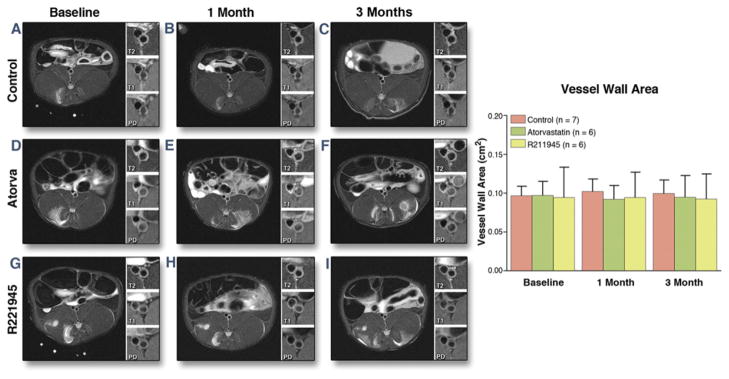
Single-slice axial T2-weighted representative CMR with insert of the aorta with T2-, T1-, and proton density weighing (A to I). (A, D, G) All groups at baseline (control, baseline atorvastatin [Atorva], and baseline R211945, respectively). (B, E, H) All groups at 1 month. (C, F, I) All groups at 3 months. Bar graph summary (right). Values are mean ± SD. Abbreviations as in Figure 1.
R211945 and atorvastatin decrease macrophages, apolipoprotein B, and oxidized phospholipids in plaque
Aortic tissue analysis of the individual groups (Figs. 5 and 6) showed a significantly lower macrophage density in the R211945 and atorvastatin groups compared with the control group (0.22 ± 0.009, 0.217 ± 0.02, and 0.32 ± 0.009 [arbitrary units (a.u.)], respectively; p < 0.0001 and p = 0.0004, respectively). A significantly lower apolipoprotein B density was detected in the R211945 and atorvastatin groups compared with the control group (0.25 ± 0.05, 0.26 ± 0.07, and 0.33 ± 0.03 [a.u.], respectively; p = 0.01 and p = 0.04, respectively). R211945 treatment resulted in a 42% reduction in oxidized phospholipid density compared with the control group (0.076 ± 0.026 and 0.146 ± 0.045 [a.u.], respectively, p = 0.02), whereas atorvastatin treatment led to a reduction of 23% in oxidized phospholipid density (0.106 ± 0.026, p = 0.08 vs. control). Average smooth muscle actin density was very similar between the R211945, atorvastatin, and control groups (0.24 ± 0.075, 0.26 ± 0.078, and 0.27 ± 0.078 [a.u.], respectively; p =0.36 and p =0.23, respectively vs. control). A trend toward lower neovessel content was observed in the R211945- and atorvastatin-treated groups (p =0.12 and p = 0.12, respectively, vs. control).
Figure 5. Immunohistology.
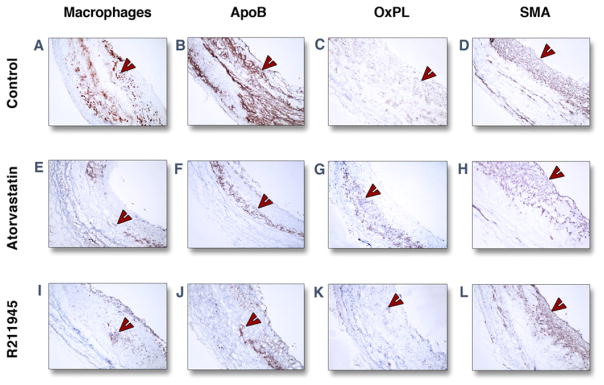
Representative immunohistological images of individual groups of the abdominal aorta at 3 months. Staining (red-brown, red arrowheads) for macrophages (A, E, I), apolipoprotein B (ApoB) (B, F, J), oxidized phospholipids (OxPL) (C, G, K), and smooth muscle actin (SMA) (D, H, L) are shown. Objective magnification: ×10. The lumen is on the right-hand side from the tissue.
Figure 6. Summary Immunohistology.

(Left) Macrophages (MAC), ApoB, OxPL, and SMA staining at 3 months in control and atorvastatin- and R211945-treated animals. Inset shows CD-31 staining for neovessels (individual p values between control and treatment group are indicated). (A to C) Representative histological images after CD-31 staining for neovessels: control (A), atorvastatin (B), and R211945 (C). All values are mean ± SD. *p < 0.05; ***p < 0.001. n.s. = nonsignificant; control versus treatment groups. Abbreviations as in Figure 5.
DISCUSSION
We demonstrate that the LXR agonist R211945 significantly regresses inflammation in plaques of atherosclerotic rabbits as quantified by 18F-FDG–PET/CT. Furthermore, with DCE-CMR, we observed a trend toward a decrease in neovascularization with atorvastatin treatment. The imaging results were confirmed by histological analysis and correlation assessment between imaging parameters and tissue macrophage density and neovessel content, respectively (Online Fig. 1).
The potential to noninvasively monitor plaque inflammation and its changes after therapeutic intervention by using 18F-FDG–PET/CT and DCE-CMR has been shown in multiple studies (19–21). We recently demonstrated in the same animal model used here the capability of both imaging modalities (18F-FDG–PET/CT and DCE-CMR) to assess the reduction in inflammation and neovascularization after pharmacological intervention (14,16). Atorvastatin treatment led in the current study to an arrest in the increase in 18F-FDG uptake, whereas R211945 induced a significant decrease in 18F-FDG uptake over time.
Histological analysis revealed a similar macrophage density in both the R211945 and atorvastatin groups, whereas only the R211945 group showed a significant decrease in SUVs, which was surprising because one would expect a lower macrophage content in the R211945 group given the observed decrease in SUVs. One potential interpretation is a difference in the inflammatory state of the residual vessel wall macrophages because 18F-FDG uptake by macrophages is closely linked to their state of activation (22). Interestingly, we observed a greater magnitude of oxidized phospholipid reduction in the R211945 group compared with the atorvastatin group. Lipid oxidation in plaque occurs partially through direct action of activated macrophages (23).
Furthermore, effects on smooth muscle cells, endothelial cells, T cells, and the modulation of hypoxia may have been induced by R211945, leading to a more pronounced decrease in SUVs compared with atorvastatin (24).
Noninvasive DCE-CMR demonstrated a trend in reduction of neovascularization in the atorvastatin group. Our results are consistent with human and animal studies in which atorvastatin treatment results in neovessel regression via suppression of vascular endothelial growth factor (VEGF) (25,26). This result is, furthermore, consistent with that our previous study in which a reduction in neovascularization after treatment with the peroxisome proliferator–activated receptor gamma agonist pioglitazone was observed (14). Peroxisome proliferator–activated receptor gamma agonists, similar to statins, decrease neovascularization (27). In contrast, the R211945-treated group did not show a significant reduction in neovasculature. The short-term application of an LXR agonist, in contrast to atorvastatin and pioglitazone, has been shown to induce VEGF (28). The pathophysiological role of LXR-induced VEGF is unclear at the moment. VEGF, however, is not only important in angiogenesis but is critical for the resolution of injury (29). In addition, we did not assess VEGF or target tissue VEGF-receptor expression directly in our study and, therefore, cannot conclusively determine the effects of the LXR agonist on VEGF.
Both atorvastatin and R211945 treatments did not reach statistical significance for both the imaging and histological parameters, which can be explained by the magnitude of the observed drug effect and the resulting power from the current sample size.
A potent induction of ABCA1 (Online Fig. 2) was observed in the R211945 treatment group. The previously described triglyceride increase by LXR agonists was absent in our study. Preliminary data demonstrate that R211945 preferentially acts on vasculature versus liver and furthermore shows selective nuclear cofactor recruitment, thereby limiting transactivation of lipogenic genes and, as a result, avoiding hepatic and metabolic side effects.
From an imaging standpoint, we show the capabilities of 18F-FDG–PET/CT and DCE-CMR to track noninvasively therapeutic intervention in atherosclerotic disease. This study supports the complementary role in future clinical applications of the 2 imaging techniques given the established correlation between 18F-FDG–PET/CT and DCE-CMR with macrophages/inflammation and neovasculature, respectively.
Study limitations
Our animal model is an aortic balloon injury model in combination with high cholesterol diet. This model is characterized by significant vascular inflammation and macrophage content, which does not mimic chronic stages of atherosclerosis in humans. Our response to R211945 treatment therefore may not be transferrable to all stages of atherosclerotic disease in humans. The standard uptake values assessed with 18F-FDG-PET/CT may be dependent not only in the inflammatory state but also on hypoxia within the vessel wall, which was not assessed in our study. We performed DCE-CMR on only 1 selected axial slice and, therefore, the presented results rely on the matching of chosen slices between the imaging sessions. Our experimental setup where animals were under anesthesia allowed for optimal slice matching and this may not always be achievable in longitudinal clinical studies.
CONCLUSIONS
In summary, we demonstrate the induction of regression of atherosclerosis in a rabbit model of atherosclerosis by an LXR agonist without causing lipogenic side effects. 18F-FDG–PET/CT and DCE-CMR were used in this study as markers of vascular macrophage content/inflammation and neovascularization. Both imaging techniques are noninvasive and clinically available, and this study has, therefore, direct implications for the future assessment of interventions in atherosclerotic disease.
Supplementary Material
Acknowledgments
This investigation was partially supported by the Fondation Leducq (Dr. Tsimikas), NCRR UL1RR029887 (Dr. Moshier), NIH/NHLBI R01 HL071021 (Dr. Fisher), and R01 HL078667 and NIH/NBIB EB009638 (Dr. Fayad). R211945 and atorvastatin were provided by Daichii Sankyo Inc. Drs. Tanimoto, Brown, and Kotsuma are employees of Daiichi Sankyo Inc. Dr. Tsimikas holds patents via University of California San Diego for oxidation-specific antibodies; is a consultant to Quest, ISIS, Genzyme, Sanofi, and Amarin; and holds equity interest Atherotope. Dr. Fisher has served on the advisory board and Speaker’s Bureau for Merck.
The authors thank Ash Rafique, RT(N) CNMT, BS, Suzanna Zata, CNMT, and Eric Rodriguez, RT(R)(N)(CT), for their support with the acquisition of PET images.
ABBREVIATIONS AND ACRONYMS
- ABCA1
ATP-binding cassette transporter A1
- a.u
arbitrary units
- AUC
area under the curve
- CT
computed tomography
- DCE-CMR
dynamic contrast-enhanced cardiac magnetic resonance
- FDG
fluorodeoxyglucose
- LXR
liver X receptor
- PET
positron emission tomography
- SUV
standard uptake value
- VEGF
vascular endothelial growth factor
APPENDIX
For supplemental data and figures, please see the online version of this article.
Footnotes
All other authors have reported that they have no relationships relevant to the contents of this paper to disclose.
References
- 1.Dahlöf B. Cardiovascular disease risk factors: epidemiology and risk assessment. Am J Cardiol. 2010;105:3A–9. doi: 10.1016/j.amjcard.2009.10.007. [DOI] [PubMed] [Google Scholar]
- 2.Steinberg D, Witztum JL. Oxidized low-density lipoprotein and atherosclerosis. Arterioscler Thromb Vasc Biol. 2010;30:2311– 6. doi: 10.1161/ATVBAHA.108.179697. [DOI] [PubMed] [Google Scholar]
- 3.Tsimikas S, Miller YI. Oxidative modification of lipoproteins: mechanisms, role in inflammation and potential clinical applications in cardiovascular disease. Curr Pharm Des. 2011;17:27–37. doi: 10.2174/138161211795049831. [DOI] [PubMed] [Google Scholar]
- 4.Ross R. Atherosclerosis—an inflammatory disease. N Engl J Med. 1999;340:115–26. doi: 10.1056/NEJM199901143400207. [DOI] [PubMed] [Google Scholar]
- 5.Hansson GK. Atherosclerosis—an immune disease: the Anitschkov Lecture 2007. Atherosclerosis. 2009;202:2–10. doi: 10.1016/j.atherosclerosis.2008.08.039. [DOI] [PubMed] [Google Scholar]
- 6.Libby P. The forgotten majority: unfinished business in cardiovascular risk reduction. J Am Coll Cardiol. 2005;46:1225– 8. doi: 10.1016/j.jacc.2005.07.006. [DOI] [PubMed] [Google Scholar]
- 7.Natarajan P, Ray KK, Cannon CP. High-density lipoprotein and coronary heart disease: current and future therapies. J Am Coll Cardiol. 2010;55:1283–99. doi: 10.1016/j.jacc.2010.01.008. [DOI] [PubMed] [Google Scholar]
- 8.Gordon D, Probstfield J, Garrison R, et al. High-density lipoprotein cholesterol and cardiovascular disease. Four prospective American studies. Circulation. 1989;79:8–15. doi: 10.1161/01.cir.79.1.8. [DOI] [PubMed] [Google Scholar]
- 9.Tall AR. Cholesterol efflux pathways and other potential mechanisms involved in the atheroprotective effect of high density lipoproteins. J Intern Med. 2008;263:256–73. doi: 10.1111/j.1365-2796.2007.01898.x. [DOI] [PubMed] [Google Scholar]
- 10.Venkateswaran A, Laffitte BA, Joseph SB, et al. Control of cellular cholesterol efflux by the nuclear oxysterol receptor LXR alpha. Proc Natl Acad Sci U S A. 2000;97:12097–102. doi: 10.1073/pnas.200367697. [DOI] [PMC free article] [PubMed] [Google Scholar]
- 11.Calkin AC, Tontonoz P. Liver x receptor signaling pathways and atherosclerosis. Arterioscler Thromb Vasc Biol. 2010;30:1513– 8. doi: 10.1161/ATVBAHA.109.191197. [DOI] [PMC free article] [PubMed] [Google Scholar]
- 12.Naik SU, Wang X, Da Silva JS, et al. Pharmacological activation of liver X receptors promotes reverse cholesterol transport in vivo. Circulation. 2006;113:90–7. doi: 10.1161/CIRCULATIONAHA.105.560177. [DOI] [PubMed] [Google Scholar]
- 13.Fievet C, Staels B. Liver X receptor modulators: effects on lipid metabolism and potential use in the treatment of atherosclerosis. Biochem Pharmacol. 2009;77:1316–27. doi: 10.1016/j.bcp.2008.11.026. [DOI] [PubMed] [Google Scholar]
- 14.Vucic E, Dickson SD, Calcagno C, et al. Pioglitazone modulates vascular inflammation in atherosclerotic rabbits noninvasive assessment with FDG-PET-CT and dynamic contrast-enhanced MR imaging. J Am Coll Cardiol Img. 2011;4:1100–9. doi: 10.1016/j.jcmg.2011.04.020. [DOI] [PMC free article] [PubMed] [Google Scholar]
- 15.Calcagno C, Cornily JC, Hyafil F, et al. Detection of neovessels in atherosclerotic plaques of rabbits using dynamic contrast enhanced MRI and 18F-FDG PET. Arterioscler Thromb Vasc Biol. 2008;28:1311–7. doi: 10.1161/ATVBAHA.108.166173. [DOI] [PMC free article] [PubMed] [Google Scholar]
- 16.Lobatto ME, Fayad ZA, Silvera S, et al. Multimodal clinical imaging to longitudinally assess a nanomedical anti-inflammatory treatment in experimental atherosclerosis. Mol Pharm. 2010;7:2020–9. doi: 10.1021/mp100309y. [DOI] [PMC free article] [PubMed] [Google Scholar]
- 17.Calcagno C, Vucic E, Mani V, Goldschlager G, Fayad ZA. Reproducibility of black blood dynamic contrast-enhanced magnetic resonance imaging in aortic plaques of atherosclerotic rabbits. J Magn Reson Imaging. 2010;32:191– 8. doi: 10.1002/jmri.22225. [DOI] [PMC free article] [PubMed] [Google Scholar]
- 18.Holm S. A simple sequentially rejective multiple test procedure. Scand J Stat. 1979;6:65–70. [Google Scholar]
- 19.Ishii H, Nishio M, Takahashi H, et al. Comparison of atorvastatin 5 and 20 mg/d for reducing F-18 fluorodeoxyglucose uptake in atherosclerotic plaques on positron emission tomography/computed tomography: a randomized, investigator-blinded, open-label, 6-month study in Japanese adults scheduled for percutaneous coronary intervention. Clin Ther. 2011;32:2337– 47. doi: 10.1016/j.clinthera.2010.12.001. [DOI] [PubMed] [Google Scholar]
- 20.Tahara N, Kai H, Ishibashi M, et al. Simvastatin attenuates plaque inflammation: evaluation by fluorode-oxyglucose positron emission tomography. J Am Coll Cardiol. 2006;48:1825–31. doi: 10.1016/j.jacc.2006.03.069. [DOI] [PubMed] [Google Scholar]
- 21.Ogawa M, Magata Y, Kato T, et al. Application of 18F-FDG PET for monitoring the therapeutic effect of antiinflammatory drugs on stabilization of vulnerable atherosclerotic plaques. J Nucl Med. 2006;47:1845. [PubMed] [Google Scholar]
- 22.Mamede M, Higashi T, Kitaichi M, et al. [18F]FDG uptake and PCNA, Glut-1, and Hexokinase-II expressions in cancers and inflammatory lesions of the lung. Neoplasia. 2005;7:369–79. doi: 10.1593/neo.04577. [DOI] [PMC free article] [PubMed] [Google Scholar]
- 23.Miller YI, Choi SH, Fang L, Tsimikas S. Lipoprotein modification and macrophage uptake: role of pathologic cholesterol transport in atherogenesis. Subcell Biochem. 2010;51:229–51. doi: 10.1007/978-90-481-8622-8_8. [DOI] [PubMed] [Google Scholar]
- 24.Folco EJ, Sheikine Y, Rocha VZ, et al. Hypoxia but not inflammation augments glucose uptake in human macrophages implications for imaging atherosclerosis with 18fluorine-labeled 2-deoxy-d-glucose positron emission tomography. J Am Coll Cardiol. 2011;58:603–14. doi: 10.1016/j.jacc.2011.03.044. [DOI] [PubMed] [Google Scholar]
- 25.Alber HF, Dulak J, Frick M, et al. Atorvastatin decreases vascular endothelial growth factor in patients with coronary artery disease. J Am Coll Cardiol. 2002;39:1951–5. doi: 10.1016/s0735-1097(02)01884-3. [DOI] [PubMed] [Google Scholar]
- 26.Bot I, Jukema JW, Lankhuizen IM, van Berkel TJ, Biessen EA. Atorvastatin inhibits plaque development and adventitial neovascularization in ApoE deficient mice independent of plasma cholesterol levels. Atherosclerosis. 2011;214:295–300. doi: 10.1016/j.atherosclerosis.2010.11.008. [DOI] [PubMed] [Google Scholar]
- 27.Panigrahy D, Singer S, Shen LQ, et al. PPARgamma ligands inhibit primary tumor growth and metastasis by inhibiting angiogenesis. J Clin Invest. 2002;110:923–32. doi: 10.1172/JCI15634. [DOI] [PMC free article] [PubMed] [Google Scholar]
- 28.Walczak R, Joseph SB, Laffitte BA, Castrillo A, Pei L, Tontonoz P. Transcription of the vascular endothelial growth factor gene in macrophages is regulated by liver X receptors. J Biol Chem. 2004;279:9905–11. doi: 10.1074/jbc.M310587200. [DOI] [PubMed] [Google Scholar]
- 29.Hoenig MR, Bianchi C, Sellke FW. Hypoxia inducible factor-1 alpha, endothelial progenitor cells, monocytes, cardiovascular risk, wound healing, cobalt and hydralazine: a unifying hypothesis. Curr Drug Targets. 2008;9:422–35. doi: 10.2174/138945008784221215. [DOI] [PubMed] [Google Scholar]
Associated Data
This section collects any data citations, data availability statements, or supplementary materials included in this article.