Abstract
The primary accumulating metabolites in fatty acid oxidation defects are intramitochondrial acyl-CoAs. Typically, secondary metabolites such as acylcarnitines, acylglycines and dicarboxylic acids are measured to study these disorders. Methods have not been adapted for tissue acyl-CoA measurement in defects with primarily acyl-CoA accumulation. Our objective was to develop a method to measure fatty acyl-CoA species that are present in tissues of mice with fatty acid oxidation defects using flow-injection tandem mass spectrometry.
Following the addition of internal standards of [13C2] acetyl-CoA, [13C8] octanoyl-CoA, and [C17] heptadecanoic CoA, acyl-CoA’s are extracted from tissue samples and are injected directly into the mass spectrometer. Data is acquired using a 506.9 neutral loss scan and multiple reaction-monitoring (MRM).
This method can identify all long, medium and short-chain acyl-CoA species in wild type mouse liver including predicted 3-hydroxyacyl-CoA species. We validated the method using liver of the short-chain-acyl-CoA dehydrogenase (SCAD) knock-out mice. As expected, there is a significant increase in [C4] butyryl-CoA species in the SCAD −/− mouse liver compared to wild type. We then tested the assay in liver from the short-chain 3-hydroxyacyl-CoA dehydrogenase (SCHAD) deficient mice to determine the profile of acyl-CoA accumulation in this less predictable model. There was more modest accumulation of medium chain species including 3-hydroxyacyl-CoA’s consistent with the known chain-length specificity of the SCHAD enzyme.
Keywords: Acyl-coenzyme A’s, Fatty acid oxidation defects, Biomarkers, SCAD deficiency, SCHAD deficiency
1. Introduction
The oxidation of fatty acids in the mitochondria results in the production of energy to be used when there is an increased demand for energy including fasting, illness, and muscular exertion. The process of fatty acid oxidation (FAO) includes the carnitine cycle, the beta-oxidation cycle, the electron-transport chain, and, in liver, ketone synthesis. Free fatty acids are activated to their coenzyme A (CoA) esters in the cytosol at the outer mitochondrial membrane. Long-chain (C16 and C18) fatty acyl-CoAs enter the mitochondria as acylcarnitines via the carnitine transport system and are reconverted back to their respective acyl-CoA’s at the inner mitochondrial membrane. With each step of FAO, fatty acyl-CoAs are chain-shortened by two carbons until completely converted to acetyl-CoA. Energy released during beta-oxidation is transferred to the electron transport chain resulting in the production of adenosine triphosphate (ATP). In the liver, most of the acetyl-CoA is used to synthesize ketone bodies (3-hydroxybutyrate and acetoacetate), which can be used as fuel by tissues that are unable to oxidize fatty acids, most notably, the brain. Tissues such as cardiac and skeletal muscle are capable of direct utilization of the fatty acids as a source of energy [1]. Disorders in FAO can result in various phenotypes including hypoglycemia, brain damage, liver disease, kidney dysfunction, and damage to cardiac and skeletal muscle [2,3]. Early detection of FAO disorders is critical to ensure that the proper evaluation and management are performed in a timely fashion [4]. The primary accumulating metabolites in fatty acid oxidation defects are intramitochondrial acyl-CoAs. Typically, secondary metabolites such as acylcarnitines, acylglycines and dicarboxylic acids are measured to study these defects. Methods have not been readily available for tissue acyl-CoA measurement. Most published methods involve HPLC separations and all previously published methods do not detect a full range of acyl-CoA species, mainly due to hydrophobicity differences between long-, medium- and short-chain acyl-CoA species [5–16]. We have developed an analytical approach to directly measure fatty acyl-CoA species of all chain lengths using flow-injection tandem mass spectrometry. The method was validated using liver from the short-chain-acyl-CoA dehydrogenase (SCAD) deficient mouse and tested using the medium- and short-chain-3-hydroxyacyl-CoA dehydrogenase (SCHAD) knock out mouse.
2. Materials and methods
2.1. Materials
Acetyl-13C2 CoA, octanoyl-13C4 CoA, and heptadecanoyl CoA for internal standards and unlabeled acyl-CoA’s were purchased from Sigma Aldrich (St. Louis, MO). Methanol and chloroform were HPLC or LC/MS grade from Fisher Scientific (Pittsburgh, PA). Strata X-AW 33 μ Polymeric Weak Anion 200 mg/3 ml Solid Phase Extraction (SPE) columns were from Phenomenex (Torrance, CA).
2.2. Sample preparation
Stable isotope labeled acetyl-13C2 CoA, octanoyl-13C4 CoA, and heptadecanoyl CoA solutions were mixed as internal standards before liver extraction. About 100 mg of frozen liver was weighed out in a 12×75 mm polypropylene tube. Then, 30 nmol of the acetyl-13C2 CoA and 14.4 nmol of octanoyl-13C4 CoA and heptadecanoyl CoA internal standard mixture was added to the tube. Acyl-CoAs were extracted with 3 ml of methanol-chloroform (2:1 by volume). A PowerGen 125 homogenizer (Fisher Scientific, PA) was used to homogenize the liver specimen twice whilst keeping the polypropylene tube on ice. Following each 30 second homogenization, the homogenate was centrifuged at 1300g for 15 minutes at 4 °C [17]. The supernatants were combined in a 15 ml polypropylene tube and were then phase separated by adding 1.5 ml of 10 mM ammonium formate and 1.5 ml of chloroform and vortexed for 10 seconds. The upper layer containing the acyl CoA fraction was collected after a 15 minute centrifugation at 1300g at 4 °C and further purified by elution through a weak anion reverse phase SPE column. The SPE protocol for acyl CoA clean up was to condition the SPE column with 3 ml methanol, then to equilibrate with 3 ml water, load the supernatant fraction, wash the column with 2.4 ml of 2% formic acid, followed by an additional wash with 2.4 ml of methanol. The first elution of the CoAs was with 2.4 ml of 2% ammonium hydroxide followed by a second elution with 2.4 ml of 5% ammonium hydroxide. The two eluted fractions were then combined in 13×100 mm glass tube and dried under a nitrogen stream at room temperature. Prior to injection into the mass spectrometer, the samples were reconstituted in 100 μl of 50% methanol.
2.3. Flow injection tandem mass spectrometry
Flow injection tandem mass spectrometry analysis was performed using a Waters Quattro Ultima electrospray tandem mass spectrometer fitted with a Waters 2795 high-performance liquid chromatography system (Waters Corporation, Milford, MA). The running buffer used was 5 mM ammonium formate in methanol. The Quattro Ultima was operated in positive ionization mode. The capillary voltage was set at 3.40 kV, cone voltage at 40 V, source temperature was 120 °C, desolvation temperature was 400 °C, and desolvation nitrogen flow was 800 l/h. Collision energy was 35 V, the dwell time 0.07 seconds and the flow injection rate was 0.15 ml/minute.
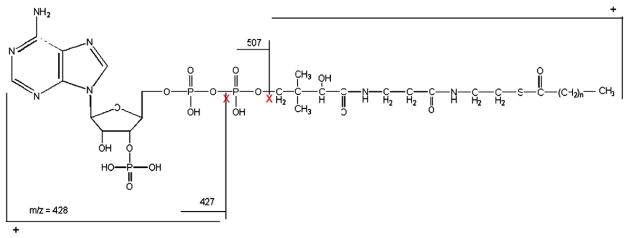
Samples were flow injected into the tandem mass spectrometer. A complete acyl-CoA profile was identified using the unique neutral loss of m/z 507 (Fig. 1). The MRM transitions for C2, C3, C4, C6, C8, C10, C12, C14, C16, C18, C18:1, and C18:2 acyl-CoA respectively were m/z 810→303, 824→317, 838→331, 866→359, 894→387, 922→415, 950→443, 978→471, 1006→499, 1034→527, 1032→555, and 1030→553. The acyl-CoA concentrations were calculated by measuring the ratio of the intensity of each acyl-CoA species to the intensity of the nearest chain-length internal standard.
Fig. 1.

The acyl-CoA fragmentation pattern showing the mass-specific fragment and the neutral loss of m/z 507.
3. Results
3.1. Selection of criteria for acyl-CoA identification and quantification
Fig. 1 shows the fragmentation pattern of acetyl-CoA identifying the neutral loss pattern and demonstrates the mass-specificity and the fragment used for quantitation.
3.2. Recovery and precision experiments
Intraassay imprecision studies were performed by analyzing 5 replicates of a single control tissue seeded with unlabeled acetyl-, octanoyl- and palmitoyl-CoAs at low and high concentrations and determining the mean, standard deviation and coefficient of variation of the calculated data. Interassay imprecision was determined by analysis of the same tissue extracted on 5 separate days and analyzed in 5 separate runs. Recoveries were determined by seeding in the same three acyl-CoAs prior to the extraction process at a predicted additional concentration of 0.5 μmol/l and repeating the extraction and analysis process 6 times.
Table 1 lists the recovery and imprecision data obtained using acetyl (C2) octanoyl (C8) and palmitoyl (C16) CoA species. In the initial phases of these experiments we detected residual carryover of the C16 species. Subsequent to this observation we added an additional flush cycle of 50% methanol to the analytical program which has now removed the contaminating carryover of long-chain species.
Table 1.
Imprecision and recovery of the acyl-CoA assay.
| Acetyl CoA
|
Octanoyl CoA
|
Palmitoyl CoA
|
||||
|---|---|---|---|---|---|---|
| Mean±SD | CV, % | Mean±SD | CV, % | Mean±SD | CV, % | |
| Intraassay | ||||||
| Low Conc. (n=5) | 0.15±0.005 | 3.6 | 0.11±0.005 | 5.2 | 0.15±0.008 | 5.7 |
| High Conc. (n=5) | 0.63±0.016 | 2.6 | 0.52±0.011 | 2.1 | 0.61±0.025 | 4.4 |
| Interassay | ||||||
| Low Conc. (n=5) | 0.14±0.007 | 5.2 | 0.11±0.004 | 3.8 | 0.14±0.009 | 6.7 |
| High Conc. (n=5) | 0.62±0.015 | 2.4 | 0.52±0.018 | 3.3 | 0.63±0.068 | 10.8 |
| Recovery % | 96.2 | 84.8 | 98.1 | |||
3.3. Measurement of Acyl-CoA Species in wild type mouse liver
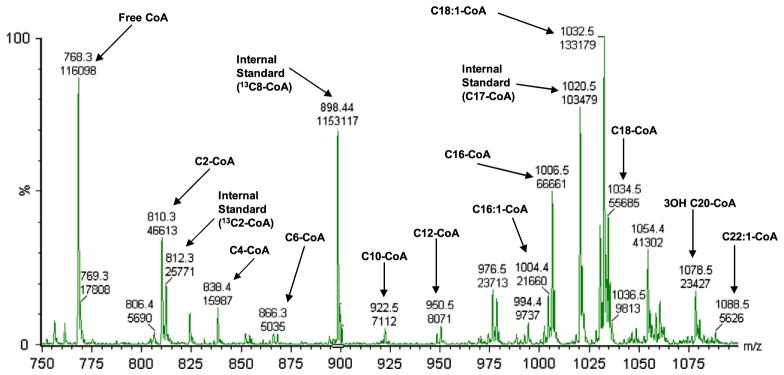
Fig. 2 shows the full scan mass spectrometric profile of all acyl-CoA species that were detected in fasted wild-type mouse liver and demonstrates that this method can identify all long- medium- and short-chain acyl-CoA species in wild type mouse liver including putative 3-hydroxy and 3-ketoacyl-CoA species based on fragmentation patterns and mass determination.
Fig. 2.

Neutral loss scan of liver acyl-CoA profile from 24 hour fasted wild type mouse.
3.4. Acyl-CoA profiles in liver from SCAD KO Mice
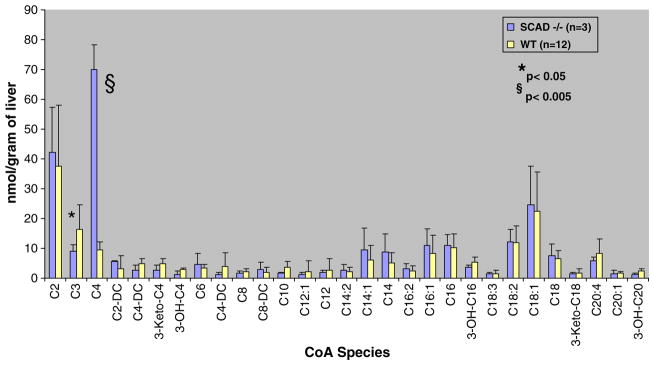
Acyl-CoA species in liver from SCAD KO mice were then analyzed in order to demonstrate the ability of this method to distinguish differences in acyl-CoA profiles in livers from healthy mice and livers from mice with a fatty acid oxidation defect in which the expected profile would be easily predicted. SCAD is specific for butyryl-CoA (C4). It catalyzes the first step of the beta-oxidation pathway converting acyl-CoA to enoyl-CoA. Fig. 3 demonstrates a significant 16 fold elevation of C4 acyl-CoA in the SCAD KO mouse liver compared to wild type. Interestingly, the amount of C6 acyl-CoA is approximately 4 fold higher in the SCAD KO mouse compared to the wild type suggesting that there may either be secondary inhibition at the C6 level or that SCAD may have activity with C6 species also. Of note, plasma acylcarnitine profiles do not reflect increased C6 species in SCAD deficiency.
Fig. 3.

Concentrations of acyl-CoA species in 24 hour fasted SCAD-deficient mouse liver compared to wild-type (N=12 wild type, 3 SCAD deficient).
3.5. Using SCHAD KO mice
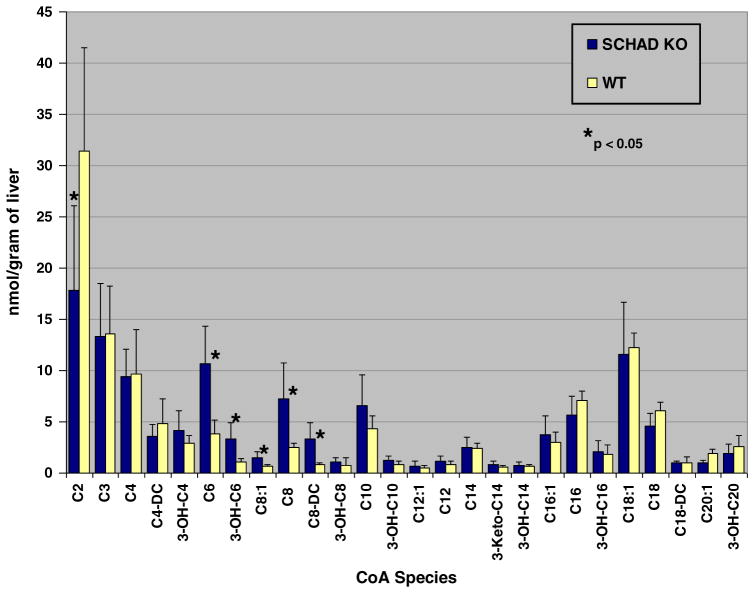
SCHAD carries out the penultimate reaction of the fatty acid oxidation spiral, catalyzing the reversible dehydrogenation of 3-hydroxyacyl CoAs to their corresponding 3-ketoacyl CoAs with concomitant reduction of NAD to NADH. In patients that have been identified with SCHAD null mutations there is a phenotype of hypoglycemia due to hyperinsulinism [18–20]. These patients have elevated levels of serum 3-OH butyryl (OH-C4) carnitine and elevated urine 3-OH glutarate. Our SCHAD KO mouse model has this same hyperinsulinism phenotype and similar metabolite accumulation [21]. Fig. 4 demonstrates higher levels of 3-OH C4-, C6-, 3-OH-C6, and C8-acyl CoA species in the livers from fasted SCHAD mice compared to fasted wild type mice. Not unexpectedly, there is more C2-acyl CoA in the WT compared to the SCHAD KO mouse consistent with impaired FAO. Comparison of the SCHAD KO to the WT in terms of absolute ratio of species suggests also that there are multiple medium-chain acyl-CoA species that are accumulating in the SCHAD KO mouse model consistent with the known chain-length specificity of the enzyme [22].
Fig. 4.
Concentrations of acyl-CoA species in 24 hour fasted SCHAD knockout Mouse liver compared to wild type and showing accumulation of medium-chain species consistent with the enzymatic chain-length specificity of the enzyme (N=12 wild type, 8 SCHAD knockout).
Discussion
With this novel flow-injection tandem mass spectrometry method, we can measure the entire range of acyl-CoAs from C2-C22 including 3-hydroxy species in 100 mg or less of liver tissue and identify predictable abnormalities in genetic defects of fatty acid oxidation.
The current standard methods for measurement of diagnostic metabolites in FAO defects, includes analysis of acylcarnitines, acylglycines and urine organic acids, which are two to three metabolic steps removed from what is actually happening to the acyl-CoA species as they undergo beta-oxidation or fail to do so. These metabolites are often metabolized in secondary organelles such as peroxisomes and may not always reflect the primary defect. This method is not yet ready for direct clinical application but provides us with a tool with which to target the direct metabolic consequences of some metabolic defects by direct measurement of the acyl-CoA species in tissues. It will provide information as to which intermediate species are accumulating in the mitochondria and what the patterns of those species look like in a given defect of FAO. Additionally, the knowledge of what specific intermediate species are accumulating may lead to therapies directed against those metabolites that may be causing the end-organ damage seen in many of the FAO defects (such as LCHAD deficiency). This is the first step in establishing this method as a way to directly measure acyl-CoA species in tissue. It provides us with an opportunity to evaluate tissue-specific differences in metabolite accumulation which may assist in our better understanding of why some FAO defects present with cardiomyopathy and others do not. It may provide us with answers to the question of why C14:1 is the primary accumulating acylcarnitine biomarker for VLCAD deficiency when intuitively C16 and C18 species should accumulate as with CPT2 and CACT deficiencies. It may also offer direct tests of the ability of therapies, such as carnitine supplementation, which have been proposed to be able to prevent the accumulation of potentially toxic acyl-CoA intermediates. Our current limitation of the methodology is the relatively low sensitivity of the assay which results from the complex extraction procedure required to analyze all acyl-CoA species and limits us to tissue measurement in animal models at the present time. Future refinements may make it feasible to perform measurements with isolated lymphocytes or cultured skin fibroblasts. This should not detract from our ability to interpret tissue acyl-CoA profiles and determine the role of these primary accumulating metabolites in understanding mechanisms of metabolite accumulation in FAO and other organic acid defects where a coenzyme A intermediate accumulates. In these preliminary studies we can already see differences between accumulating acyl-CoAs in both SCAD and SCHAD deficiencies which are not seen in the acylcarnitine profiles. The acylcarnitine profile in the SCAD deficient mouse has been well documented and consists only of C4 elevation [23] with no C6 elevation as we see here in the acyl-CoA profile. We have previously published the plasma acylcarnitine profile in the SCHAD knockout mouse which consisted only of an elevation of C4-OH as seen in the human disease [21]. The acyl-CoA profile demonstrated elevations of medium-chain species consistent with the known chain-length specificity of the enzyme [22].
Acknowledgments
AAP was the recipient of an SIMD-Ucyclyd fellowship training award.
References
- 1.Bartlett K, Eaton S. Mitochondrial beta-oxidation. Eur J Biochem. 2004;271:462–469. doi: 10.1046/j.1432-1033.2003.03947.x. [DOI] [PubMed] [Google Scholar]
- 2.Houten SM, Wanders RJA. General introduction to the biochemistry of mitochondrial fatty acid β-oxidation. J Inherit Metab Dis. 2010;33:469–477. doi: 10.1007/s10545-010-9061-2. [DOI] [PMC free article] [PubMed] [Google Scholar]
- 3.Stanley CA, Hale DE. Genetic disorders of mitochondrial fatty acid oxidation. Curr Opin Pediatr. 1994;6:476–481. doi: 10.1097/00008480-199408000-00021. [DOI] [PubMed] [Google Scholar]
- 4.Parini R, Corbetta C. Metabolic screening for the newborn. J Matern Fetal Neonatal Med. 2011;24(Suppl 2):6–8. doi: 10.3109/14767058.2011.606617. [DOI] [PubMed] [Google Scholar]
- 5.Corkey BE, Brandt M, Williams RJ, Williamson JR. Assay of short-chain acyl coenzyme A intermediates in tissue extracts by high-pressure liquid chromatography. Anal Biochem. 1981;118:30–41. doi: 10.1016/0003-2697(81)90152-4. [DOI] [PubMed] [Google Scholar]
- 6.Woldegiorgis G, Spennetta T, Corkey BE, Williamson JR, Shrago E. Extraction of tissue long-chain acyl-CoA esters and measurement by reverse-phase high-performance liquid chromatography. Anal Biochem. 1985;150:8–12. doi: 10.1016/0003-2697(85)90434-8. [DOI] [PubMed] [Google Scholar]
- 7.King MT, Reiss PD. Separation and measurement of short-chain coenzyme-A compounds in rat liver by reversed-phase high-performance liquid chromatography. Anal Biochem. 1985;146:173–179. doi: 10.1016/0003-2697(85)90412-9. [DOI] [PubMed] [Google Scholar]
- 8.Paris A, Sutra JF, Rao D. Separation of C-17 fatty acid esters of 17 beta-estradiol by reversed-phase high-performance liquid chromatography. J Chromatogr. 1989;493:367–372. doi: 10.1016/s0378-4347(00)82743-7. [DOI] [PubMed] [Google Scholar]
- 9.Larson TR, Graham IA. Technical advance: a novel technique for the sensitive quantification of acyl CoA esters from plant tissues. Plant J. 2001;25:115–125. doi: 10.1046/j.1365-313x.2001.00929.x. [DOI] [PubMed] [Google Scholar]
- 10.Deutsch J, Rapoport SI, Rosenberger TA. Coenzyme A and short-chain acyl-CoA species in control and ischemic rat brain. Neurochem Res. 2002;27:1577–1582. doi: 10.1023/a:1021614422668. [DOI] [PubMed] [Google Scholar]
- 11.Minkler PE, Anderson VE, Maiti NC, Kerner J, Hoppel CL. Isolation and identification of two isomeric forms of malonyl-coenzyme A in commercial malonyl-coenzyme A. Anal Biochem. 2004;328:203–209. doi: 10.1016/j.ab.2004.01.015. [DOI] [PubMed] [Google Scholar]
- 12.Spiekerkoetter U, Sun B, Zytkovicz T, Wanders RJ, Strauss AW, Wendel U. MS/MS-based newborn and family screening detects asymptomatic patients with very-long-chain acyl-CoA dehydrogenase deficiency. J Pediatr. 2003;143:335–342. doi: 10.1067/S0022-3476(03)00292-0. [DOI] [PubMed] [Google Scholar]
- 13.ter Veld F, Mueller M, Kramer S, Haussmann U, Herebian D, Mayatepek E, Laryea MD, Primassin S, Spiekerkoetter U. A novel tandem mass spectrometry method for rapid confirmation of medium- and very long-chain acyl-CoA dehydrogenase deficiency in newborns. PLoS One. 2009;4:e6449. doi: 10.1371/journal.pone.0006449. [DOI] [PMC free article] [PubMed] [Google Scholar]
- 14.van Vlies N, Ruiter JP, Doolaard M, Wanders RJ, Vaz FM. An improved enzyme assay for carnitine palmitoyl transferase I in fibroblasts using tandem mass spectrometry. Mol Genet Metab. 2007;90:24–29. doi: 10.1016/j.ymgme.2006.07.006. [DOI] [PubMed] [Google Scholar]
- 15.Haynes CA, Allegood JC, Sims K, Wang EW, Sullards MC, Merrill AH., Jr Quantitation of fatty acyl-coenzyme As in mammalian cells by liquid chromatography-electrospray ionization tandem mass spectrometry. J Lipid Res. 2008;49:1113–1125. doi: 10.1194/jlr.D800001-JLR200. [DOI] [PMC free article] [PubMed] [Google Scholar]
- 16.Blachnio-Zabielska AU, Koutsari C, Jensen MD. Measuring long-chain acyl-coenzyme A concentrations and enrichment using liquid chromatography/tandem mass spectrometry with selected ion monitoring. Rapid Commun Mass Spectrom. 2011;25:2223–2230. doi: 10.1002/rcm.5110. [DOI] [PMC free article] [PubMed] [Google Scholar]
- 17.Mangino MJ, Zografakis J, Murphy MK, Anderson CB. Improved and simplified tissue extraction method for quantitating long-chain acyl-coenzyme A thioesters with picomolar detection using high-performance liquid chromatography. J Chromatogr. 1992;577:157–162. doi: 10.1016/0378-4347(92)80612-t. [DOI] [PubMed] [Google Scholar]
- 18.Clayton PT, Eaton S, Aynsley-Green A, Edginton M, Hussain K, Krywawych S, Datta V, Malingre HE, Berger R, van der Berg IE. Hyperinsulinism in short-chain L-3-hydroxyacyl-CoA dehydrogenase deficiency reveals the importance of beta-oxidation in insulin secretion. J Clin Invest. 2001;108:457–465. doi: 10.1172/JCI11294. [DOI] [PMC free article] [PubMed] [Google Scholar]
- 19.Molven A, Matre GE, Duran M, Wanders RJ, Rishaug U, Njølstad PR, Jellum E, Søvik O. Familial hyperinsulinemic hypoglycemia caused by a defect in the SCHAD enzyme of mitochondrial fatty acid oxidation. Diabetes. 2004;53:221–227. doi: 10.2337/diabetes.53.1.221. [DOI] [PubMed] [Google Scholar]
- 20.Stanley CA. Two genetic forms of hyperinsulinemic hypoglycemia caused by dysregulation of glutamate dehydrogenase. Neurochem Int. 2011;59:465–472. doi: 10.1016/j.neuint.2010.11.017. [DOI] [PMC free article] [PubMed] [Google Scholar]
- 21.Li C, Chen P, Palladino A, Narayan S, Russell LK, Sayed S, Xiong G, Chen J, Stokes D, Butt YM, Jones PM, Collins HW, Cohen NA, Cohen AS, Nissim I, Smith TJ, Strauss AW, Matschinsky FM, Bennett MJ, Stanley CA. Mechanism of hyperinsulinism in short-chain 3-hydroxyacyl-CoA dehydrogenase deficiency involves activation of glutamate dehydrogenase. J Biol Chem. 2010;285:31806–31818. doi: 10.1074/jbc.M110.123638. [DOI] [PMC free article] [PubMed] [Google Scholar]
- 22.He XY, Yang SY. 3-hydroxyacyl-CoA dehydrogenase (HAD) deficiency replaces short-chain hydroxyacyl-CoA dehydrogenase (SCHAD) deficiency as well as medium- and short-chain hydroxyacyl-CoA dehydrogenase (M/SCHAD) deficiency as the consensus name of this fatty acid oxidation disorder. Mol Genet Metab. 2007;91:205–206. doi: 10.1016/j.ymgme.2007.02.015. [DOI] [PubMed] [Google Scholar]
- 23.Wood PA, Amendt BA, Rhead WJ, Millington DS, Inoue F, Armstrong D. Short-chain acyl-coenzyme A deficiency in mice. Pediatr Res. 1989;25:38–43. doi: 10.1203/00006450-198901000-00010. [DOI] [PubMed] [Google Scholar]


