

Abstract
Custom-synthesized variants of the commercial Capto S resin were used to examine the effects of resin charge density and dextran content on protein adsorption and intraparticle uptake. For the small protein lysozyme, resin charge density had the greatest effect on equilibrium capacity, consistent with calculations suggesting that lysozyme capacity should be limited by the available charge on the resin. Isocratic retention data and confocal microscopy imaging for this protein revealed a consistent ordering of the resins linking stronger protein–resin interactions with higher static capacities but slower intraparticle uptake rates over the range of properties studied. For the larger protein lactoferrin, it was found that increasing dextran content led to increased protein exclusion from the dextran layer, but that increasing resin charge density helped overcome the exclusion, presumably due to the increased electrostatic attraction between the resin and protein. Collectively examining the lysozyme and lactoferrin data along with information from previous studies suggests that a trade-off in maximizing dynamic capacities should exist between static capacities that increase to a finite extent with increased resin charge density and uptake rates that decrease with increased charge density. Column breakthrough data for lysozyme and lactoferrin appear to support the hypothesis, though it appears that whether a resin charge density is low or high must be considered in relation to the protein charge density. Using these trends, this work could be useful in guiding resin selection or design.
Keywords: Ion exchange, Protein adsorption, Dextran-grafted agarose, Charge density, Confocal microscopy, Dynamic binding capacity
1. Introduction
Ion-exchange chromatography has played a major role in the purification of proteins for decades, and a wide variety of stationary phases have been developed for preparative separations. End users generally see only the final commercial products of resin development and are rarely privy to the results of any exploration of structural properties on separation performance, such as efforts to optimize characteristics of resin backbone materials, e.g. agarose, including selection of particle size, solid content [1–3], and rigidity [4]. Additionally, ligand chemistry must be chosen and optimized. Here we report the results of such a structure–function study in which the backbone and ligand chemistry remain fixed but the ligand density and its distribution are varied.
In traditional ion-exchange resins, functional groups are attached to the resin surfaces, leaving the charge density of the resin as the only variable considered. In previous studies using charge variants of traditional resins, increasing charge density was found to increase isocratic retention times and static capacities, but only to a finite extent as these quantities eventually reached threshold values [5,6]. Ligand density seemed to have little effect on maximum achievable dynamic binding capacities (DBCs) [2,6], consistent with the finding of little effect of ligand density on pore diffusivities [6].
Polymer-modified media are a newer class of resins in which secondary polymers extend from the resin surface. Depending on the chemistry used, functional groups may reside entirely on the secondary polymers, as is the case for Fractogel EMD SO3− [7] and HyperD [8], or may be divided between the secondary polymer and the resin backbone as for SP Sepharose XL (SP XL) [9] and Capto S. One of the original aims of the polymer-modified resins was to decouple the binding capacity of the resin from its surface area by increasing the accessibility of functional groups to biomolecules [7]. Several studies comparing traditional and polymer-modified resins have experimentally confirmed improved protein static capacities for the latter resin class [9–16]. Additionally, though, improved uptake rates [9,12–14,16–22] leading to high DBCs [12,13,21,22] have commonly been observed.
Given the interest in polymer-modified resins, systematic investigation of the effect of ligand density on various aspects of performance is appropriate. However, compared to the case for traditional particles, the amount of the secondary polymer is an additional variable for polymer-modified media, introducing further complexity. For variants similar to the commercial SP XL resin, little effect of resin charge density on achievable DBC values was discernible over the range of densities studied, but increased dextran content did seem to improve DBCs at lower salt concentrations under some conditions [3]. For variants based on the Fractogel EMD SO3− resin, DBCs as a function of resin ligand density were examined at a fixed solution condition and a new resin was designed to maximize DBCs [23]. However, the chemistry used in these variants does not allow truly independent study of ligand density and secondary polymer content [7], so high ligand densities lead to highly occluded pores [23], potentially complicating interpretation of observed performance. Additionally, the effect of salt concentration on DBCs was not considered, so the sensitivity of the optimization process is unknown since maximum DBCs as a function of salt are often encountered for both traditional [2,6] and polymer-modified resins [3,20–22,24].
In this work, a custom set of materials based on the commercial Capto™ S resin was used to examine the effects of charge density and dextran content on protein uptake and adsorption. One of the important motivating factors was to better explore what may contribute to observed differences between the commercial SP XL and Capto S resins. Previous work has shown that, while Capto has a charge density only about half that of XL, it tends to have comparable equilibrium capacities and often has better DBCs because of faster intraparticle uptake [22]. Thus the effect of charge density is expected to be especially important to examine.
2. Materials and methods
2.1. Buffers and protein solutions
All buffers and protein solutions were prepared as described previously [15]. Lysozyme and bovine lactoferrin were used as model proteins and all experiments were performed at pH 7 using 10 mM phosphate buffer with sodium chloride added as needed to adjust the total ionic strength (TIS). Additionally, some experiments on lysozyme were performed at pH 5 using 10 mM acetate and sodium chloride.
Human lactoferrin has been observed to oligomerize at low salt levels [25]. For the bovine lactoferrin used in this work, dynamic light scattering (Zetasizer, Malvern) yielded hydrodynamic diameters of 6.52, 5.74, and 6.91 nm at 20, 100, and 1520 mM TIS, respectively. These values seem consistent with the value of 6.66 nm that has been reported [26] for monomers of human lactoferrin, which is structurally quite similar to bovine lactoferrin [27]. Therefore, bovine lactoferrin seems to exist primarily in monomeric form under the solution conditions used in this work.
Cy5 fluorescent dye (GE Healthcare, Piscataway, NJ) and the spectrally similar DyLight 649 fluorescent dye (Thermo Fisher Scientific, Waltham, MA) were used in confocal microscopy studies. To label the proteins, solutions were prepared with roughly 20 mg/mL protein in 10 mM phosphate, pH 7 buffer with sodium chloride added to adjust the TIS as needed. These solutions were added to vials of unreacted dye and were slowly rotated for 30 or 60 min for Cy5 or DyLight 649, respectively. The protein–dye conjugates were recovered by visually collecting the first peak to elute under gravity flow from a 30 cm × 1.0 cm i.d. column gravity packed with Sephadex G-25 size-exclusion particles equilibrated in the desired buffer. Alternatively, conjugates were recovered using 10 kDa Amicon Ultra4 centrifugal filters from Millipore (Billerica, MA) by concentrating and rediluting with fresh buffer three times. Initial labeling resulted in an average of less than one dye molecule per protein molecule, suggesting that few protein molecules would have more than one label. Prior to use, labeled protein solutions were diluted with unlabeled protein to achieve a molar dye to protein ratio of 1:50 or less.
2.2. Resins
The resins used were custom synthesized by GE Healthcare (Uppsala, Sweden) on the Capto backbone material. Controlled amounts of dextran were attached to this agarose base matrix prior to functionalization with sulfoethyl functional groups. Added dextran amounts and ligand densities were determined by GE Healthcare.
Properties of the functionalized Capto S variants are shown in Table 1. During the course of the work, it was determined that a few iterations of resin properties would be informative. The first two iterations were produced by GE Healthcare, as were the UD-B1 and UD-B4 resins, shown as part of the third iteration. The remaining resins in the third iteration were produced by introducing additional sulfoethyl functional groups onto either UD-B1 or UD-B4. The additional functionalization was necessary to achieve the desired range of charge densities at one fixed value for the dextran content, as is discussed later.
Table 1.
Properties of functionalized Capto S variants.
| Iteration | Resin ID | Dextran amount (mg/mL) |
Ligand density (μmol/mL) |
|---|---|---|---|
| 1 | UD5 | 10 | 127 |
| UD6 | 15 | ||
| UD7 | 15 | 125 | |
| UD8 | 15 | 151 | |
| UD9 | 20 | 129 | |
| 2 | UD10 | 23 | 50 |
| UD11 | 23 | 220 | |
| 3 | UD-B1 | 15.8 | 38 |
| UD-B2 | 15.8 | 60 | |
| UD-B3 | 15.8 | 104 | |
| UD-B4 | 15.8 | 158 | |
| UD-B5 | 15.8 | 162 | |
| UD-B6 | 15.8 | 224 |
Probably the simplest way to introduce sulfoethyl groups onto polysaccharides, such as dextran and agarose, is through the reaction of sodium vinyl sulfonate (SVS) with the pendant hydroxyl groups of the polysaccharides at high pH [28,29]. Here, the method of Axén et al. [30] was adapted. In each of two 15 mL tubes a volume of 3 mL of settled particles was rinsed with DI water. The supernatants were removed and replaced with 6 mL of 25% SVS (Monomer–Polymer and Dajac Labs, Trevose, PA) three times. Hydroquinone monomethyl ether (MEHQ) included in the purchased SVS solution served only to inhibit self-polymerization of the SVS and proved not to prevent the desired functionalization reaction. The supernatants were removed and the particles were combined in one tube. The total volume was brought to 7.8 mL by adding fresh SVS solution. To this, 6 mL of a 50% (w/w) sodium hydroxide solution was added to initiate the reaction. The tube was rotated end over end at 50 °C and then the reaction was stopped by rinsing the particles thoroughly with DI water. Reaction times varied depending on the desired amount of functionalization. For example, reaction times for creating UD-B2 (60 μmol/mL) and UD-B3 (104 μmol/mL) from UD-B1 (38 μmol/mL) were 1 and 3.5 h, respectively.
After functionalization, the charge density of each resin was determined by titration. While the method suggested by Stone and Carta [9] proved preferable in some respects, the method of Axén et al. [30] was used to maintain self-consistency in estimates among all resins used. A titration of UD-B4 was performed, yielding an estimated ligand density of 159 μmol/mL compared to the provided value of 158 μmol/mL, verifying consistency between operators. Charge densities in Table 1 are as provided by GE Healthcare for the resins they provided and are as determined by our own titration for the additional resin variants.
2.3. Capillary tube calibration and adsorption isotherms
As described in previous work [15], a calibration factor was required to dose known volumes of resin from Wiretrol II 100 and 200 μL capillary tubes (Drummond Scientific Company, Broomall, PA). In this work, the same procedure was followed with the modification that calf thymus DNA (EMD Chemicals Inc., Gibbstown, NJ) was used as the extraparticle tracer in place of blue dextran because the former gave peaks with less tailing than did the latter. Calibration factors were determined for UD5–UD9 and were all quite similar, with no apparent trends with dextran or functional group content. Therefore, the mean value of 2.48 μL hydrated particle volume per mm settled capillary tube height was used as the calibration factor for each of these resins. The calibration factor was used primarily for the adsorption isotherms, which were performed as described previously [15].
2.4. Isocratic retention and column breakthrough
Column experiments were performed using AP Minicolumns (Waters Corporation, Milford, MA). These columns have an inner diameter of 0.5 cm and a nominal column volume of 1 mL. Actual packed bed heights ranged from 4.6 to 5.0 cm, corresponding to a volume range of 0.90–0.98 mL.
Isocratic retention experiments were performed as described previously [15]. For lysozyme, experiments were performed between 0.18 and 1.52 M TIS, while the range for lactoferrin spanned 0.52–1.52 M.
For column breakthrough experiments, an ÄKTA Explorer 100 workstation (GE Healthcare) was used. The sample pump was employed to load 2 mg/mL protein at a low superficial linear velocity of 120 cm/h on previously equilibrated columns. The tubing dead volume was reduced to 0.33 mL compared to the value of 1.1 mL in previous work on the same system [22].
2.5. Confocal microscopy imaging
Confocal laser scanning microscopy was used to monitor the intraparticle uptake of 2 mg/mL labeled protein into the resins as described previously [22]. A Zeiss 5 Live laser scanning microscope (Carl Zeiss, Germany) equipped with a 40× C-Apochromat (NA 1.2) water-immersion lens (Carl Zeiss) was used in place of the Zeiss 510 used in the previous work as the 5 Live allowed significantly faster imaging.
3. Results and discussion
3.1. Adsorption isotherms
In previous work [15] we sought to relate the maximum protein adsorption capacities of dextran-modified resins to physical characteristics of the resins and the proteins. Generally, it was found that the amount of protein that could be packed into the volume of the dextran layer was a good predictor of capacity. However, for the case where the protein charge density was high and the resin charge density was low, as was the case for adsorption of lysozyme on the commercial Capto S resin, it was found that a simple electroneutrality balance between total resin charge and total protein charge gave the best prediction of capacity. These observations provide a useful framework for interpretation of adsorption isotherms for the Capto variants.
Here, adsorption isotherms were measured using the first iteration of resins; the results are shown in Fig. 1. When examining the results, it is helpful to keep in mind that UD5, UD7, and UD9 are the resins with increasing dextran content at a medium charge density and that UD6, UD7, and UD8 are the resins with increasing charge density at a medium dextran content (see Table 1). Starting with lysozyme at 20 mM TIS, it is clear that the resin charge density has a stronger effect on the equilibrium capacity than dextran content. The increases in the lysozyme capacity with increasing resin charge density are consistent with previous calculations [15], though the calculations suggest that that the capacity would eventually plateau at even higher charge densities as was experimentally observed in other studies [5,6]. For lysozyme at 100 mM TIS, capacities are lower and the isotherms are softer than at 20 mM TIS, but the ordering of resins remains the same.
Fig. 1.

Adsorption isotherms for indicated pairs of protein and TIS on Capto S variants. Resins are identified by the legend in the top left panel. Langmuir isotherm fits are included to guide the eye.
For the lactoferrin isotherms, there is no clear trend between capacity and either dextran content or charge density. This is consistent with previous calculations [15] that suggested that available binding volume might limit capacity, although some degree of experimental error could be involved in the ordering of the resins. However, since the lactoferrin capacities of UD5 and UD8 seem to be paired at both 20 and 100 mM TIS while the capacities of the other three resins seem to exhibit their own grouping at both salt levels, it seems unlikely that the differences between the resins are due solely to experimental error in the isotherms. Rather, additional factors could contribute to the ordering of the low-salt data; for example, the resin with the lowest dextran content, UD5, is one of the two lower-capacity resins, perhaps indicating that the binding volume in the dextran is somewhat reduced for this low dextran content. The other low-capacity resin is UD8, which has the highest charge density, perhaps indicating that the functional groups occupy enough volume within the dextran layer so as to reduce the volume available to protein. However, this possibility seems less likely than a dextran-volume effect for UD5, so there may be subtle differences between the variants for which we have not accounted that contribute to the observed behavior.
Unlike the case for lysozyme, an increase of ionic strength for lactoferrin leads to a reordering of capacities. Specifically, UD5 (lowest dextran content) and UD8 (highest charge density) have the lowest capacities at 20 mM TIS, but they both retain their capacities better with the increase of salt than do the other three resins. The reason for the reordering of capacities with increased salt perhaps becomes more clear when the lactoferrin isocratic retention data are examined.
3.2. Isocratic retention
Isocratic retention data are shown in Fig. 2. As in our previous work [15], it was found that lactoferrin could be excluded from the dextran layer of the resins at high salt, while lysozyme was not. As was discussed previously, lactoferrin does not seem to oligomerize under relevant conditions, so its exclusion seems to be due to the size of the monomer itself. In light of the different behavior for the two proteins, the lysozyme data (Fig. 2a) are plotted in terms of retention factors while raw retention times are used for lactoferrin (Fig. 2b) to avoid the confounding effect of the high-salt exclusion. For lysozyme, the retention factors show the same ordering of resins as for the lysozyme isotherms (Fig. 1), i.e. higher retention factors or stronger adsorption strengths correspond to higher adsorption capacities. Such an ordering is consistent with previous work on charge variants for traditional particles [6]. However, changes in retention factors and adsorption capacities occurred over a smaller range for those traditional particles, consistent with the hypothesis that their capacities would be limited by available surface area [31] rather than by resin charge density or dextran volume as for the polymer-modified media in this work [15].
Fig. 2.

Isocratic retention data for Capto S variants showing (a) retention factors for lysozyme and (b) retention times for lactoferrin. Resins are identified by the legend in (a).
For isocratic retention of lactoferrin, it is assumed based on the short retention times and previous work [15] that the protein is excluded from the dextran layer at the highest salt condition of 1.52 M TIS. That is, the protein accesses only the extraparticle space and portions of the intraparticle pore space not reached by the dextran surface extenders. The exclusion at the highest salt level is quite clear, as for UD8, for example, lactoferrin elutes at 54% of the column volume compared to 74% for lysozyme and 85% for acetone in water. As salt was decreased, retention times and peak tailing (not shown) both increased, suggesting that protein began to adsorb to the surface of the dextran layer and/or began to penetrate the dextran layer. The peak tailing in particular could indicate that most of the protein was still excluded from the dextran layer but that a small fraction did penetrate and was more highly retained once inside. Certainly, when salt is reduced to the levels considered in the adsorption isotherms, it seems that lactoferrin can freely penetrate the dextran layer based on the high observed static capacities, but it is hard to determine definitively over what salt concentration range the transition in penetrability occurs.
If protein is assumed to gradually penetrate more of the dextran layer as salt is decreased, some indication of the degree of high-salt exclusion as a function of dextran content and charge density of the resin should be obtainable from differences in the response of the resins to changes in salt. High-salt exclusion can be examined quantitatively at 1.52 M TIS, as is done shortly, but some of the same trends emerge when considering the ordering of the resins at moderate salt concentrations (below 0.72 M TIS, say) where differences in retention become more apparent. Specifically, two trends are observed. First, the data show that increasing charge density (UD6 < UD7 < UD8) leads to increased retention, which is presumably indicative of decreased exclusion, as the protein can better access the functional groups within the dextran layer. On the other hand, since retention times decrease with increasing dextran content (UD5 < UD7 < UD9), it appears that increasing dextran content increases high-salt exclusion. As is discussed in Section 3.3, charge density and dextran content effects might be somewhat confounded for these three variants, so the charge density within the dextran of UD9 is expected to be higher than in UD5. If this charge density effect were more significant than the dextran content effect, the results for the increasing charge density resins suggest that exclusion should be more severe for UD5 than for UD9. However, the dextran content effect seems to be dominant since the opposite is observed (more exclusion from UD9). Thus, it seems that the high-salt exclusion is largely a steric effect, but that a sufficient electrostatic driving force can overcome the exclusion. This exclusion effect is likely responsible for UD5 and UD8 retaining their lactoferrin capacities better than the other resins when the TIS is increased from 20 to 100 mM (see Fig. 1) as the isocratic retention data show that these two resins are the least susceptible to the exclusion.
It is also informative to examine accessible fractions of the particles for the two proteins (Table 2), determined at 1.52 M TIS in order to examine the severity of the high-salt exclusion. This high TIS value allowed investigation under non-binding conditions, but could also result in some collapse of the dextran extenders, as was observed for SP XL [14]. Such a collapse would make the dextran layer harder to penetrate than it would be in a more expanded state at lower salt, so the trends in accessible fractions with respect to resin properties are perhaps more meaningful than their exact values. These fractions are calculated based on the additional column volume that the protein accesses compared to the extraparticle volume accessed by calf thymus DNA. Specifically, the accessible fraction of the particle volume, ∊p,acc, is given by
| (1) |
where VR is the retention volume of the protein (corrected for the system dead volume), Vc is the column volume, and ∊ is the extraparticle void fraction determined from DNA injections.
Table 2.
Fractions of total particle volume accessible, ∊p,acc, by lysozyme and lactoferrin at 1.52 M TIS.
| Resin | Lysozyme | Lactoferrin |
|---|---|---|
| UD5 | 0.69 | 0.32 |
| UD6 | 0.65 | 0.27 |
| UD7 | 0.62 | 0.25 |
| UD8 | 0.57 | 0.24 |
| UD9 | 0.56 | 0.21 |
| SP FFa | 0.69 | 0.65 |
| UD1 | NA | 0.74 |
Estimated from inverse size-exclusion chromatography data [32] for dextran probes of similar sizes to those of lysozyme and lactoferrin.
In Table 2, two reference materials are used for baseline comparisons, namely SP Sepharose FF (SP FF), which has a similar resin backbone to that of Capto, but without the dextran extenders, and UD1, which is the base material for UD5–UD9, but without any dextran or functional groups. It is apparent from the lactoferrin data that SP FF and UD1 have similarly high accessible fractions, though direct quantitative comparison is not appropriate because the SP FF data are estimated from inverse size-exclusion chromatography data [32] while the UD1 value is determined directly from lactoferrin accessibility. The SP FF data also show that lactoferrin and lysozyme access similar fractions in the absence of dextran extenders. However, when comparing accessible fractions for UD5–UD9, it is clear that there are differences between the two proteins. For lysozyme, the accessible fraction decreases modestly from the SP FF value (and the assumed similar UD1 value) with increased dextran or functional group content. For lactoferrin, on the other hand, the presence of even the lowest dextran content (UD5) significantly reduces the accessible fraction compared to that in UD1. Only modest additional decreases are observed as dextran or functional group content is increased, though. For both proteins, dextran content seems to have a greater effect than charge density over the range of values studied. Considering these trends, it is perhaps more clear than from the raw isocratic retention data that lactoferrin is significantly excluded from the dextran layer of the resins at high salt while the smaller lysozyme is not.
3.3. Confocal microscopy
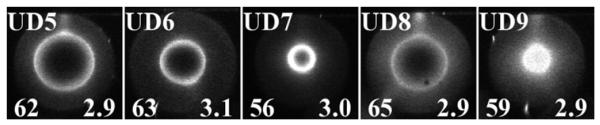
Confocal microscopy imaging can help elucidate the nature of protein uptake into chromatography particles. The results for 2 mg/mL Cy5-labeled lysozyme loading at 100 mM TIS on the variants UD5–UD9 are shown in Fig. 3. The first four images for each resin show uptake progress at similar times while the final image for each resin shows the rough saturation time. For all resins, it is clear that relatively diffuse uptake fronts are encountered, qualitatively consistent with homogeneous diffusion, so diffusivities could not be determined straightforwardly from the uptake profiles [33]. Increasing values of resin charge density (UD6 < UD7 < UD8) appear to lead to longer saturation times, but for dextran content the effect of increasing values (UD5 < UD7 < UD9) is not monotonic, as uptake is fastest at the intermediate dextran content (UD7). The reason for the nonmonotonic behavior may be that dextran content is somewhat confounded with resin charge density, even though UD5, UD7, and UD9 have roughly the same charge densities. An important consideration here is that the functional groups may partition differently between the agarose backbone and the dextran extenders when different amounts of dextran are present. That is, for a fixed number of functional groups being added, presumably a larger fraction of the functional groups are introduced onto the dextran when the dextran content is higher. Thus, UD5, UD7, and UD9 might have significant differences in charge density within their dextran layers even though their total charge densities are roughly the same.
Fig. 3.

Confocal microscopy images (xz scans) of Cy5-labeled lysozyme uptake at 100 mM TIS on Capto S variants. Resins are identified in the bottom right for each time series. Particle sizes are indicated by the scale bar in each panel and uptake times in minutes are indicated at the bottom left for each image. Gain settings vary between images, so intensities are not appropriate indicators of adsorbed concentrations, even in relative terms.
Considering the ordering of all of the resins in terms of rough saturation time, it is apparent that essentially the same order found for the lysozyme isotherms (Fig. 1) and isocratic retention data (Fig. 2a) is recovered. The one exception is a possible switch of UD8 and UD9, but the bubble observed for UD8 interfered a bit with the determination of saturation, and it is believed that UD8 has the longer saturation time. Thus, the consistent ordering of the resins suggests that adsorption strength, adsorption capacity, and uptake rates are all related. Uptake consistent with homogeneous diffusion was already suggested visually by the diffuse uptake profiles (Fig. 3) and the link between stronger adsorption and slower uptake is also consistent with such a description of the lysozyme uptake. Specifically, in homogeneous diffusion, both adsorbed and unadsorbed protein molecules are considered free to diffuse. If adsorption strength is increased, the protein will spend a greater fraction of its time bound to the resin, reducing the rate of progress into the particle [34,35].
Uptake results for 100 mM TIS lactoferrin labeled with DyLight 649 are shown in Fig. 4. For this condition uptake was very rapid for all resins, so trends with respect to resin properties were not apparent. The resins all show relatively sharp uptake fronts and the presence of a concentration overshoot at the uptake front that is presumably due to displacement of the labeled lactoferrin by unlabeled protein [22,36]. While the sharp uptake profiles are visually consistent with a shrinking-core description of uptake, previous work suggests caution in this interpretation as evidence was found that the adsorbed concentration may slowly increase behind the sharp uptake front in a more complicated process [22]. The fact that a sharp, yet rapidly moving uptake front is encountered might be explained, at least in part, by an electrostatic coupling of the diffusion rates of the protein and Na+ counterions that results in enhanced protein uptake rates [37,38]. However, the heterogeneity of the dextran-grafted agarose materials complicates the application of such an analysis [38].
Fig. 4.
Confocal microscopy images (xz scans) of uptake of 100 mM TIS lactoferrin on Capto S variants using DyLight 649 labeling. Uptake progress is shown after roughly 3 min for each resin. Precise uptake times in minutes are shown in the bottom right of each image, while particle diameters in μm are shown in the bottom left of each image. Gain settings vary between images, so intensities are not appropriate indicators of adsorbed concentrations, even in relative terms.
3.4. Column breakthrough behavior
Column breakthrough behavior is often characterized by the DBC, which is a complex quantity reflecting both equilibrium and kinetic factors. Previous work comparing the commercial SP XL and Capto S resins showed that Capto S generally had higher achievable DBCs due to improved uptake rates [22]. While differences in the base matrix could certainly contribute to the performance advantage of Capto S, it was also speculated that the higher charge density of SP XL was the primary physical factor involved [22]. Several other observations are relevant in the speculation about the effect of charge density on DBC trends. For example, previous work suggests that increasing the ligand density of resin only increases the equilibrium capacity to a finite extent [5,6,39] as the resin presumably transitions from a case where capacity is limited by ligand density when the density is low to being limited by available volume for binding when the density is increased sufficiently [22]. Since the lysozyme confocal data (Fig. 3) show that apparent saturation times increase with increasing ligand density, there presumably exist conditions where increasing ligand densities will yield no gain in equilibrium capacity and will slow intraparticle uptake, giving a decreased DBC. Thus, it was hypothesized that an intermediate resin charge density would allow the highest possible DBC to be achieved.
The hypothesis that an intermediate charge density could give rise to the highest global DBC value as a function of salt concentration is perhaps more easily understood by considering DBC curves for a low, medium, and high charge density resin, as shown in Fig. 5. For the low charge density, the resin charge density would limit the maximum capacity and the DBC values would decrease monotonically with increasing salt, as was previously found for lysozyme on Capto S [22]. For the two higher charge density resins, the ligand density would no longer limit the equilibrium capacity, but the density would limit the uptake rates at low salt, yielding low DBC values. As has been observed experimentally for a number of systems [20–22,24], maximum DBC values may occur at intermediate salt concentrations, where improved transport and reduced equilibrium capacity are balanced. For higher charge densities, maximum DBC values should shift down and to the right as higher salt concentrations are needed to improve uptake rates. Thus, at an intermediate resin charge density, the highest global DBC value among all resins would be expected. Such results would be consistent with previous observations that Capto S could have higher global DBC values than the more highly functionalized SP XL resin [22]. The fact that previous work on similar variants did not find a significant effect of ligand density on maximum DBCs [3] could simply be due to the fact that ligand densities as high as that in SP XL were not considered.
Fig. 5.

Speculated DBC trends for resins with indicated relative charge densities. Units are not shown because behavior is relative to resin and protein properties, but maximum DBCs on the order of 100–200 mg/mL col. and TIS values of up to a few hundred mM give a reasonable frame of reference.
3.4.1. Resin subset selection
A cohesive set of resins with controlled charge density was needed to test the hypothesized DBC trends. While UD5–UD9 were used for the earlier portions of this study, it was clear that the sequence of UD6–UD8 was not sufficient because one of the goals was to capture a range of charge densities that went as high as the values for the commercial SP Sepharose XL resin (180–250 μmol/mL).
Fig. 6a shows some of the preliminary lactoferrin DBC data used in selecting the appropriate resin subset. Specifically, the similar resins UD8, UD-B4, and UD-B5 are compared, along with the high dextran content resins UD10 and UD11. Comparing UD8 with UD-B4, it is apparent that even small differences in dextran content or charge density can lead to significant shifts in DBC curves. The difference in these curves suggested that the 15 mg/mL and 15.8 mg/mL dextran resin were not directly comparable, as the data for the 15.8 mg/mL seem to be shifted to the left. Comparing the UD-B5 data with the UD11 data reveals similar DBC curves, suggesting that the effects of the higher dextran content and charge density of UD11 largely balance out, making the individual effect of charge density difficult to determine. Thus, it was decided to create one set of resins with varied charge density, all at 15.8 mg/mL dextran, in order to fulfill the requirements of the cohesive set of resins. To ensure that our functional group additions gave resins with similar properties to those originally provided by GE Healthcare, functional groups were added to UD-B1 (38 μmol/mL) targeting the charge density of UD-B4 (158 μmol/mL), yielding UD-B5 (162 μmol/mL). The similar behavior of UD-B5 and UD-B4 in Fig. 6a suggests that our functional group additions were comparable to those by GE Healthcare. After generating the appropriate resins in the third iteration (Table 1), resins UD-B1, UD-B3, UD-B5, and UD-B6 (38, 104, 162, and 224 μmol/mL, respectively) were selected as the subset with which to investigate column breakthrough behavior more systematically.
Fig. 6.

DBCs for Capto S variants as a function of TIS at pH 7 for lactoferrin and pH 5 for lysozyme. (a) Preliminary lactoferrin comparisons for the similar resins UD8, UD-B4, and UD-B5, and for the high dextran content resins UD10 and UD11. The UD-B5 data are shown with filled black points as a reminder that they appear again in (b) as the 162 μmol/mL data. (b) Lactoferrin and (c) lysozyme DBC trends on 15.8 mg/mL dextran resins with indicated charge densities.
3.4.2. DBCs as a function of resin charge density
Fig. 6b and c show the respective DBC trends for lactoferrin and lysozyme. For lactoferrin, the resin of lowest charge density has its maximum DBC value at the lowest tested salt condition. As the charge density increases, though, the maximum DBC shifts both downward and to higher salt concentrations. For lysozyme the trends are somewhat similar, but the behavior seems to occur over a different range. That is, higher charge densities seem to be needed for lysozyme in order to reach the point where the DBC curves transition from monotonically decreasing to having a maximum DBC at an intermediate salt concentration.
The differences in the DBC curves between the two proteins reflect a few important features. First, the data for the 38 μmol/mL resin show that, while both curves are monotonically decreasing, the DBCs are significantly lower for lysozyme than for lactoferrin. Previously it has been observed that values in the descending portion of DBC curves are primarily limited by the equilibrium capacity of the resin [22]. Since previous calculations [15] suggest that the equilibrium capacity of the lower charge density resins should be limited by resin charge density for lysozyme, but not for lactoferrin, the lower lysozyme DBC values on the 38 μmol/mL resin are an expected consequence of limited equilibrium capacity values. A second important feature when comparing the DBC curves of the two proteins is the effect of high-salt exclusion. As discussed previously, this phenomenon is expected to rapidly decrease the equilibrium capacity of the resins for lactoferrin but not for lysozyme as the salt concentration increases. The result is that lysozyme DBC curves as a function of ionic strength (Fig. 6c) tend to be broad, while the lactoferrin curves drop more dramatically as salt is increased. The final important point of comparison between the two proteins is in the low-salt DBCs. For the ascending portion of the DBC curves, previous results [22] suggest that DBC values are limited by intraparticle uptake rates rather than by equilibrium capacity. Thus, the fact that the low-salt lactoferrin DBC values decrease with increasing resin charge density is indicative of decreasing uptake rates.
Comparison of the speculated and experimental DBC curves (Figs. 5 and 6, respectively) appears to confirm the hypothesized trends. For lactoferrin (Fig. 6b), similarly high maximum DBC values are obtained for the three lowest charge density variants, but the maximum DBC for the highest density resin is noticeably lower. For lysozyme (Fig. 6c), the highest global DBC value is obtained at the highest charge density, but this likely means that this curve would qualify as a medium relative charge density when compared to the speculated curves in Fig. 5.
3.4.3. Breakthrough shape
While this work focused primarily on trends in DBC values with respect to salt concentration and resin charge density, it is informative to look at the more detailed forms of breakthrough curves. For example, Fig. 7 shows breakthrough curves for lactoferrin loading on UD8 (a) and UD-B5 (b). As is commonly encountered [22,40,41], the curves tend to be steeper and approach unity more quickly as the salt concentration is increased, but the equilibrium capacity also drops. These curves also exemplify the pronounced kink around the transition from a nearly linear initial breakthrough portion to a steeper region that was encountered in previous experimental data on polymer-modified resins [22,23]. Such data are consistent with possible breakthrough curve shapes predicted by a partial shrinking-core model, which accounts for sharp uptake fronts found in confocal imaging, but with a slow approach to equilibrium controlled by a linear driving force (LDF) that fills in behind the shrinking-core front [22].
Fig. 7.

Breakthrough curves for lactoferrin loading on (a) UD8 and (b) UD-B5. Data are for total ionic strengths of 50 (–), 100 (- - -), and 200 mM (- · - · -).
Such kinked behavior could also be indicative of channeling in the columns (see, for example, [42] for discussion). However, packing tests, using 2% (w/v) acetone in water, run before and after the breakthrough curves shown in Fig. 7 do not seem consistent with channeling (i.e. having values of the asymmetry factor, As, significantly lower than unity). For example, peaks for UD8 give an estimate of around 2700 plates per meter with respective asymmetry values of As = 1.14 and As = 1.15 before and after the breakthrough data were generated. Peaks for UD-B5 give an estimate of around 2100 plates per meter with respective asymmetry values of As = 0.98 and As = 0.95 before and after the runs. The kinked behavior seems more pronounced for the higher asymmetry values, so packing may contribute to the behavior, but does not seem to be solely responsible for it. Furthermore, packing effects would not explain why such kinks were observed for the dextran-modified resins used in previous work, but not for the unmodified resin [22].
While the partial shrinking-core model likely could be used to fit the breakthrough data here, doing so would be of limited value as there are no additional data for breakthrough at other flow rates or batch uptake to assess the suitability of the fits as was done previously [22]. Kinked breakthrough curves were also encountered for lysozyme (not shown) under conditions where diffuse fronts were observed in confocal microscopy, suggesting that a model similar to the partial shrinking-core model, but combining homogeneous diffusion with the LDF, may be conceptually appropriate.
4. Conclusions
The effects of dextran content and resin charge density on protein uptake and adsorption have been studied for variants of the commercial Capto S ion-exchange media. However, the effect of dextran content could not be satisfactorily investigated as this factor was found to be potentially confounded with the distribution of functional groups between the resin backbone and the dextran extenders. Therefore, an effect of polymer content might be better examined by using a resin such as HyperD that carries all of its functional groups on its secondary polymers and none on the resin backbone. The effect of resin charge density was more easily studied and the results support our hypothesis [22] that this factor can account for the higher achievable DBC values for larger proteins on Capto S compared to those for the higher charge density SP XL resin. Unfortunately, these experiments do not clarify why lysozyme seemed to reach saturation more rapidly on XL than on Capto [22], leaving open the possibility that differences in the structure of the agarose backbone of the two resins could be at play.
Based on the column effects observed in this work, some interesting consequences for resin design or selection arise. For a small, highly charged protein like lysozyme, the effect of the resin charge density appears much more important than the dextran content. However, for a protein such as lactoferrin that can be excluded from the dextran layer at high salt, breakthrough behavior was quite sensitive to dextran content, with lower dextran contents seemingly allowing operation over a larger window of salt concentrations. If a protein has a relatively high charge density, as does lysozyme, high charge density resins are desirable, but more generally an intermediate charge density resin will allow operation over a broader range. These trends suggest that it may be of benefit to have variations of resin available to best suit the loading of a given protein.
Acknowledgements
We thank GE Healthcare for providing the ion-exchange resins and DMV-International for donating the lactoferrin. We also thank Kirk Czymmek and Jeffrey Caplan for guidance on the confocal microscopy imaging, the facility for which is supported by NIH COBRE grant number P30 RR031160 from the National Center for Research Resources. We are grateful for financial support from the NSF (grant CBET-0828590) and the NIH (grant R01 GM75047).
References
- [1].Schirmer EB, Carta G. AIChE J. 2009;55:331. [Google Scholar]
- [2].Hardin AM, Harinarayan C, Malmquist G, Axén A, van Reis R. J. Chromatogr. A. 2009;1216:4366. doi: 10.1016/j.chroma.2008.08.047. [DOI] [PMC free article] [PubMed] [Google Scholar]
- [3].Hart DS, Harinarayan C, Malmquist G, Axén A, Sharma M, van Reis R. J. Chromatogr. A. 2009;1216:4372. doi: 10.1016/j.chroma.2008.11.083. [DOI] [PubMed] [Google Scholar]
- [4].Berg H. 6,602,990 United States Patent. 2003
- [5].Wu DL, Walters RR. J. Chromatogr. 1992;598:7. [Google Scholar]
- [6].Langford JF, Jr., Xu X, Yao Y, Maloney SF, Lenhoff AM. J. Chromatogr. A. 2007;1163:190. doi: 10.1016/j.chroma.2007.06.028. [DOI] [PMC free article] [PubMed] [Google Scholar]
- [7].Müller W. J. Chromatogr. 1990;510:133. [Google Scholar]
- [8].Boschetti E, Coffman JL. In: Bioseparation and Bioprocessing. Subramanian G, editor. Wiley-VCH; New York, NY: 1998. [Google Scholar]
- [9].Stone MC, Carta G. J. Chromatogr. A. 2007;1146:202. doi: 10.1016/j.chroma.2007.02.041. [DOI] [PubMed] [Google Scholar]
- [10].Müller W. Eur. J. Biochem. 1986;155:213. doi: 10.1111/j.1432-1033.1986.tb09479.x. [DOI] [PubMed] [Google Scholar]
- [11].Janzen R, Unger KK, Müller W, Hearn MTW. J. Chromatogr. 1990;522:77. [Google Scholar]
- [12].Staby A, Jensen IH. J. Chromatogr. A. 2001;908:149. doi: 10.1016/s0021-9673(00)00999-7. [DOI] [PubMed] [Google Scholar]
- [13].Staby A, Sand MB, Hansen RG, Jacobsen JH, Andersen LA, Gerstenberg M, Bruus UK, Jensen IH. J. Chromatogr. A. 2004;1034:85. doi: 10.1016/j.chroma.2004.01.026. [DOI] [PubMed] [Google Scholar]
- [14].Hubbuch J, Linden T, Knieps E, Ljunglöf A, Thömmes J, Kula MR. J. Chromatogr. A. 2003;1021:93. doi: 10.1016/j.chroma.2003.08.112. [DOI] [PubMed] [Google Scholar]
- [15].Bowes BD, Koku H, Czymmek KJ, Lenhoff AM. J. Chromatogr. A. 2009;1216:7774. doi: 10.1016/j.chroma.2009.09.014. [DOI] [PMC free article] [PubMed] [Google Scholar]
- [16].Bowes BD, Petroff MG, Lenhoff AM. in preparation.
- [17].Ljunglöf A, Thömmes J. J. Chromatogr. A. 1998;813:387. doi: 10.1016/s0021-9673(98)00378-1. [DOI] [PubMed] [Google Scholar]
- [18].Hubbuch J, Linden T, Knieps E, Thommes J, Kula M. Biotechnol. Bioeng. 2002;80:359. doi: 10.1002/bit.10500. [DOI] [PubMed] [Google Scholar]
- [19].Hubbuch J, Linden T, Knieps E, Thömmes J, Kula MR. J. Chromatogr. A. 2003;1021:105. doi: 10.1016/j.chroma.2003.08.092. [DOI] [PubMed] [Google Scholar]
- [20].Ljunglöf A, Lacki KM, Mueller J, Harinarayan C, van Reis R, Fahrner R, Van Alstine JM. Biotechnol. Bioeng. 2007;96:515. doi: 10.1002/bit.21124. [DOI] [PubMed] [Google Scholar]
- [21].Harinarayan C, Mueller J, Ljunglöf A, Fahrner R, Van Alstine J, van Reis R. Biotechnol. Bioeng. 2006;95:775. doi: 10.1002/bit.21080. [DOI] [PubMed] [Google Scholar]
- [22].Bowes BD, Lenhoff AM. J. Chromatogr. A. 2011;1218:4698. doi: 10.1016/j.chroma.2011.05.054. [DOI] [PubMed] [Google Scholar]
- [23].Franke A, Forrer N, Butte A, Cvijetic B, Morbidelli M, Joehnck M, Schulte M. J. Chromatogr. A. 2010;1217:2216. doi: 10.1016/j.chroma.2010.02.002. [DOI] [PubMed] [Google Scholar]
- [24].Pabst TM, Suda EJ, Thomas KE, Mensah P, Ramasubramanyan N, Gustafson ME, Hunter AK. J. Chromatogr. A. 2009;1216:7950. doi: 10.1016/j.chroma.2009.09.040. [DOI] [PubMed] [Google Scholar]
- [25].Nevinskii AG, Soboleva SE, Tuzikov FV, Buneva VN, Nevinsky GA. J. Mol. Recognit. 2009;22:330. doi: 10.1002/jmr.952. [DOI] [PubMed] [Google Scholar]
- [26].Bowen WR, Cao XW, Williams PM. Proc. R. Soc. Lond. Ser. A. 1999;455:2933. [Google Scholar]
- [27].Sharma AK, Karthikeyan S, Sharma S, Yadav S, Srinivasan A, Singh TP. In: Advances in Lactoferrin Research. Spik G, editor. Plenum Press; New York: 1998. [Google Scholar]
- [28].Robyt JF. Essentials of Carbohydrate Chemistry. Springer-Verlag; New York: 1998. [Google Scholar]
- [29].Felcht U-H. In: Cellulose and Its Derivatives. Kennedy JF, Phillips GO, Wedlock DJ, Williams PA, editors. John Wiley & Sons; New York: 1985. [Google Scholar]
- [30].Axén A, Glad G, Ihre H, Larsson A, Norrman N. WO 2007027139 International Patent Application. 2007
- [31].Yao Y, Lenhoff AM. J. Chromatogr. A. 2006;1126:107. doi: 10.1016/j.chroma.2006.06.057. [DOI] [PubMed] [Google Scholar]
- [32].DePhillips P, Lenhoff AM. J. Chromatogr. A. 2000;883:39. doi: 10.1016/s0021-9673(00)00420-9. [DOI] [PubMed] [Google Scholar]
- [33].Dziennik SR, Belcher EB, Barker GA, DeBergalis MJ, Fernandez SE, Lenhoff AM. Proc. Natl. Acad. Sci. U. S. A. 2003;100:420. doi: 10.1073/pnas.0237084100. [DOI] [PMC free article] [PubMed] [Google Scholar]
- [34].Wesselingh JA, Bosma JC. AIChE J. 2001;4 [Google Scholar]
- [35].Lenhoff AM. Langmuir. 2008;24:5991. doi: 10.1021/la8004163. [DOI] [PubMed] [Google Scholar]
- [36].Carta G, Ubiera AR, Pabst TM. Chem. Eng. Technol. 2005;28:1252. [Google Scholar]
- [37].Helfferich F, Plesset MS. J. Chem. Phys. 1958;28:418. [Google Scholar]
- [38].Stone MC, Tao Y, Carta G. J. Chromatogr. A. 2009;1216:4465. doi: 10.1016/j.chroma.2009.03.044. [DOI] [PubMed] [Google Scholar]
- [39].Camperi SA, del Canizo AAN, Wolman FJ, Smolko EE, Cascone O, Grasselli R. Biotechnol. Prog. 1999;15:500. doi: 10.1021/bp990054g. [DOI] [PubMed] [Google Scholar]
- [40].Hunter A, Carta G. J. Chromatogr. A. 2001;930:79. doi: 10.1016/s0021-9673(01)01162-1. [DOI] [PubMed] [Google Scholar]
- [41].Dziennik SR, Belcher EB, Barker GA, Lenhoff AM. Biotechnol. Bioeng. 2005;91:139. doi: 10.1002/bit.20503. [DOI] [PubMed] [Google Scholar]
- [42].Bowes BD. Ph.D. Dissertation. Department of Chemical Engineering, University of Delaware; Newark, DE: 2011. [Google Scholar]