

Abstract
Sirolimus, the prototypical inhibitor of the mammalian target of rapamycin, has substantial antitumor activity. In this study, sirolimus showed nonlinear pharmacokinetic characteristics over a wide dose range (from 1 to 60 mg/week). The objective of this study was to develop a population pharmacokinetic (PopPK) model to describe the nonlinearity of sirolimus. Whole blood concentration data, obtained from four phase I clinical trials, were analyzed using a nonlinear mixed-effects modeling (NONMEM) approach. The influence of potential covariates was evaluated. Model robustness was assessed using nonparametric bootstrap and visual predictive check approaches. The data were well described by a two-compartment model incorporating a saturable Michaelis–Menten kinetic absorption process. A covariate analysis identified hematocrit as influencing the oral clearance of sirolimus. The visual predictive check indicated that the final pharmacokinetic model adequately predicted observed concentrations. The pharmacokinetics of sirolimus, based on whole blood concentrations, appears to be nonlinear due to saturable absorption.
Sirolimus (rapamycin) is commonly prescribed as an immunosuppressant and is indicated for the prevention of allograft rejection.1 As the prototypical inhibitor of the mammalian target of rapamycin, sirolimus (like other mammalian target of rapamycin inhibitors) has substantial antitumor activity both in animals and humans.2,3,4,5,6 Sirolimus has low bioavailability (14% on average) and a long terminal elimination half-life of ~62 h.7 Studies in transplant patients have demonstrated marked interindividual pharmacokinetic variability, resulting in the widespread use of therapeutic drug monitoring based on whole blood concentrations.8,9,10,11,12,13
There are several publications regarding the pharmacokinetics of sirolimus in transplant patients, although none have explicitly incorporated the nonlinear pharmacokinetic characteristics into a mixed-effects population model.8,9,10,11,12 Jiao et al.13 reported the nonlinearity in the pharmacokinetics of sirolimus, but they were unable to develop an explicit model to describe this due to limited measurements. Recently, several phase I trials of sirolimus in patients with cancer were completed, including the intermittent administration of higher doses.14,15 These studies provided the opportunity to investigate the nonlinearity in sirolimus disposition using whole blood concentration measurements. The detection and characterization of nonlinearities provided by population modeling allows a better understanding of how a drug should be used in clinical practice.16
The objective of this study was to develop a population pharmacokinetic (PopPK) model for sirolimus, while exploring possible nonlinear absorption characteristics in whole blood measurements. These measurements were obtained from clinical trials of patients with advanced cancer who received sirolimus in a wide range of dosages (1–60 mg/week). This is the first PopPK report of sirolimus in patients with advanced cancer.
Results
A total of 563 concentration data points from 76 patients with advanced solid tumors enrolled in four different phase I trials at The University of Chicago were available for the analysis.14,15 An example of the data records is provided in the Supplementary Table S1 online.
Noncompartmental analysis
Figure 1a,b demonstrates the nonlinearity of sirolimus pharmacokinetics. The slope of dose-normalized area under the curve (AUC)0–∞ vs. dose differed significantly from zero (P < 0.01), indicating that the drug exposure did not increase linearly with dose. The terminal elimination half-life did not deviate significantly from zero (P > 0.05), suggesting that the elimination is linear over the dose range in this study.
Figure 1.

The ratio of area under the curve (AUC)0–∞ and dose (AUC0–∞/dose) (a) and terminal elimination half-life (b) vs. doses. Males and females are represented by dots and squares. The data from trials 2 (dose range 1–16 mg) and 3 (dose range 15–35 mg) are shown in pink and blue.
Nonlinear PopPK model
Sirolimus concentration vs. time curves were best described using a two-compartment model with a saturable absorption model (Michaelis–Menten equation) (Figure 2). The base model was characterized by the following expressions:
Figure 2.
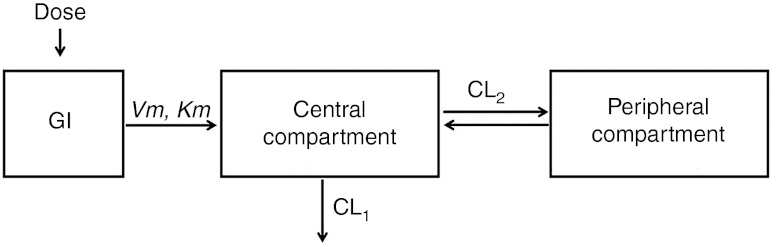
Two-compartment model with a saturable Michaelis–Menten kinetic absorption. CL1, clearance from central compartment; CL2, clearance between central and peripheral compartments; GI, gastrointestinal tract; Km, the amount at 50% of Vm; Vm, maximum absorption rate.
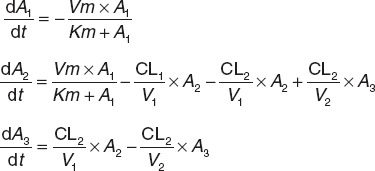 |
where A1, A2, and A3 are the amounts of drug in the intestinal lumen and central and peripheral compartments. Vm (µg/l·h) is the maximum absorption rate and Km (mg) is the drug amount at 50% of Vm. Vm, Km, CL1, V1, CL2, and V2 were fitted. At 0 h, A1 = dose, and A2 and A3 = 0.
A combined proportional and additive error model was used to describe the residual unexplained variability representing the variance between the observed concentrations and those predicted by the model:
where Cobs and Cpred are the observed and predicted concentrations. ε1 and ε2 are randomly distributed variables with a mean of zero and variances of  and
and  accounted for the residual variabilities.
The estimated PopPK parameters are listed in Table 1. The relative standard errors of parameter estimates ranged from 8.17% to 55.4%. Figure 3 shows the relationship between the observed and population model–predicted concentrations and the relationship between the observed and individual model–predicted concentrations. The subjects in these studies were outpatients, and undocumented variability in timing of doses may be a significant factor impacting both bias and precision.17 The M3 method was tried as there were 16 samples (2.0% of all observations) below the limit of quantification.18 It was not included in our final model because addition of the M3 method did not improve the model fit. Hematocrit was the only significant covariate affecting the apparent clearance of sirolimus (clearance decreased with increasing hematocrit). Drug formulation (liquid vs. solid) did not have a significant impact on the absorption-related parameters.
Table 1. Final population pharmacokinetic parameter estimates and bootstrap results of sirolimus.
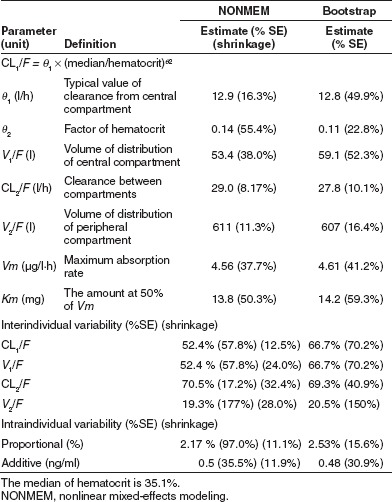
Figure 3.
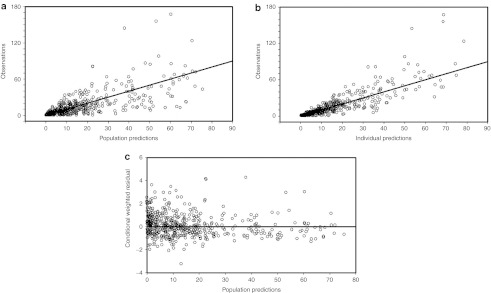
Observed (DV) vs. (a) population model predicted and (b) individual model predicted concentrations. The solid lines are diagonal lines of identity. (c) Conditional weighted residuals vs. population predictions.
Model evaluation
The median parameter values resulting from the bootstrap procedure agreed with the estimates from the final population model. This suggests that the parameters in the final model were reasonably well determined and the model was stable. From 1,000 bootstrap runs, 985 minimized successfully and were included in the bootstrap analysis. The results of the bootstrap analysis are summarized in Table 1. Figure 4 shows the median and the 5th and 95th percent prediction intervals from the visual predictive check simulation with the observed data superimposed. These plots show that most of the observed concentrations on all dose levels fell within the 5th–95th percent prediction interval. Observed concentrations <10% lay outside the prediction intervals. The visual predictive check shows that the final model adequately describes the majority of the data.
Figure 4.

Visual predictive check of the model for all dose levels. The median model predictions are shown by solid lines and 95% prediction intervals are encompassed by the broken lines. The dots present the observed concentrations.
Discussion
This is the first PopPK study of sirolimus in patients with cancer. Using whole blood concentrations, the data were adequately explained by a Michaelis–Menten absorptive process, which results in increased apparent oral clearance with dose.
In addition, our model demonstrated that the apparent oral clearance of sirolimus was inversely associated with hematocrit, although this has only a modest effect on clearance (e.g., an increase in hematocrit from 35.1% to 44.7% results in a decrease in apparent clearance from 12.9 to 12.4 l/hr). Sirolimus is distributed mostly into red blood cells and very little into plasma (<5%).19,20,21 The sequestration of sirolimus, like tacrolimus, into blood cells is believed to be mainly due to the presence of binding proteins such as FK binding protein.22 Lipid solubility, degree of ionization, molecular size, and hydrogen-bonding ability have been identified as the main determinants for uptake by the red blood cells. The relationship between clearance and hematocrit may reflect the exchange of sirolimus between plasma and red blood cells. This exchange plays an important role in its pharmacokinetic behavior.9 Many other drugs, such as tacrolimus23 and cyclosporine,24 also show a correlation between whole blood clearance and hematocrit.23,24
In the forward addition process, gender was found to be significantly related with V1/F (V1/F for female is 75% of the V1/F for male), but did not pass the backward elimination. The volume of distribution for the peripheral compartment increased slightly with increasing body weight (the exponent is 0.676); however, the addition of body weight to volume of distribution as a covariate did not result in a statistically significant change in the objective function value (1.589).
Michaelis–Menten kinetics was incorporated in our model to describe the saturable absorption. This is consistent with a previous study on intestinal absorption, which demonstrated a concentration-dependent and saturable transepithelial transport of sirolimus across Caco-2 monolayers.25 The mechanism of absorption is not very clear, and the model could be further understood once the drug transport mechanisms are elucidated.25 Cummins et al.26 studied the cellular pharmacokinetics of sirolimus in CYP3A4-transfected Caco-2 cells. They found that the net effect of P-glycoprotein on metabolism was not as great as that expected for sirolimus, a P-glycoprotein substrate, and assumed that there might be multiple transporters involved in sirolimus absorption.
Our model fit the concentration data well. The residual of the pharmacokinetic parameter estimates was acceptable (Table 1). The clearance of central compartment in our study is comparable with those reported previously (7.9–28.3 l/h).10,12,20,23 The apparent volume of distribution of the peripheral compartment (tissue) is in the range of values reported in previous studies (11.6–1,350 l).8,9,10,12,20,23 Because sirolimus is hydrophobic, it is widely distributed in the lipid membranes of body tissues and the erythrocytes and shows a large apparent volume of distribution.10,22
The current PopPK analysis can be used to predict the effect of dose and/or schedule change on the whole blood concentrations of sirolimus. This will facilitate future studies of this agent in addition to providing information that may guide dosing for patients individually.
Methods
Patients and data collection. The clinical trials were reviewed and approved by The University of Chicago Institutional Review Board.14,15 Written informed consent was obtained from all patients. The demographic characteristics of the patients are summarized in Table 2. Treatment was administered on an outpatient basis according to the treatment schedule listed in Table 3. Patients self-administered sirolimus (without food) at the scheduled times per protocol. Patients from trial 1 were given high dose sirolimus. In trials 2 and 3, escalated doses of sirolimus were administered. In trial 4, a fixed sirolimus dose of 4 mg was given. Dosing was independent of body weight. Sirolimus was supplied in liquid form for trials 1, 3, and 4, and in tablet form for trial 2.
Table 2. Patient demographics.
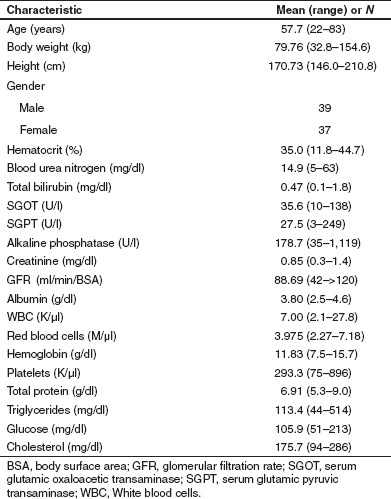
Table 3. Treatment and sampling schedule for the clinical trials.
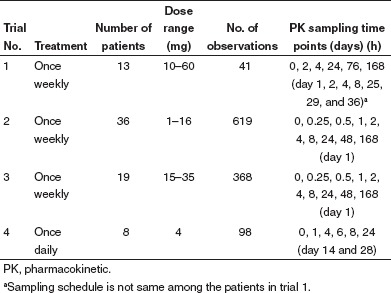
Blood sampling and sirolimus analysis. Sirolimus whole blood concentrations were obtained according to the sampling schedule shown in Table 3. Samples were stored at −80 °C until analysis by high-performance liquid chromatography combined with tandem mass spectrometry (LC/MS/MS) for trials 2, 3, and 4. The extraction and LC/MS/MS methods are described in Supplementary Appendix online. The samples from trial 1 were analyzed using high-performance liquid chromatography and LC/MS/MS. The limit of quantification (in ng/ml) was 2 (trial 1), 0.28 (trials 2 and 3), and 0.49 (trial 4).
Noncompartmental analysis. To evaluate the dose dependence of the pharmacokinetic behavior of sirolimus, AUC0–∞ and half-life were calculated using a noncompartmental pharmacokinetic analysis implemented in the PK Solutions software (version 2.0; Summit Research Services, Montrose, CO). Sirolimus whole blood concentrations from trials 2 and 3 were used for this analysis. To establish dose linearity and proportionality, dose-normalized AUC0–∞ and half-life were analyzed using regression analysis (α = 0.05).
Nonlinear PopPK model. An analysis was performed using a nonlinear mixed-effects modeling (NONMEM) approach as implemented in NONMEM (version VII, level 1; ICON, Ellicott City, MD) in conjunction with a gfortran compiler.27 First-order conditional estimation with interaction and the ADVAN 13 subroutine were applied.
A number of candidate models were assessed in describing the concentration data and apparent nonlinearity of the pharmacokinetics of sirolimus: two-compartment model with Michaelis–Menten elimination; Michaelis–Menten absorption; zero-order absorption and first-order loss in gastrointestinal tract; parallel zero-order and first-order absorption; and Weibull absorption.8 Mixture distributions were also explored to examine whether the absorption patterns had a multimodal characteristic. Demographic data of the patients, shown in Table 2, were tested in the model one by one as candidate covariates on each of the parameters. The final PopPK model was established using the stepwise forward addition and backward elimination method.28 Comparison of the models was based on the objective function value provided by NONMEM at a significance level of 0.05 (equal to a decrease of 3.84 in the objective function value) for the forward addition and 0.01 (equal to a decrease of 6.63 in the objective function value) for the backward elimination for 1 degree of freedom.
Interindividual variability was described with a statistical model. Pharmacokinetic parameters were expressed by the exponential Eq. 1:
where Pij represents the jth basic pharmacokinetic parameter for the ith individual, PTV j is the typical population value of the jth parameter, and ηij is realization from a normally distributed interindividual variable with a mean of 0 and an estimated variance of  , which is the deviation of Pij from PTV j. Residual unexplained variability was evaluated using additive, proportional, and their combined error models. The NONMEM code is provided in the Supplementary Data online.
Model evaluation. The final model was evaluated using a nonparametric bootstrap and visual predictive check.29,30 The bootstrap evaluation involved resampling the original data set 1,000 times (sampling with replacement). The median values and the 2.5th and 97.5th percentiles of the parameters obtained by this analysis were compared with the ones obtained from the covariance step in NONMEM from the original data set. The visual predictive check was generated using 1,000 simulations from the final model, for all dose levels in our study, to assess the predictive performance and to verify if the performance is consistent among the dose levels. A graphical comparison was made between observed data and the model predicted median and 95% prediction interval over time.
Author Contributions
M.J.R., K.W., L.K.H., J.R., and R.R.B. wrote the manuscript; M.J.R. and E.E.W.C. designed the research; M.J.R., K.W., E.E.W.C., W.Z., and R.R.B. performed the research; and LKH and JR analyzed the data.
Conflict of Interest
The authors declared no conflict of interest.
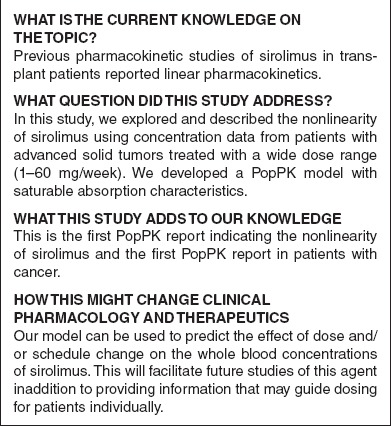
Study Highlights
Acknowledgments
This work was supported by CA112951, the Pharmacology Core of the University of Chicago Comprehensive Cancer Center (P30 CA14599) and the Indiana Clinical and Translational Sciences Institute (through a gift of Eli Lilly and Company).
Supplementary Material
References
- Saunders R.N., Metcalfe M.S., &, Nicholson M.L. Rapamycin in transplantation: a review of the evidence. Kidney Int. 2001;59:3–16. doi: 10.1046/j.1523-1755.2001.00460.x. [DOI] [PubMed] [Google Scholar]
- Houchens D.P., Ovejera A.A., Riblet S.M., &, Slagel D.E. Human brain tumor xenografts in nude mice as a chemotherapy model. Eur. J. Cancer Clin. Oncol. 1983;19:799–805. doi: 10.1016/0277-5379(83)90012-3. [DOI] [PubMed] [Google Scholar]
- Eng C.P., Sehgal S.N., &, Vézina C. Activity of rapamycin (AY-22,989) against transplanted tumors. J. Antibiot. 1984;37:1231–1237. doi: 10.7164/antibiotics.37.1231. [DOI] [PubMed] [Google Scholar]
- Houghton P.J., &, Huang S. mTOR as a target for cancer therapy. Curr. Top. Microbiol. Immunol. 2004;279:339–359. doi: 10.1007/978-3-642-18930-2_20. [DOI] [PubMed] [Google Scholar]
- Stallone G.et al. Sirolimus for Kaposi's sarcoma in renal-transplant recipients N. Engl. J. Med 3521317–1323.2005 [DOI] [PubMed] [Google Scholar]
- Chan S. Targeting the mammalian target of rapamycin (mTOR): a new approach to treating cancer. Br. J. Cancer. 2004;91:1420–1424. doi: 10.1038/sj.bjc.6602162. [DOI] [PMC free article] [PubMed] [Google Scholar]
- MacDonald A., Scarola J., Burke J.T., &, Zimmerman J.J. Clinical pharmacokinetics and therapeutic drug monitoring of sirolimus. Clin. Ther. 2000;22 (suppl. B):B101–B121. doi: 10.1016/s0149-2918(00)89027-x. [DOI] [PubMed] [Google Scholar]
- Djebli N.et al. Sirolimus population pharmacokinetic/pharmacogenetic analysis and bayesian modelling in kidney transplant recipients Clin. Pharmacokinet 451135–1148.2006 [DOI] [PubMed] [Google Scholar]
- Zahir H., Keogh A., &, Akhlaghi F. Apparent clearance of sirolimus in heart transplant recipients: impact of primary diagnosis and serum lipids. Ther. Drug Monit. 2006;28:818–826. [PubMed] [Google Scholar]
- Ferron G.M., Mishina E.V., Zimmerman J.J., &, Jusko W.J. Population pharmacokinetics of sirolimus in kidney transplant patients. Clin. Pharmacol. Ther. 1997;61:416–428. doi: 10.1016/S0009-9236(97)90192-2. [DOI] [PubMed] [Google Scholar]
- Sato E.et al. Temporal decline in sirolimus elimination immediately after pancreatic islet transplantation Drug Metab. Pharmacokinet 21492–500.2006 [DOI] [PubMed] [Google Scholar]
- Dansirikul C., Morris R.G., Tett S.E., &, Duffull S.B. A Bayesian approach for population pharmacokinetic modelling of sirolimus. Br. J. Clin. Pharmacol. 2006;62:420–434. doi: 10.1111/j.1365-2125.2005.02533.x. [DOI] [PMC free article] [PubMed] [Google Scholar]
- Jiao Z., Shi X.J., Li Z.D., &, Zhong M.K. Population pharmacokinetics of sirolimus in de novo Chinese adult renal transplant patients. Br. J. Clin. Pharmacol. 2009;68:47–60. doi: 10.1111/j.1365-2125.2009.03392.x. [DOI] [PMC free article] [PubMed] [Google Scholar]
- Cohen E.E.et al. Phase I study of rapamycin (R) in combination with CYP3A4 modifier, ketoconazole (K), in patients with advanced malignancies J. Clin. Oncol 24suppl. 18S3061.2006 [Google Scholar]
- Ratain M.J.et al. A phase 1b study of oral rapamycin (sirolimus) in patients with advanced malignancies J. Clin. Oncol 25suppl. 18)S3510.2007 [Google Scholar]
- Jonsson E.N., Wade J.R., &, Karlsson M.O. Nonlinearity detection: advantages of nonlinear mixed-effects modeling. AAPS PharmSci. 2000;2:E32. doi: 10.1208/ps020332. [DOI] [PMC free article] [PubMed] [Google Scholar]
- Beal S.L, Sheiner L.B., Boeckmann A.J.eds.) NONMEM Users Guides. (1989–2006) Icon Development Solutions, Ellicott City, MD; 2008 [Google Scholar]
- Beal S.L. Ways to fit a PK model with some data below the quantification limit. J. Pharmacokinet. Pharmacodyn. 2001;28:481–504. doi: 10.1023/a:1012299115260. [DOI] [PubMed] [Google Scholar]
- Yano Y., Beal S.L., &, Sheiner L.B. Evaluating pharmacokinetic/pharmacodynamic models using the posterior predictive check. J. Pharmacokinet. Pharmacodyn. 2001;28:171–192. doi: 10.1023/a:1011555016423. [DOI] [PubMed] [Google Scholar]
- Karlsson M.O., &, Holford N.A tutorial on visual predictive checks. Annual Meeting of the Population Approach Group in Europe (PAGE)Marseille, France, 18–20 June2008
- Trepanier D.J., Gallant H., Legatt D.F., &, Yatscoff R.W. Sirolimus: distribution, pharmacokinetics and therapeutic range investigation: an update. Clin. Biochem. 1998;31:345–351. doi: 10.1016/s0009-9120(98)00048-4. [DOI] [PubMed] [Google Scholar]
- Mahalati K., &, Kahan B.D. Clinical pharmacokinetics of sirolimus. Clin. Pharmacokinet. 2001;40:573–585. doi: 10.2165/00003088-200140080-00002. [DOI] [PubMed] [Google Scholar]
- Zahir H., McLachlan A.J., Nelson A., McCaughan G., Gleeson M., &, Akhlaghi F. Population pharmacokinetic estimation of tacrolimus apparent clearance in adult liver transplant recipients. Ther. Drug Monit. 2005;27:422–430. doi: 10.1097/01.ftd.0000170029.36573.a0. [DOI] [PubMed] [Google Scholar]
- Wu K.H.et al. Population pharmacokinetics of cyclosporine in clinical renal transplant patients Drug Metab. Dispos 331268–1275.2005 [DOI] [PubMed] [Google Scholar]
- Lamoureux F., Picard N., Boussera B., Sauvage F.L., &, Marquet P. Sirolimus and everolimus intestinal absorption and interaction with calcineurin inhibitors: a differential effect between cyclosporine and tacrolimus. Fundam. Clin. Pharmacol. 2012;26:463–472. doi: 10.1111/j.1472-8206.2011.00957.x. [DOI] [PubMed] [Google Scholar]
- Cummins C.L., Jacobsen W., Christians U., &, Benet L.Z. CYP3A4-transfected Caco-2 cells as a tool for understanding biochemical absorption barriers: studies with sirolimus and midazolam. J. Pharmacol. Exp. Ther. 2004;308:143–155. doi: 10.1124/jpet.103.058065. [DOI] [PubMed] [Google Scholar]
- Vrijens B., Tousset E., Rode R., Bertz R., Mayer S., &, Urquhart J. Successful projection of the time course of drug concentration in plasma during a 1-year period from electronically compiled dosing-time data used as input to individually parameterized pharmacokinetic models. J. Clin. Pharmacol. 2005;45:461–467. doi: 10.1177/0091270004274433. [DOI] [PubMed] [Google Scholar]
- Ahn J.E., Karlsson M.O., Dunne A., &, Ludden T.M. Likelihood based approaches to handling data below the quantification limit using NONMEM VI. J. Pharmacokinet. Pharmacodyn. 2008;35:401–421. doi: 10.1007/s10928-008-9094-4. [DOI] [PubMed] [Google Scholar]
- Yatscoff R., LeGatt D., Keenan R., &, Chackowsky P. Blood distribution of rapamycin. Transplantation. 1993;56:1202–1206. doi: 10.1097/00007890-199311000-00029. [DOI] [PubMed] [Google Scholar]
- Yatscoff R.W., Wang P., Chan K., Hicks D., &, Zimmerman J. Rapamycin: distribution, pharmacokinetics, and therapeutic range investigations. Ther. Drug Monit. 1995;17:666–671. doi: 10.1097/00007691-199512000-00020. [DOI] [PubMed] [Google Scholar]
Associated Data
This section collects any data citations, data availability statements, or supplementary materials included in this article.