

Abstract
A phase II trial in metastatic breast cancer (MBC) (NO16853) failed to show noninferiority (progression-free survival, PFS) of capecitabine 825 mg/m2 plus docetaxel 75 mg/m2 to the registered capecitabine dose of 1,250 mg/m2 plus docetaxel 75 mg/m2. We developed a modeling framework based on NO16853 and the pivotal phase III MBC study, SO14999, to characterize the link between capecitabine dose, tumor growth, PFS, and survival to simulate response to a range of capecitabine doses and determine a minimum capecitabine dose noninferior to 1,250 mg/m2. Simulation showed NO16853 had little power to demonstrate noninferiority (69%). The power reached 80% with a 1,000 mg/m2 starting dose and an increased number of PFS events. A starting dose of 1,000 mg/m2 could be established as noninferior in terms of efficacy to the registered dose in the second-line MBC setting, with a potentially improved safety, in line with medical practice.
Capecitabine (Xeloda; F. Hoffmann-La Roche, Nutley, NJ) is administered as a noncytotoxic systemic prodrug of 5′-deoxy-5-fluorouridine.1 After administration, it is extensively absorbed, unchanged from the gastrointestinal tract, and is sequentially converted to the cytotoxic moiety, 5-fluorouracil in a series of metabolic steps.2 Capecitabine is registered in combination with docetaxel (Taxotere; Sanofi-Aventis, Bridgewater, NJ) for second-line treatment of metastatic breast cancer (MBC). The registration was based on the results of the phase III study SO14999, in which capecitabine 1,250 mg/m2 twice daily (14 days on, 7 days off drug treatment in 3-week treatment cycles) was combined with docetaxel 75 mg/m2 at the beginning of each treatment cycle.3 However, a higher proportion of patients in the combination arm experienced grade 3/4 adverse events (and dose reductions as compared with those receiving docetaxel alone). Dose reductions of both capecitabine and docetaxel were effective in reducing the incidence and recurrence of grade 3/4 adverse events, without any apparent impact on efficacy.4 Study NO16853 was a postapproval commitment study requested by the Food and Drug Administration to investigate the impact of a lower capecitabine starting dose on safety and efficacy. NO16853 compared two dose levels of capecitabine: 1,250 mg/m2 (high dose) and 950 mg/m2 (low dose), both in combination with docetaxel 75 mg/m2. The dose of 950 mg/m2 was close to the median dose delivered in study SO14999. However, in an early amendment, the low dose was reduced to 825 mg/m2 as a large proportion of patients discontinuing treatment early due to adverse events were observed with 950 mg/m2 in another study that was running in parallel. The study population and treatment modalities for NO16853 were the same as for the combination arm of study SO14999. The primary efficacy end point was progression-free survival (PFS). Overall survival (OS) was a secondary end point. The objective of the study was to demonstrate noninferiority of the lower dose with respect to the efficacy of the higher dose. Final results based on 31 March 2008 data cutoff showed that the primary end point was not met.4
The aim of this project was to perform simulations to determine which capecitabine dose would be noninferior to the registered dose in combination with docetaxel in the second-line treatment of MBC using a previously developed and extended modeling framework.
The modeling framework comprised:5,6
a longitudinal exposure–response tumor growth inhibition (TGI) model to evaluate antitumor effect on continuous tumor size measurements;
a survival model using change in tumor size as the main predictor for OS together with prognostic factors.
This modeling framework has been updated with the new data available and extended with a model for PFS for the purpose of the current work.
Results
TGI model
The longitudinal tumor size (sum of the longest diameters at each visit) data set comprised 888 patients (463 from SO14999 and 425 from NO16853) and 2,988 observations (3.4 measurements per patient). A large range of baseline (10 to 520 mm) tumor sizes was observed, together with a variety of tumor size profiles during drug treatment (Supplementary Figure S1 online). Model parameters were well estimated with standard errors typically < or ~30%, except for the rate constant for resistance appearance for docetaxel (standard errors of 39%) (Supplementary Table S1 online). The TGI model provided an adequate fit of the data (data not shown). As illustrated by the posterior predictive check (PPC) (Supplementary Figure S2 online), the model was able to simulate observed fractional change in tumor size at week 6 (end-of-cycle 2) in the different treatment groups; however, with some slight bias in the prediction especially for the 25th percentile of the docetaxel plus capecitabine 1,250 mg/m2 treatment group.
Model for OS
The model for OS was developed based on the 888 patients pooled database, of which 556 (63%) died during the observation period. Median (95% confidence interval (CI)) survival was 14.8 months (13.6–16.0 months). The log-normal distribution best described the survival time as previously observed in colorectal cancer.6 Survival decreased with increased baseline tumor size and increased fractional change (tumor progression), in patients with Eastern Cooperative Oncology Group performance status 1 vs. 0 (n = 319, 36%) and in patients with >1 vs. ≤1 metastatic site (n = 687, 77%). Survival was also longer in study NO16853 (ref. 4) than in study SO14999 (ref. 3). The prognostic factors included in the model could not explain this difference which is probably related to change in standard of care during the time separating the two studies. However, there was no interaction between study and tumor shrinkage effects. Model parameters of the survival model were well estimated (Table 1).
Table 1. Survival model parameter estimates (RSE, %).
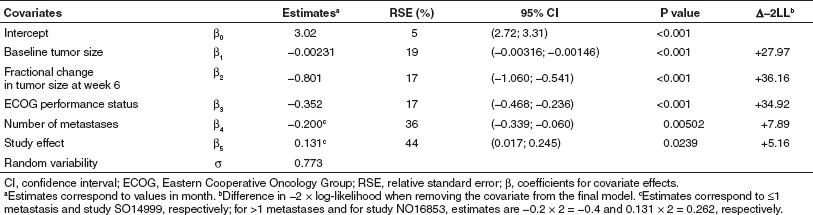
In 220 patients, estrogen receptor and progesterone receptor status was missing and could not be included in the primary analysis; this covariate was tested on the final model on the subset of patients in whom information was available. Patients with tumors expressing at least one receptor survived significantly longer than those with negative receptor status (P < 0.001). This effect was not retained in the final model as this value was missing in 25% of the patients. There was no interaction between this effect and the effect due to predicted fractional change in tumor size at week 6.
Model evaluation (PPC) indicated good performance of the model in simulating the survival distribution of the pooled studies (Supplementary Figure S3 online) as well as that observed in the different treatment groups (Supplementary Figure S4 online). The dependence of expected survival length on the fractional change in tumor size from baseline at week 6 is illustrated in Supplementary Figure S5 online. For example, expected median survival (95% CI) would vary from 11.8 months (10.1–14.0 months) for a 30% tumor size progression to 19.3 months (17.3–21.6 months) for a 30% shrinkage.
Model for PFS
Most of the patients (n = 790, 89%) experienced progression or died during the observation time. Median (95% CI) PFS was 5.8 months (5.5–6.3 months). The log-normal distribution best described the PFS time. Baseline tumor size, Eastern Cooperative Oncology Group performance status, and fractional change in tumor size from baseline at week 6 were significant predictors of PFS. These covariates influenced PFS the same way as they influenced survival. PFS was also longer in study NO16853 than study SO14999. Parameter estimates of the PFS model are given in Table 2. Some of the study effect on PFS may be related to different assessment of progression in the two studies. Simulations were conditioned on the most recent study NO16853 that used the response evaluation criteria in solid tumors criteria.
Table 2. Progression-free survival model parameter estimates (RSE, %).
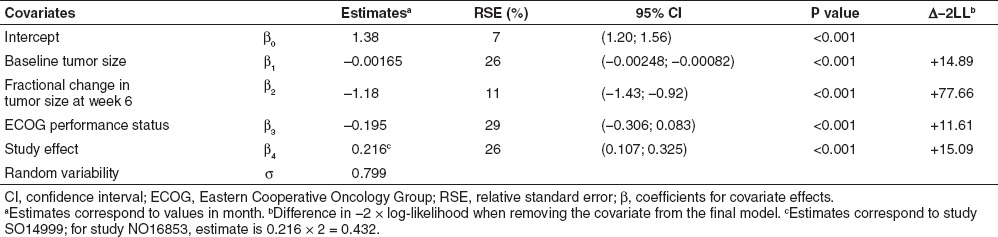
Model evaluation (PPC) indicated good performance of the model in simulating the PFS distribution of the pooled studies (Supplementary Figure S6 online) as well as that observed in the different treatment groups (Supplementary Figure S7 online). The dependence of expected PFS on fractional change in tumor size from baseline at week 6 is illustrated in Supplementary Figure S8 online. For example, expected PFS (95% CI) would vary from 3.8 months (3.2–4.5 months) for a 30% tumor size progression to 7.7 months (7.1–8.5 months) for a 30% shrinkage.
Assessment of the full simulation framework
The observed upper 95% hazard ratio (HR) confidence limit for PFS of 1.43 belonged to its 95% simulated prediction interval (1.10–1.50) for 372 events (as observed in NO16853)4 indicating that the slight bias in some of the statistics calculated to assess the prediction of week 6 tumor shrinkage (especially for the 25th percentile of one of the docetaxel plus capecitabine arm) by the TGI model did not impact the simulation of the statistics of interest. The observed value exceeded the prespecified threshold of 1.35 and study NO16853 failed to demonstrate noninferiority. According to the simulations assuming equivalent efficacy (or a “true” HR of 1), the expected power of the study to demonstrate noninferiority was only 69%.
Simulations
Simulations of trials with either the prespecified number of events (350) or the observed one (372) indicated that no dose below the reference dose of 1,250 mg/m2 capecitabine had 80% power to show noninferiority to the reference dose level (power ranging from 61% for 850 mg/m2 to 72% for 1,000 mg/m2). Simulations with the number of recorded progression or death events required for study termination increased to 470 predicted that a starting dose of 1,000 mg/m2 capecitabine or higher would achieve 80% power to show noninferiority to 1,250 mg/m2 (Figure 1).
Figure 1.

Upper limits of 95% hazard ratio CI for simulated studies comparing various capecitabine doses to 1,250 mg/m2 for a 470 event design. Gray area: 90% prediction interval across 2,000 replicates; Gray line at 1.35: threshold to achieve noninferiority (>80% power); Black line: median; Red line: 80% power line; Numbers: actual power of a study with a specific dose.
Discussion
This is the first paper, that we know of, describing the use of modeling and simulation in oncology to explain and analyze results of a phase II clinical trial that did not meet its primary end point, as well as to extract useful clinical information from the trial. Clinical trial simulations have been extensively and successfully used in a variety of other therapeutic areas,7 but rarely in oncology.8,9 We recently proposed and retrospectively evaluated a modeling framework to simulate phase III studies based on phase II data in colorectal cancer.6 The core of the approach consists of using a TGI model to extract the maximum information regarding disease characteristics (e.g., tumor growth rate) and drug effect (e.g., drug potency) and linking early tumor shrinkage (end-of-cycle 2) to survival in a drug-independent model that can be further leveraged to simulate expected survival differences for new investigational treatments. Similar models, all based on end-of-cycle 2 (week 6 or week 8) tumor shrinkage, are available in non-small-cell lung cancer,10 thyroid cancer,11 ovarian cancer,12 and multiple myeloma,13 supporting the use of change in tumor size as an end point in phase II studies.14,15
This study proposes a modeling framework for MBC based on preliminary work in which the SO14999 study was simulated using phase II capecitabine data.5 The modeling framework has been extended to evaluate TGI of the capecitabine–docetaxel combination, PFS, and survival and assessed to simulate the statistics of interest (upper PFS 95% HR confidence limit between a lower capecitabine starting dose (850 mg/m2) and the reference 1,250 mg/m2 dose level). The PPC of the TGI model did show some bias in some of the tested statistics (median and quartiles of fractional change in tumor size at week 6). However, the PPC for PFS showed good performance for the pooled studies as well as for individual treatment arms and the simulated prediction interval of the upper 95% HR confidence limit for PFS matched what was observed in study NO16853. This indicates that the combined modeling framework was well qualified for its intended use.
Simulations demonstrated that study NO16853, designed to demonstrate noninferiority (PFS) of low-dose capecitabine (825 mg/m2 twice daily) to the currently marketed dose of 1,250 mg/m2 twice daily in combination with docetaxel 75 mg/m2,4 had only 69% power. Further simulations indicated that a 20% higher capecitabine dose (1,000 mg/m2 twice daily) combined with an increased number of PFS events (470 instead of 350) would have yielded 80% power to establish noninferiority to 1,250 mg/m2 twice daily. These results suggest that a starting dose of capecitabine of 1,000 mg/m2 twice daily is sufficient in second-line MBC without compromising efficacy and potentially improving safety. In addition, this dose is in line with current medical practices.16 Extension of the modeling framework to incorporate models for dose limiting toxicities (such as the hand foot syndrome)17 may be warranted to further investigate dosing strategies that may improve the benefit to risk ratio of this drug combination.
More prospective studies are needed to better assess the potential of modeling and simulation approaches in oncology as there is a critical need to improve the efficiency of clinical trial design and drug development decisions in this therapeutic area.14,15,18
Methods
Trials and data. Data were obtained from one randomized phase III trial and one randomized phase II trial designed to assess the efficacy of capecitabine in combination with docetaxel in patients with MBC. The first study, SO14999, demonstrated the superiority of capecitabine 1,250 mg/m2 twice daily (14 days on, 7 days off drug treatment in 3-week treatment cycles) combined with docetaxel 75 mg/m2 (day 1) to single-agent docetaxel every 3 weeks with an increase in median OS of 3 months.3 The second study, NO16853, was a randomized phase II study that failed to demonstrate the noninferiority of a lower capecitabine starting dose (825 mg/m2 twice daily) in combination with docetaxel (75 mg/m2) to the registered regimen: HR for PFS was 1.16 (95% CI, 0.95; 1.43) with the upper bound exceeding the threshold for noninferiority (1.35).4
Tumor responses were assessed using the World Health Organization criteria19 in study SO14999 and response evaluation criteria in solid tumors20 in study NO16853. Sum of the longest diameters for all measurable lesions (when the World Health Organization criteria were used) or the target lesions (when response evaluation criteria in solid tumors was used) were used to develop the longitudinal TGI model. Complete dosing histories, PFS, death, and censoring dates were also extracted from the respective databases, as well as covariates to be tested as prognostic factors.
Tumor growth inhibition model. We developed a model accounting for the dynamics of tumor growth, antitumor drug effect, and resistance to drug effect based on a previously published model.5,6 The model describes tumor size (i.e., sum of the longest diameters) as a function of time and drug exposure, and accounts for tumor growth, drug action (assuming additive effect of capecitabine and docetaxel), and development of resistance. Patient-level log-normally distributed random effects were allowed on all of the model parameters to account for interpatient variability. Drug dose was used as the exposure metrics to drive drug effect. Equations of the model as well as parameter definitions are provided in the Supplementary Data online. Model parameters were estimated in a nonlinear mixed-effect analysis, in which data from all patients were analyzed simultaneously using the nonlinear mixed effects modeling program (NONMEM) (Version VI, level 1.0; GloboMax, Hanover, MD). NONMEM control file is given in the Supplementary Data online. The model was evaluated using standard goodness of fit plots. Model predictive performance was evaluated using a PPC. PPC uses the model and the study design to simulate statistics of interest (median and quartiles of fractional change in tumor size at week 6) of many, hypothetical, trial replicates (n = 500, number of replicates limited by the computation time with this model) across model parameter uncertainty (for different replicates), interindividual variability (within replicates), and residual error. Observed statistics were compared with the posterior predictive distributions by the model.
Survival models. Parametric survival models were developed independently for OS and PFS. The models describe the survival time distribution as a function of covariates. The probability density function that best described the observed survival time was selected among normal, log normal, Weibull, logistic, loglogistic, exponential, and extreme, using difference in log-likelihood and goodness of fit plots of the alternative models. Model parameter estimation was performed using the censorReg function in S-plus (version 8.0; Insightful, Seattle, WA). The survival model can be considered as a drug-independent model relating a biomarker response (week 6 fractional tumor size change from baseline, based on individual predictions from the TGI model) and prognostic factors (covariates) to a clinical end point (PFS or survival time).5,6,10,11,12,13
The following covariates were tested:
baseline tumor size
Eastern Cooperative Oncology Group performance status
number of metastases (≤1 vs >1)
study effect
Estrogen receptor and progesterone receptor status (both negative vs. at least one positive): These covariates were only tested on the final parametric model as there was too much missing data.
Covariate effects were first assessed using a Cox proportional hazards regression model using the coxph function in S-plus version 8.0. In a second step, covariates were tested one by one using the parametric model. All significant covariates from the univariate analysis, using a cutoff criterion at P ≤ 0.05, were added to form a “full” model after which a backward stepwise elimination was carried out. At each elimination step, the relative influence of each remaining covariate on the model was reevaluated by removing it from the reduced model on an individual basis using a cutoff criterion at P ≤ 0.05. The obtained model was the so called “final” model. The survival models were also evaluated using a PPC. Survival times for the same number of patients as in the pooled data set were simulated 1,000 times. Parameter values for the survival model were sampled from the estimated mean values and variance-covariance matrix (uncertainty in parameter estimates). Observed survival and PFS distributions were compared with the posterior predictive distributions by the models (95% prediction interval).
Assessment of the full simulation framework. The full simulation framework (final models for TGI, survival, and PFS) was evaluated using a PPC. Multiple replicates (2,000) of study NO16853 were simulated. Observed value of the upper 95% HR confidence limit (the statistics we are interested in) for PFS between 850 mg/m2 and the reference 1,250 mg/m2 dose level was compared with the posterior distribution (95% prediction interval) given the model and the data. The simulation process was as described next in the clinical trial simulation section.
Clinical trial simulations. The simulation framework was used to replicate the outcome of virtual studies with the same design as study NO168534 using different capecitabine starting doses (825 mg/m2, 1,000 mg/m2, and 1,249 mg/m2 twice daily, days 1–14) in combination with docetaxel (75 mg/m2, day 1) every 3 weeks compared with a reference arm receiving capecitabine 1,250 mg/m2 with docetaxel. Cycle 1 and 2 dosing histories (dose modifications and dose delays) were required to simulate week 6 tumor shrinkage using the TGI model. For simulated doses, 850 and 1,250 mg/m2 dosing histories were sampled from observed in the respective arms of study NO16853. For simulated dose 1,000 and 1,249 mg/m2 dosing histories were sampled from observed in the 1,250 mg/m2 arm. This approach is conservative in that it provides downward biased efficacy estimates for 1,000 mg/m2 as higher relative dose intensity would be expected as compared with 1,250 mg/m2. For each arm, data for 235 patients were simulated corresponding to the intent-to-treat population size of each arm in NO16853.4 The studies were replicated 2,000 times. Parameter values for the different models were sampled from the estimated mean values and interindividual variability (within replicates, TGI model only) and model parameter uncertainty as estimated by the NONMEM covariance matrix of parameter estimates (for different replicates). Patient characteristics were sampled with replacement from the observed data of the patients in study NO16853, keeping the within-patient correlations. The rate of patient recruitment was simulated to approximately follow the observed recruitment rate in study NO16853 (15.2 patients/month) with a total recruitment period of 25 months and with a doubled rate period starting at 6 months and stopping 6 months later. The simulated study replicates were terminated when the target number of disease progression or death events were reached (e.g., 350 as in the NO16853 study4 or larger). Patients simulated to be alive or with no disease progression were recorded with censored survival and PFS, respectively. Patients who dropped out before the end-of-cycle 2 could not be simulated using the TGI and survival models; consequently, simulations were corrected for these early dropouts as follows: the probability of dropping out before the second tumor assessment at week 6 was set to the total observed number of early dropouts in the 1,250 and 825 mg/m2 arms of study NO16853 (825 mg/m2: 17/235, 1,250 mg/m2: 25/235) divided by the total number of patients in the intent-to-treat population (binomial distribution probability = 42/470). Survival and PFS times for these patients were sampled with replacement from the observed values.
For each study replicate:
a Kaplan–Meier estimator was used to calculate the median (95% CI) PFS
the Cox proportional hazard regression model was used to calculate the HR (95% CI) for PFS between each simulated dose level and the reference 1,250 mg/m2 dose level.
The power of any study with a given starting dose to show noninferiority to the reference dose of 1,250 mg/m2 was calculated as the proportion of replicates with upper limit of HR 95% CI not exceeding 1.35 (per the statistical analysis plan of study NO16853).4
Author Contributions
R.B., F.S.S., F.G., N.F., and L.C. wrote manuscript. R.B., F.S.S., F.G., N.F., and L.C. designed research. L.L., P.C., and L.C. analyzed data.
Conflict of Interest
L.C., L.L., P.C., and R.B. are or were employees of Pharsight and contractors to Roche at the time of this work. F.S.S., F.G., and N.F. are employees of Roche.
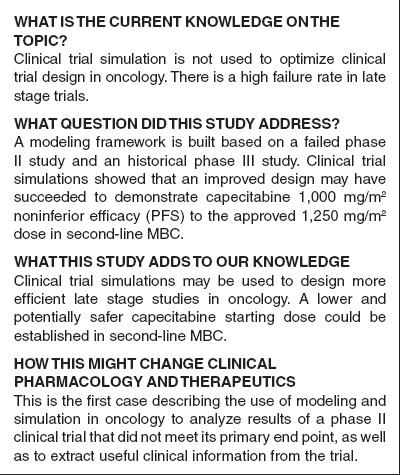
Study Highlights
Acknowledgments
This study was supported by F. Hoffmann-La Roche Ltd, Basel, Switzerland. The authors are grateful to Tanya Tolomeo (Pharsight) for editorial assistance.
Supplementary Material
References
- Budman D.R.et al. Preliminary studies of a novel oral fluoropyrimidine carbamate: capecitabine. J. Clin. Oncol 161795–1802.1998 [DOI] [PubMed] [Google Scholar]
- Reigner B., Blesch K., &, Weidekamm E. Clinical pharmacokinetics of capecitabine. Clin. Pharmacokinet. 2001;40:85–104. doi: 10.2165/00003088-200140020-00002. [DOI] [PubMed] [Google Scholar]
- O'Shaughnessy J.et al. Superior survival with capecitabine plus docetaxel combination therapy in anthracycline-pretreated patients with advanced breast cancer: phase III trial results J. Clin. Oncol 202812–2823.2002 [DOI] [PubMed] [Google Scholar]
- Buzdar A.U.et al. Randomized phase II non-inferiority study (NO16853) of two different doses of capecitabine in combination with docetaxel for locally advanced/metastatic breast cancer Ann. Oncol 23589–597.2012 [DOI] [PubMed] [Google Scholar]
- Claret L.et al. Model-based predictions of expected anti-tumor response and survival in phase III studies based on phase II data of an investigational agent J. Clin. Oncol 24307s.2006 [Google Scholar]
- Claret L.et al. Model-based prediction of phase III overall survival in colorectal cancer on the basis of phase II tumor dynamics J. Clin. Oncol 274103–4108.2009 [DOI] [PubMed] [Google Scholar]
- Kimko H.C., &, Peck C.C.eds. Clinical Trial Simulations: Applications and Trends. AAPS Advances in the Pharmaceutical Sciences Series. Vol. 1. (Springer, New York; 2011 [Google Scholar]
- Gieschke R., Reigner B.G., &, Steimer J.L. Exploring clinical study design by computer simulation based on pharmacokinetic/pharmacodynamic modelling. Int. J. Clin. Pharmacol. Ther. 1997;35:469–474. [PubMed] [Google Scholar]
- Veyrat-Follet C., Bruno R., Olivares R., Rhodes G.R., &, Chaikin P. Clinical trial simulation of docetaxel in patients with cancer as a tool for dosage optimization. Clin. Pharmacol. Ther. 2000;68:677–687. doi: 10.1067/mcp.2000.111948. [DOI] [PubMed] [Google Scholar]
- Wang Y.et al. Elucidation of relationship between tumor size and survival in non-small-cell lung cancer patients can aid early decision making in clinical drug development Clin. Pharmacol. Ther 86167–174.2009 [DOI] [PubMed] [Google Scholar]
- Claret L., Lu J.F., Sun Y.N., &, Bruno R. Development of a modeling framework to simulate efficacy endpoints for motesanib in patients with thyroid cancer. Cancer Chemother. Pharmacol. 2010;66:1141–1149. doi: 10.1007/s00280-010-1449-z. [DOI] [PubMed] [Google Scholar]
- Lindbom L., Claret L., Andre V., Cleverly A., de Alwis D., &, Bruno R.A drug independent tumor size reduction-survival model in advanced ovarian cancer to support early clinical development decisions . < http://2009.go-acop.org/sites/all/assets/webform/ ACoP%202009%20Poster%20-%20Lars%20Lindbom.pdf >. 2009. Accessed 3 June 2011.
- Bruno R.et al. Simulation of clinical outcome for pomalidomide plus low-dose dexamethasone in patients with refractory multiple myeloma based on week 8 M-protein response Blood 1181881Abstract) (2011 [Google Scholar]
- Karrison T.G., Maitland M.L., Stadler W.M., &, Ratain M.J. Design of phase II cancer trials using a continuous endpoint of change in tumor size: application to a study of sorafenib and erlotinib in non small-cell lung cancer. J. Natl. Cancer Inst. 2007;99:1455–1461. doi: 10.1093/jnci/djm158. [DOI] [PubMed] [Google Scholar]
- Bruno R., &, Claret L. On the use of change in tumor size to predict survival in clinical oncology studies: toward a new paradigm to design and evaluate phase II studies. Clin. Pharmacol. Ther. 2009;86:136–138. doi: 10.1038/clpt.2009.97. [DOI] [PubMed] [Google Scholar]
- Zielinski C., Gralow J., &, Martin M. Optimising the dose of capecitabine in metastatic breast cancer: confused, clarified or confirmed. Ann. Oncol. 2010;21:2145–2152. doi: 10.1093/annonc/mdq069. [DOI] [PubMed] [Google Scholar]
- Hénin E.et al. A dynamic model of hand-and-foot syndrome in patients receiving capecitabine Clin. Pharmacol. Ther 85418–425.2009 [DOI] [PubMed] [Google Scholar]
- Claret L., Lu J.F., Bruno R., Hsu C.P., Hei H.J., &, Sun Y.N. Simulations using a public domain drug-disease modeling framework and Phase II data predict Phase III survival outcome in first-line non-small-cell lung cancer (NSCLC) Clin. Pharmacol. Ther. 2012;92:631–634. doi: 10.1038/clpt.2012.78. [DOI] [PubMed] [Google Scholar]
- World Health Organization Handbook for Reporting Results of Cancer Treatment. (World Health Organization, Geneva, Switzerland; 1979 [Google Scholar]
- Therasse P.et al. New guidelines to evaluate the response to treatment in solid tumors. European Organization for Research and Treatment of Cancer, National Cancer Institute of the United States, National Cancer Institute of Canada J. Natl. Cancer Inst 92205–216.2000 [DOI] [PubMed] [Google Scholar]
Associated Data
This section collects any data citations, data availability statements, or supplementary materials included in this article.