

Abstract
A semiphysiologically based pharmacokinetic (semi-PBPK) model was developed to describe a unique blood, liver, and bile clinical data set for the hepatobiliary imaging agent 99mTechnetium–mebrofenin (99mTc–mebrofenin), and to simulate sites/mechanisms of a 99mTc–mebrofenin–ritonavir drug–drug interaction (DDI). The transport inhibitor ritonavir (multiple-dose: 2 × 300 mg) significantly increased systemic 99mTc–mebrofenin exposure as compared with control (4,464 ± 1,861 vs. 1,970 ± 311 nCi min/ml; mean ± SD), without affecting overall hepatic exposure or biliary recovery. A novel extrahepatic distribution compartment was required to characterize 99mTc–mebrofenin disposition. Ritonavir inhibited 99mTc–mebrofenin accumulation in human sandwich-cultured hepatocytes (SCH) (half maximal inhibitory concentration (IC50) = 3.46 ± 1.53 µmol/l). Despite ritonavir accumulation in hepatocytes, intracellular binding was extensive (97. 6%), which limited interactions with multidrug resistance protein 2 (MRP2)-mediated biliary excretion. These in vitro data supported conclusions from modeling/simulation that ritonavir inhibited 99mTc–mebrofenin hepatic uptake, but not biliary excretion, at clinically relevant concentrations. This integrated approach, utilizing modeling, clinical, and in vitro data, emphasizes the importance of hepatic and extrahepatic distribution, assessment of inhibitory potential in relevant in vitro systems, and intracellular unbound concentrations to assess transporter-mediated hepatic DDIs.
Transport proteins present in clearance organs, specifically liver and kidney, are a well-recognized source of potential drug–drug interactions (DDIs).1,2 Inhibition of uptake and/or efflux transporters in the polarized cells of clearance organs may alter drug exposure in the organ, in the systemic circulation, or in both, leading to changes in efficacy and/or toxicity.3,4 Changes in systemic exposure may be detected from the blood concentration–time curve, whereas organ exposure is more difficult to assess. However, assessing organ drug exposure is important to understand, in a comprehensive manner, the effects of altered transport function and identify the specific site(s) and magnitude of DDIs.
Scintigraphic imaging is a noninvasive technique that can be employed to determine organ exposure.5 99mTechnetium (99mTc)-labeled compounds, coupled with γ scintigraphy, have been used to estimate the hepatic exposure of drugs by assessing alterations in hepatic uptake and excretion,6,7 and to evaluate the involvement of specific transport proteins.8,9 Changes in systemic and organ exposure, as well as biliary excretion of 99mTc-labeled compounds, can be quantified using a previously validated method for bile collection, including a correction for gallbladder ejection fraction (EF).10 An integrated approach incorporating pharmacokinetic modeling and simulation of clinical data (biliary excretion, systemic, and organ exposure) can then guide in vitro investigations to elucidate sites and mechanisms of DDIs.
In vitro systems are used commonly to evaluate transporter function, and predict, or confirm DDIs.11 Membrane vesicles prepared from transfected cell lines are useful to characterize substrate specificity and inhibitory potential of a given transport protein in isolation, although the relative contribution of individual transport proteins to overall hepatic uptake or excretion is difficult to elucidate using these artificial systems. A more representative, organ-specific, whole-cell system, such as sandwich-cultured hepatocytes (SCH), can be used to investigate the relative contribution of hepatic uptake and canalicular excretion processes to overall biliary clearance, and to estimate intracellular drug concentrations.11,12
99mTechnetium–mebrofenin (99mTc–mebrofenin) (Choletec, Bracco Diagnostics, Princeton, NJ), a metabolically stable iminodiacetic acid analog, is an imaging agent utilized in nuclear medicine to diagnose structural and functional disorders of the hepatobiliary network and gallbladder.13,14,15 The efficient vectorial transport of 99mTc–mebrofenin from blood into liver is mediated by the organic anion transporting polypeptides, OATP1B1 and OATP1B3;9,16,17 99mTc–mebrofenin is preferentially excreted into bile unchanged by the canalicular efflux transporter multidrug resistance protein 2 (MRP2).9,16,18 99mTc–mebrofenin also can be excreted from hepatocytes back into blood by MRP3.9 The important role of MRP2-mediated biliary excretion as the rate-limiting step for 99mTc–mebrofenin elimination in vivo is evidenced by increased and prolonged hepatic exposure of 99mTc–mebrofenin and other iminodiacetic acid analogs in preclinical species (TR− rats) and humans (Dubin–Johnson syndrome) with genetic impairment of Mrp2/MRP2.14,18,19,20,21 Probe substrates to assess transport function in vivo are a highly sought-after clinical tool; 99mTc–mebrofenin has been proposed as a probe substrate for MRP2,11 but has yet to be tested in a clinical DDI study.
Ritonavir, an HIV protease inhibitor, is a typical component of antiretroviral therapy. Ritonavir is administered as a “boosting” agent in combination with other protease inhibitors to exploit the inhibition of intestinal P-glycoprotein transport and metabolic enzymes, thereby increasing the bioavailability of antiretroviral medications administered concomitantly.22,23 Ritonavir is also a substrate and inhibitor of the biliary transporter MRP2,24,25 with an half maximal inhibitory concentration (IC50) reported as low as 50 nmol/l in teleost fish.26 Consequently, we hypothesized that concomitant ritonavir administration would decrease the biliary excretion of 99mTc–mebrofenin, thereby increasing hepatic exposure. Ritonavir also has been reported to inhibit hepatic OATPs/Oatps, with an IC50 ranging from 0.25 to 2.5 µmol/l.27,28 Therefore, at higher concentrations, ritonavir may inhibit 99mTc–mebrofenin hepatic uptake, thereby increasing systemic exposure.
These studies employed 99mTc–mebrofenin as a probe for transport-mediated hepatobiliary clearance, with and without ritonavir as a “perpetrator” of DDIs. The blood, liver, and bile data set was used to develop a semiphysiologically based pharmacokinetic (semi-PBPK) model to describe 99mTc–mebrofenin disposition in humans, including clearance pathways mediated by transport proteins, and to elucidate potential site(s) and mechanism(s) of the 99mTc–mebrofenin–ritonavir DDI. In vitro studies were conducted using relevant model systems for hepatobiliary transport in humans to substantiate the results of pharmacokinetic modeling and simulation. We report a translational approach and suggested framework for the use of 99mTc–mebrofenin as a clinical probe to evaluate DDIs in hepatobiliary transport.
Results
Effect of ritonavir on 99mTc–mebrofenin disposition in human subjects
99mTc–mebrofenin (mean ± SD) blood concentration–time curves are shown in Figure 1a, after administration of a 2.5 mCi intravenous dose to 18 healthy volunteers either (i) alone (control; n = 8), (ii) 2 h after a single 200 mg oral ritonavir dose (n = 7), or (iii) following 300 mg oral ritonavir doses administered at 14 and 2 h before 99mTc–mebrofenin (n = 3; 2 × 300 mg). 99mTc–mebrofenin blood concentrations declined rapidly, with prompt distribution into the liver, followed by a slower terminal elimination phase. Pharmacokinetic parameters resulting from noncompartmental analysis are summarized in Table 1; area under the 99mTc–mebrofenin blood concentration–time curve (AUCblood,0-∞) was significantly greater, by approximately twofold, in subjects treated with 2 × 300 mg ritonavir as compared with control. Observed ritonavir plasma concentrations ranged from 236 to 16,100 ng/ml (0.33–20 µmol/l; Table 1). Ritonavir concentrations in plasma (and bile) were significantly greater in subjects pretreated with 2 × 300 mg ritonavir as compared with a single 200 mg dose (Table 1).
Figure 1.

99mTc–mebrofenin (a) blood concentration vs. time curves; (b) liver scintigraphy vs. time curves by treatment group (red shaded area represents mean ± SD of control); (c) liver-to-blood ratio vs. time curves; mean data by treatment group. Data are presented as group means (±SD in (a) and (b)); red = control group, open/dashed = 200 mg ritonavir group, closed/solid = 2 × 300 mg ritonavir group.
Table 1. Pharmacokinetics of 99mTc–mebrofenin in control and ritonavir pretreated subjects.
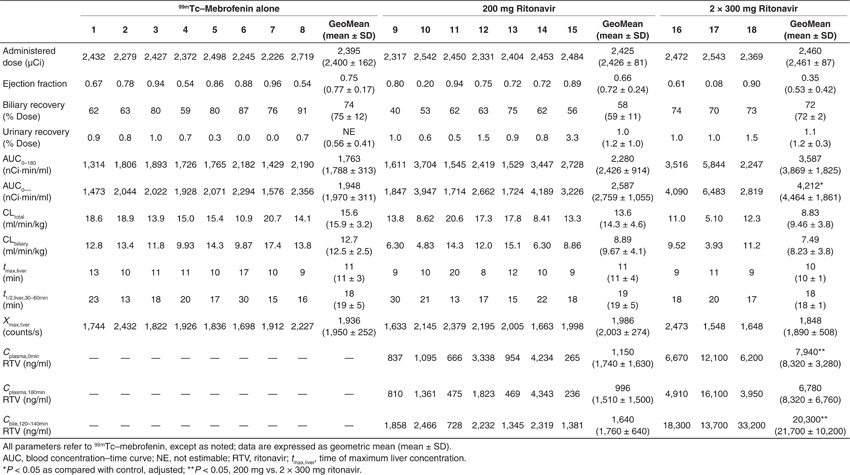
Biliary recovery of 99mTc–mebrofenin was corrected for gallbladder EF, with an EF ranging from 8% to 96% (Table 1). Biliary recovery was similar between treatment groups at 75 ± 12, 59 ± 11, and 72 ± 2% of the administered dose in control, 200 mg, and 2 × 300 mg ritonavir groups, respectively (Table 1). Urinary recovery of 99mTc–mebrofenin (~1% of the administered dose) was negligible and unaffected by ritonavir treatment.
Hepatic imaging of 99mTc–mebrofenin over 180 min revealed rapid uptake by the liver (Figure 1b). The time of maximum liver concentration was 11 ± 3, 11 ± 4, and 10 ± 1 min in control, 200 mg, and 2 × 300 mg ritonavir groups, respectively (Table 1). This agrees well with the reported value of 11 min.14,29 The elimination half-life based on hepatic time–activity curves from the current study, determined from 30 to 60 min by nonlinear regression, was 19 ± 5, 19 ± 5, and 18 ± 1 min in control, 200 mg, and 2 × 300 mg ritonavir groups, respectively (Table 1), as compared with previous reports of ~15 min.14,29 Subjects >20% of ideal body weight were excluded in this study to minimize individual differences in body mass and composition, which could result in variable attenuation of the scintigraphic imaging data. Activity at liver time of maximum concentration was 1,950 ± 252, 2,003 ± 274, and 1,890 ± 508 counts per second in control, 200 mg, and 2 × 300 mg ritonavir groups, respectively (Figure 1b and Table 1). There was no apparent difference in 99mTc–mebrofenin overall liver exposure in the presence or absence of ritonavir based on the mean liver activity profiles.
The 99mTc–mebrofenin liver-to-blood ratio was calculated using blood sampling points and corresponding liver activity from scintigraphic imaging data (Figure 1c). The peak at 40 min and subsequent decline suggested more complicated disposition than a mammillary two-compartment model representing blood and liver with constant first-order transfer rates as previously described.9,14,29
Pharmacokinetic modeling
A semi-PBPK model was developed to describe 99mTc–mebrofenin activity in blood, liver, and bile (Figure 2). The extrahepatic compartment in the semi-PBPK model represented a high-volume, slowly perfused tissue(s), with an apparent permeability-limited uptake and egress. Parameters representing transport-mediated clearance mechanisms were obtained by fitting the model to data from the two subjects with available individual attenuation-corrected liver scintigraphy data (Figure 2, Table 2; see Supplementary Material online for details). A separate model fit and parameter set were obtained for the mean control group data (biliary recovery, blood, and liver concentrations) because the “representative” control subject for which attenuation-corrected data were obtained exhibited the highest biliary recovery of all values observed. Because liver data across all subjects were not corrected for attenuation, an attenuation correction factor was included as a parameter in the model and estimated to scale counts/s data to activity in nCi/g liver (Table 2).
Figure 2.

Semi-PBPK model scheme (a) representing 99mTc–mebrofenin disposition in humans (Q denotes blood flow (ml/min), subscripts represent tissue or vascular compartments, as follows: liver (h), bile (bile), extrahepatic (“other”) tissue (o); clearance values are designated as CLuptake for influx from blood into tissue, CLefflux for efflux from tissue to blood, and CLbiliary for excretion from liver into bile). Simulations based on the semi-PBPK model and observed blood, liver, and bile curves for 99mTc–mebrofenin in subjects with quantitative scintigraphy data for (b) subject 8 (control), and (c) subject 17 (2 × 300 mg ritonavir). Circles represent observed blood samples, solid lines represent simulated blood concentrations, + symbols represent observed liver concentrations from attenuation-corrected (quantitative) scintigraphy data of the liver region of interest, dashed lines represent simulated liver concentrations, squares represent observed mass recovered in bile (corrected for gallbladder ejection fraction), and dotted lines represent simulated biliary excretion data. PBPK, physiologically based pharmacokinetic.
Table 2. Parameter estimates derived from the 99mTc–mebrofenin semiphysiologically based pharmacokinetic model based on the scheme depicted in Figure 2a.

Sensitivity analysis
Sensitivity analysis of parameter estimates on model output was conducted as described in Supplementary Material online, with resulting changes in predicted blood, and liver exposure, and biliary excretion as shown in Figure 3. Blood exposure was most sensitive to inhibition of hepatic uptake. However, impaired hepatic uptake would also be expected to decrease hepatic exposure and biliary excretion. No single parameter change explained the observed increase in 99mTc–mebrofenin blood exposure in the absence of changes in hepatic exposure or biliary excretion, indicating that a combination of factors was necessary to describe the effect of ritonavir. Hepatic exposure was particularly sensitive to impaired biliary clearance (hepatocyte-to-bile), which supports the conclusions from the clinical study that ritonavir did not significantly decrease 99mTc–mebrofenin biliary clearance. In contrast, the model was relatively insensitive to changes in efflux from tissue (hepatic or extrahepatic) back into blood.
Figure 3.

Sensitivity analysis of parameter estimates determined from the semiphysiologically based pharmacokinetic model (Figure 2; Table 2). Parameters were altered 10-fold in either direction of the values estimated for mean control data (Table 2), and the fold-change in the predicted study end points (99mTc–mebrofenin central compartment (blood) exposure, hepatic exposure, and biliary excretion) were examined. Solid lines represent influx clearance (CLuptake) from blood into tissue, dashed lines represent efflux clearance (CLefflux) from tissue to blood, and gray lines represent biliary excretion from liver into bile (CLbiliary). AUC, blood concentration–time curve.
Simulations
Simulations were conducted to explore various scenarios representing the potential impact of ritonavir on 99mTc–mebrofenin disposition. Decreased 99mTc–mebrofenin uptake and increased sinusoidal efflux only from the hepatic compartment (Figure 4, blue lines) adequately described blood and liver concentrations, but predicted a decrease in biliary excretion. This decrease was not observed in the clinical study. Decreased 99mTc–mebrofenin uptake and increased efflux back into blood from both the hepatic and extrahepatic compartments were required in simulations to describe the increase in 99mTc–mebrofenin systemic exposure observed in the presence of 2 × 300 mg ritonavir, with minimal impact on hepatic exposure and biliary recovery (Figure 4, black dashed lines).
Figure 4.

Simulations based on the 99mTc–mebrofenin semiphysiologically based pharmacokinetic model scheme (Figure 2) for 99mTc–mebrofenin (a) blood, and (b) liver concentration–time data, and (c) cumulative % dose excreted in bile resulting from parameters describing mean control data (Table 2) and the following changes in transport-mediated processes, alone and in combination. Mean control data (red); 1/3 CLuptake,h + 3x CLefflux,h (blue); 1/2 CLuptake,h and CLuptake,o + 2x CLefflux,h and CLefflux,o (dashed black); 1/2 CLbiliary (solid black); mean control data without extrahepatic compartment (gray).
In Vitro studies
The effect of ritonavir on adenosine triphosphate (ATP)-dependent uptake of 99mTc–mebrofenin by membrane vesicles prepared from human embryonic kidney cells (HEK293) transiently transfected with MRP2 was determined, as reported previously.9 Membrane vesicles were incubated for 3 min at 37 °C with 50 µCi/ml 99mTc–mebrofenin in the presence of ritonavir. Ritonavir 5 and 50 µmol/l inhibited adenosine triphosphate-dependent uptake of 99mTc–mebrofenin into MRP2-expressing HEK293 membrane vesicles by 32 ± 15 and 60 ± 2% of control, respectively (mean ± SD in triplicate). By comparison, 50 µmol/l MK571, a prototypical MRP inhibitor, reduced adenosine triphosphate-dependent transport of 99mTc–mebrofenin by 88 ± 2%.9
The effect of ritonavir on 99mTc–mebrofenin accumulation and biliary excretion in human SCH was determined (Figure 5). Ritonavir inhibited 99mTc–mebrofenin accumulation in cells + bile and cells in a concentration–dependent manner (Figure 5a), with an IC50 of 3.46 ± 1.53 µmol/l on total uptake (cells + bile), based on the extracellular dosing concentration. In contrast, ritonavir had no effect on the biliary excretion index of 99mTc–mebrofenin in SCH, consistent with the clinical data and associated pharmacokinetic analysis suggesting that ritonavir did not affect 99mTc–mebrofenin biliary clearance. Intracellular ritonavir concentrations were estimated to facilitate comparison with membrane vesicle data. Hepatocellular accumulation of ritonavir during the 10-min uptake study in human SCH was 5–10-fold higher than the dosing concentration (Figure 5b), based on estimates of cellular volume reported previously.30 On the basis of total cellular accumulation of ritonavir (up to 100 µmol/l) in human SCH, and the estimated IC50 value (5–50 µmol/l) against MRP2-mediated 99mTc–mebrofenin transport determined in membrane vesicles, ritonavir would be expected to inhibit 99mTc–mebrofenin biliary excretion in SCH. However, ritonavir was extensively bound in lysates from human hepatocytes (fu = 0.024 ± 0.006). Thus, correcting for the intracellular unbound concentration revealed that the effective cellular concentration of ritonavir was lower than the concentration necessary to significantly inhibit MRP2.
Figure 5.

Human sandwich-cultured hepatocytes (SCH) were incubated for 10 min at 37 °C with 0.5 µCi/ml 99mTc–mebrofenin in standard (cells + bile) or Ca+-free (cells) HBSS (using B-CLEAR technology) alone and with various concentrations of ritonavir in SCH from three separate donors, in triplicate. (a) 99mTc–mebrofenin accumulation and biliary excretion index (BEI) in cells + bile (closed bars) and cells (open bars) in the presence of increasing concentrations of extracellular ritonavir. 99mTc–mebrofenin BEI values (above the bars) represent mean data. (b) Ritonavir accumulation in hepatocytes (Ca2+-free HBSS) when coadministered with 99mTc–mebrofenin, represented as intracellular total concentration (Ccell,total), as described in Methods section. 99mTc–mebrofenin and ritonavir accumulation data are represented as mean ± SEM of three separate donors in triplicate (5 µmol/l data are mean ± range of two donors, in triplicate).
Discussion
This work highlights how in vitro and in silico approaches, including pharmacokinetic modeling and simulation, as well as transport studies conducted in relevant model systems, can be used to predict the site(s) and potential impact of hepatic transporter-mediated DDIs in humans in vivo. Furthermore, this clinical study demonstrates the utility of 99mTc–mebrofenin as a model organic anion to evaluate DDIs in transporter-mediated hepatobiliary clearance. To our knowledge, this is the first study that uses liver scintigraphy data to evaluate a hepatic DDI, and incorporates blood, bile, and urine data in humans to develop a comprehensive pharmacokinetic model describing 99mTc–mebrofenin disposition.
Previously published data involving administration of 99mTc–mebrofenin (and other iminodiacetic acid derivatives) in humans or animals focused on the time-activity data in blood and liver up to 60 min.14,31,32,33,34 A two-compartment model representing blood and liver reasonably approximated 0–60 min time-activity data in these studies.31,32 However, extending the time course of blood and liver observations to 180 min clearly demonstrates more complex pharmacokinetic behavior; the statistically significant, twofold increase in 99mTc–mebrofenin systemic exposure without accompanying changes in hepatic exposure or biliary recovery observed following ritonavir administration (2 × 300 mg) is not consistent with a two-compartment model. 99mTc–mebrofenin did not accumulate in extrahepatic tissues within the γ camera field-of-view, yet the liver-to-blood ratio and incomplete recovery of total activity in urine and bile suggested an extrahepatic component to 99mTc–mebrofenin disposition. Therefore, a modeling and simulation approach was undertaken to describe 99mTc–mebrofenin disposition and elucidate the probable sites of the 99mTc–mebrofenin–ritonavir interaction.
99mTc–mebrofenin rapidly and extensively distributed to the liver. The 99mTc–mebrofenin hepatic extraction ratio was 0.80 ± 0.16 ((mean ± SD), range 0.55–1) in control subjects, based on the observed clearance from noncompartmental analysis (CLtotal/Qh; Table 1). In contrast to previous reports estimating hepatic extraction at ~100%,29 this suggests that 99mTc–mebrofenin hepatic clearance would be susceptible to changes in hepatic uptake. This is consistent with the observed changes in 99mTc–mebrofenin disposition following ritonavir administration, which resulted from inhibition of uptake into both hepatic and extrahepatic sites of distribution.
Total plasma concentrations of ritonavir, measured at the beginning and end of the 3-h study period (2 and 5 h following ritonavir administration) ranged from 236 to 16,100 ng/ml (0.33 to 20 µmol/l). Intestinal absorption of ritonavir was estimated to contribute ~12,000 and 18,000 ng/ml (17 and 25 µmol/l) to the incoming portal blood for the 200 and 300 mg doses, respectively, using the previously reported approach (ka·Dose·Fa/Qh, where ka represents the absorption rate constant and Fa represents the fraction absorbed).35 The maximum estimated portal vein concentration (up to 45 µmol/l) exceeded the IC50 for 99mTc–mebrofenin uptake in human SCH (~3.5 µmol/l). Due to extensive protein binding of ritonavir (fu ~0.01), it is possible that unbound portal concentrations achieved in the present study were able to inhibit the hepatic uptake of 99mTc-mebrofenin. Human SCH data correlated well with the clinical data and pharmacokinetic modeling indicating that ritonavir inhibited 99mTc–mebrofenin hepatic uptake, with no effects on biliary excretion. The current study suggests that ritonavir may inhibit the hepatic uptake of other OATP substrates resulting in increased systemic exposure, similar to previous reports.25,28,36 The magnitude of this increase and altered exposure in hepatic and extrahepatic tissues will depend on the substrate- and tissue-specific involvement of transport-mediated distribution and clearance, and the effect of ritonavir on these processes. In addition to inhibition of uptake, parameter estimates (Table 2) suggest enhanced hepatic basolateral efflux, which may be explained by increased basolateral transporter expression (e.g., MRP3 or MRP4) and/or an increase in the unbound fraction of 99mTc–mebrofenin in the liver.
Good agreement was found between observed CLtotal of 99mTc–mebrofenin (15.9 ± 3.2 ml/min/kg in control group, Table 1) and predicted CLuptake based on in vitro uptake in human SCH (10.6 ± 3.1 ml/min/kg, Supplementary Table S4 online). Similarly, predicted CLbiliary, based on data obtained in human SCH, was 4.4 ± 1.5 ml/min/kg as compared with the observed CLbiliary of 12.5 ± 2.5 ml/min/kg in control subjects. The in vitro intrinsic CLuptake (~24 ml/min/kg Supplementary Table S4 online) was ~50-fold lower than the corresponding value (CLuptake,h; Table 2) estimated by the semi-PBPK model, which agrees well with reported scaling factors for hepatic uptake clearance in SCH.37,38,39 It should be noted that the in vitro CLuptake of 99mTc–mebrofenin in human SCH, along with the calculated IC50 value for ritonavir inhibition of 99mTc–mebrofenin accumulation, represents the net effect of all sinusoidal uptake and efflux transporters (e.g., at least OATP1B1, OATP1B3, and MRP3)9,17 involved in the hepatocellular disposition of 99mTc–mebrofenin.
Impaired function of MRP2 in humans and Mrp2 in preclinical species has been reported to delay elimination of 99mTc–mebrofenin and other iminodiacetic acid derivatives from the liver, with a significant increase in hepatic exposure and time to half-maximal concentration.14,18,19,20,21 Sensitivity analysis and simulations using data from the current study also confirmed that hepatic exposure was highly sensitive to biliary clearance; even modest (twofold) changes in this parameter should have an apparent effect on the slope of the liver time–activity curves. These data imply that 99mTc–mebrofenin clearance from liver to bile in the current study was not influenced significantly by ritonavir, even though ritonavir is an MRP2 inhibitor. Previous reports of Mrp2/MRP2 inhibition by ritonavir using a nonmammalian model system (killifish isolated proximal tubules)26 and mammalian systems (rat and human SCH), confirmed species- and substrate-specific interaction potential.25 Studies in human SCH, coupled with MRP2 membrane vesicles and ritonavir binding to human hepatocyte lysates, corroborate the lack of effect of ritonavir on 99mTc–mebrofenin biliary excretion observed in the clinical study, suggesting that the reported approach using complementary in vitro systems is useful to predict transporter-mediated DDIs in biliary excretion. Although total ritonavir accumulation in SCH exceeded the estimated IC50 for 99mTc–mebrofenin transport into MRP2-expressing membrane vesicles, extensive hepatic binding explains why intracellular ritonavir concentrations were insufficient to inhibit 99mTc–mebrofenin excretion into bile in humans. These findings demonstrate the importance of correcting for the intracellular unbound concentration when translating between isolated expression systems and whole-cell models or in vivo intracellular targets. This study also emphasizes the importance of using appropriate in vitro systems and specific substrate–inhibitor combinations to accurately assess DDI potential.
In this study, decreased hepatic uptake of 99mTc–mebrofenin in the presence of ritonavir led to increased systemic exposure but did not result in altered hepatic exposure or biliary excretion. These findings are counterintuitive until one considers the effect of 99mTc–mebrofenin extrahepatic distribution, which is also subject to alteration by ritonavir, based on the modeling and simulation results. Inhibition of 99mTc–mebrofenin uptake in both hepatic and extrahepatic sites of distribution would collectively increase systemic exposure such that decreased uptake would yield little net change in tissue exposure (dXtissue/dt = Csystemic·CLuptake). Recently, this concept was demonstrated for metformin in the setting of impaired transport function in liver and kidney.40 The extrahepatic distribution of 99mTc–mebrofenin is not surprising; semi- or whole-body PBPK models have been applied to a number of large and/or anionic drugs.41,42,43,44 An outstanding question from this clinical study is the identity of the extrahepatic site(s) of 99mTc–mebrofenin distribution, accounting for ~10–40% of the administered dose at 180 min. Observed 99mTc–mebrofenin activity was confined to the liver and gallbladder regions during the scintigraphic imaging, thereby excluding other tissues within the γ camera field-of-view, which included the bulk of the torso and resident organ systems, as potential distribution sites. Human skeletal muscle expresses transport proteins that have been implicated in drug distribution and toxicity.45,46 Further studies are required to confirm the identity of other tissue(s) involved in the extrahepatic distribution of 99mTc–mebrofenin.
The availability of quantitative (attenuation corrected) scintigraphy data in humans marks a major advance in the use of imaging agents to assess organ/tissue exposure. Although the methods have existed for many years, they are underutilized and provide a rich data set that is ideal for pharmacokinetic modeling. The present clinical study has further characterized 99mTc–mebrofenin as a clinical probe of transporter-mediated hepatobiliary clearance, and demonstrated the need to quantify 99mTc–mebrofenin in blood and urine beyond 180 min to further characterize the terminal elimination phase. A semi-PBPK modeling and in vitro systems approach elucidated unforeseen mechanisms underlying a transporter-mediated DDI at both hepatic and extrahepatic sites of 99mTc–mebrofenin distribution. In vitro studies confirmed the conclusions from modeling and simulation that ritonavir inhibited 99mTc–mebrofenin hepatic uptake, but not biliary excretion, at clinically relevant concentrations. This complimentary set of in vivo and in vitro studies demonstrates that reliable predictions of transporter-mediated hepatic DDIs can be achieved when data from appropriate in vitro models (e.g., assessment of inhibitory potential in relevant systems; biliary excretion assessed in SCH) are integrated with knowledge regarding drug disposition (e.g., hepatic and extrahepatic distribution; plasma and intracellular binding) using a quantitative systems approach.
Methods
Clinical protocol. A randomized, open-label, two arm, parallel study approved by the University of North Carolina institutional review board, was conducted in the clinical and translational research center. Written informed consent was obtained from all subjects before enrollment. Healthy male and female subjects (19–29 years of age), within 20% of ideal body weight (51–91 kg), were admitted to the Clinical and Translational Research Center the evening before the procedure (see Supplementary Table S1 online for detailed demographic information).
A customized oroenteric tube was positioned in the upper small intestine, using the protocol described previously.10 Following tube placement, the balloon was inflated with 20 ml of air, and then subjects were positioned under a γ camera in the supine position. A 2.5 mCi intravenous bolus dose of 99mTc–mebrofenin was administered via an indwelling catheter placed in a forearm vein; subjects randomized to the ritonavir-treated group also swallowed two 100 mg capsules of ritonavir before placement of the oroenteric tube, which occurred ~2 h before 99mTc–mebrofenin administration. Blood samples were collected from a catheter placed in the arm opposite of 99mTc–mebrofenin administration at baseline, and at designated time points up to 180 min after administration of the 99mTc–mebrofenin dose. Biliary secretions were aspirated continuously via the oroenteric catheter and pooled over predetermined intervals throughout the study. Urine was collected at baseline and pooled over 180 min. Anterior and posterior scintigraphic images of the abdomen were acquired dynamically in the 99mTc window (140 KeV ± 15%) at 1-min intervals using a dual headed γ camera. Two hours after 99mTc–mebrofenin administration, 0.02 µg/kg cholecystokinin octapeptide (CCK-8, Kinevac; Bracco Diagnostics) was administered as a 30-min intravenous infusion. The gallbladder EF was calculated from the abdominal scintigraphy images and total biliary recovery of 99mTc–mebrofenin was corrected for EF to minimize intersubject variability associated with gallbladder response to CCK-8 as described previously.10 Blood, bile, and urine samples were analyzed for 99mTc–mebrofenin radioactivity with a sodium iodide well counter, and corrected for decay (99mTc t1/2 = 6.01 h). Bile samples associated with bulk gallbladder emptying following CCK-8 administration at 120 min, as well as plasma samples at 0 and 180 min (~120 and 300 min after the ritonavir dose) were analyzed for ritonavir by high-performance liquid chromatography or liquid chromatography–mass spectrometry/mass spectrometry as described previously.47,48 99mTc–mebrofenin activity was determined in counts/min from the geometric mean of the anterior and posterior scintigraphic images, thereby normalizing for the abdominal thickness of the individual subject. Liver time–activity curves were generated by scaling activity in a region of interest over the right upper quadrant to activity in the whole liver based on the initial uptake phase, thereby excluding gallbladder interference from the 0 to 180 min liver activity curve.
Protocol modifications. Upon approval by the University of North Carolina institutional review board, the clinical protocol was modified to include an increased dose of ritonavir: 300 mg (three, 100 mg capsules) upon admission and before oroenteric tube placement (~14 and 2 h, respectively, before 99mTc–mebrofenin administration). This 2 × 300 mg ritonavir regimen was intended to increase plasma ritonavir concentrations to a steady-state and reduce intersubject variability observed in the group of subjects treated with the single 200 mg dose regimen. In addition, a transmission-emission acquisition was performed before injection of 99mTc–mebrofenin for the final control and ritonavir-treated subjects using a cobalt-57 flood source to determine the effect of photon attenuation, as described in Supplementary Material online.
Pharmacokinetic analysis. The area under the blood concentration–time curve for 99mTc–mebrofenin was determined by noncompartmental analysis using WinNonlin Phoenix, v6.1 (St. Louis, MO). AUC0–180 min and AUC0–∞ were calculated using the linear trapezoidal rule; extrapolation to infinity was determined by the slope from linear regression of the last 3–6 time points.
A semi-PBPK model was developed to describe 99mTc–mebrofenin distribution and elimination (Figure 2), consisting of a central (blood) compartment, five-compartment liver representing the “dispersion” model of hepatic elimination, and extrahepatic tissue compartment. Transfer between blood and tissue was denoted by transport-mediated clearance processes; passive diffusion was assumed to be negligible based on data reported previously from in vitro systems.9,17 Differential equations describing the disposition of 99mTc–mebrofenin and the modeling procedures are detailed in Supplementary Material online.
In vitro studies. Hepatocytes were purchased from Celsis In Vitro Technologies (Baltimore, MD) or kindly provided by Life Technologies (Research Triangle Park, NC), and Triangle Research Labs (Research Triangle Park, NC) and plated on 24-well Biocoat plates (BD Biosciences, San Jose, CA) and overlaid with Matrigel (BD Biosciences) as described previously.12 Hepatocyte donors consisted of two Caucasians and one African-American, ranging from 46 to 59 years of age, and body mass index from 25.6 to 29.8 kg/m2. Cell cultures were maintained and accumulation studies were conducted on day 7 in SCH with 0.5 µCi/ml 99mTc–mebrofenin in the presence or absence of ritonavir, as described previously,12 and further detailed in Supplementary Material online.
Membrane vesicles were prepared from MRP2 overexpressing HEK293 cells, and transport assays were carried out by a rapid filtration method as described previously.9,49
Human hepatocytes from two donors were used to determine the extent of ritonavir binding to cellular components by equilibrium dialysis as described previously.50 Pellets containing 10 million hepatocytes were diluted in 10 volumes of phosphate buffer and homogenized by probe sonication. Ritonavir was added to a concentration of 1 µmol/l, and aliquots (n = 3) were loaded into a 96-well equilibrium dialysis apparatus (HTDialysis, LLC; Gales Ferry, CT) and dialyzed against phosphate buffer for 6 h with shaking at 37 °C. Ritonavir was quantitated by liquid chromatography–mass spectrometry/mass spectrometry, and the unbound fraction was corrected for dilution as described previously:50
Where D is the dilution factor.
Statistical analysis. Statistically significant differences in pharmacokinetic parameters across all three treatment groups were assessed by ANOVA on ranks, adjusted using Dunnett's multiple comparisons test. Comparison of ritonavir concentrations between the two ritonavir-treated groups was performed using Wilcoxon Rank Sum. The criterion for significance in all cases was P < 0.05.
Author Contributions
N.D.P., S.L.G., G.G., and K.L.R.B. wrote the manuscript. K.L.R.B., N.D.P., G.G., and M.I. designed the research. N.D.P., S.L.G., B.S., M.I., W.D.H., and L.M.G. performed the research. N.D.P., B.S., and M.I. analyzed the data.B.S. and M.I. contributed new reagents or analytic tools.
Conflict of Interest
K.L.R.B. is chair of the Scientific Advisory Board for Qualyst Transporter Solutions, which has exclusively licensed the sandwich-cultured hepatocyte technology for quantification of biliary excretion (B-CLEAR).
Study Highlights

Acknowledgments
Research reported in this publication was supported by the National Institutes of Health under award number R01GM41935 from the National Institute of General Medical Sciences, and by the National Center for Research Resources and the National Center for Advancing Translational Sciences through Grant Award Numbers UL1TR000083, UL1RR025747, and M01RR00046. The content is solely the responsibility of the authors and does not necessarily represent the official views of the National Institutes of Health. This research also was supported, in part, by the University of North Carolina at Chapel Hill Center for AIDS Research (AI50410) Clinical Pharmacology and Analytical Chemistry Core. S.L.G. was supported by a Clinical Pharmacokinetics/Pharmacodynamics fellowship sponsored by GlaxoSmithKline. Phoenix WinNonlin software was generously provided to the Division of Pharmacotherapy and Experimental Therapeutics, UNC Eshelman School of Pharmacy, by Certara as a member of the Pharsight Academic Center of Excellence Program. The expert technical assistance of Ann Whitlow, Joshua Etten, and Jennifer Barner are gratefully acknowledged. The assistance of Amar Mehta, Ryan Criste, Betty Ngo, Lakshmi Vasist, Brian Ferslew, Noelia Nebot, and Ahsan Rizwan in the conduct of this study is gratefully acknowledged.
Supplementary Material
References
- US Food and Drug Administration . US Department of Health and Human Services, FDA, Center for Drug Use and Evaluation (CDER), Silver Spring, MD; 2012. Draft Guidance for Industry: Drug Interaction Studies, Study Design, Data Analysis, Implications for Dosing, and Labeling Recommendations. [Google Scholar]
- European Medical Agency . Committee for Human Medicinal Products (CHMP), London, UK; 2012. Guideline on the Investigation of Drug Interactions. [Google Scholar]
- Funk C. The role of hepatic transporters in drug elimination. Expert Opin. Drug Metab. Toxicol. 2008;4:363–379. doi: 10.1517/17425255.4.4.363. [DOI] [PubMed] [Google Scholar]
- Pauli-Magnus C., &, Meier P.J. Hepatobiliary transporters and drug-induced cholestasis. Hepatology. 2006;44:778–787. doi: 10.1002/hep.21359. [DOI] [PubMed] [Google Scholar]
- Hendrikse N.H., Franssen E.J., van der Graaf W.T., Vaalburg W., &, de Vries E.G. Visualization of multidrug resistance in vivo. Eur. J. Nucl. Med. 1999;26:283–293. doi: 10.1007/s002590050390. [DOI] [PubMed] [Google Scholar]
- Michael M.et al. Relationship of hepatic functional imaging to irinotecan pharmacokinetics and genetic parameters of drug elimination J. Clin. Oncol 244228–4235.2006 [DOI] [PubMed] [Google Scholar]
- Wong M.et al. Predictors of vinorelbine pharmacokinetics and pharmacodynamics in patients with cancer J. Clin. Oncol 242448–2455.2006 [DOI] [PubMed] [Google Scholar]
- Chen C.C.et al. Detection of in vivo P-glycoprotein inhibition by PSC 833 using Tc-99m sestamibi Clin. Cancer Res 3545–552.1997 [PubMed] [Google Scholar]
- Ghibellini G., Leslie E.M., Pollack G.M., &, Brouwer K.L.R. Use of tc-99m mebrofenin as a clinical probe to assess altered hepatobiliary transport: integration of in vitro, pharmacokinetic modeling, and simulation studies. Pharm. Res. 2008;25:1851–1860. doi: 10.1007/s11095-008-9597-0. [DOI] [PMC free article] [PubMed] [Google Scholar]
- Ghibellini G., Johnson B.M., Kowalsky R.J., Heizer W.D., &, Brouwer K.L.R. A novel method for the determination of biliary clearance in humans. AAPS J. 2004;6:e33. doi: 10.1208/aapsj060433. [DOI] [PMC free article] [PubMed] [Google Scholar]
- Giacomini K.M.et al. Membrane transporters in drug development Nat Rev Drug Discov 9215–236.2010 [DOI] [PMC free article] [PubMed] [Google Scholar]
- Swift B., Pfeifer N.D., &, Brouwer K.L.R. Sandwich-cultured hepatocytes: an in vitro model to evaluate hepatobiliary transporter-based drug interactions and hepatotoxicity. Drug Metab. Rev. 2010;42:446–471. doi: 10.3109/03602530903491881. [DOI] [PMC free article] [PubMed] [Google Scholar]
- Balon H.R.et al. Procedure guideline for hepatobiliary scintigraphy. Society of Nuclear Medicine J. Nucl. Med 381654–1657.1997 [PubMed] [Google Scholar]
- Doo E., Krishnamurthy G.T., Eklem M.J., Gilbert S., &, Brown P.H. Quantification of hepatobiliary function as an integral part of imaging with technetium-99m-mebrofenin in health and disease. J. Nucl. Med. 1991;32:48–57. [PubMed] [Google Scholar]
- Loberg M.D., Cooper M., Harvey E., Callery P., &, Faith W. Development of new radiopharmaceuticals based on N-substitution of iminodiacetic acid. J. Nucl. Med. 1976;17:633–638. [PubMed] [Google Scholar]
- Swift B., Yue W., &, Brouwer K.L.R. Evaluation of (99m)technetium-mebrofenin and (99m)technetium-sestamibi as specific probes for hepatic transport protein function in rat and human hepatocytes. Pharm. Res. 2010;27:1987–1998. doi: 10.1007/s11095-010-0203-x. [DOI] [PMC free article] [PubMed] [Google Scholar]
- de Graaf W.et al. Transporters involved in the hepatic uptake of (99m)Tc-mebrofenin and indocyanine green J. Hepatol 54738–745.2011 [DOI] [PubMed] [Google Scholar]
- Bhargava K.K.et al. Adenosine triphosphate-binding cassette subfamily C member 2 is the major transporter of the hepatobiliary imaging agent (99m)Tc-mebrofenin J. Nucl. Med 501140–1146.2009 [DOI] [PubMed] [Google Scholar]
- Pinós T., Figueras C., &, Herranz R. Scintigraphic diagnosis of Dubin-Johnson syndrome: DISIDA is also useful. Am. J. Gastroenterol. 1991;86:1687–1688. [PubMed] [Google Scholar]
- Hendrikse N.H.et al. In vivoimaging of hepatobiliary transport function mediated by multidrug resistance associated protein and P-glycoprotein Cancer Chemother. Pharmacol 54131–138.2004 [DOI] [PubMed] [Google Scholar]
- Pinós T., Constansa J.M., Palacin A., &, Figueras C. A new diagnostic approach to the Dubin-Johnson syndrome. Am. J. Gastroenterol. 1990;85:91–93. [PubMed] [Google Scholar]
- Hirsch M.S. Initiating therapy: when to start, what to use. J. Infect. Dis. 2008;197suppl. 3:S252–S260. doi: 10.1086/533416. [DOI] [PubMed] [Google Scholar]
- Vourvahis M., &, Kashuba A.D. Mechanisms of pharmacokinetic and pharmacodynamic drug interactions associated with ritonavir-enhanced tipranavir. Pharmacotherapy. 2007;27:888–909. doi: 10.1592/phco.27.6.888. [DOI] [PubMed] [Google Scholar]
- Huisman M.T.et al. Multidrug resistance protein 2 (MRP2) transports HIV protease inhibitors, and transport can be enhanced by other drugs AIDS 162295–2301.2002 [DOI] [PubMed] [Google Scholar]
- Ye Z.W., Camus S., Augustijns P., &, Annaert P. Interaction of eight HIV protease inhibitors with the canalicular efflux transporter ABCC2 (MRP2) in sandwich-cultured rat and human hepatocytes. Biopharm. Drug Dispos. 2010;31:178–188. doi: 10.1002/bdd.701. [DOI] [PubMed] [Google Scholar]
- Gutmann H., Fricker G., Drewe J., Toeroek M., &, Miller D.S. Interactions of HIV protease inhibitors with ATP-dependent drug export proteins. Mol. Pharmacol. 1999;56:383–389. doi: 10.1124/mol.56.2.383. [DOI] [PubMed] [Google Scholar]
- Ye Z.W., Augustijns P., &, Annaert P. Cellular accumulation of cholyl-glycylamido-fluorescein in sandwich-cultured rat hepatocytes: kinetic characterization, transport mechanisms, and effect of human immunodeficiency virus protease inhibitors. Drug Metab. Dispos. 2008;36:1315–1321. doi: 10.1124/dmd.107.019398. [DOI] [PubMed] [Google Scholar]
- Annaert P., Ye Z.W., Stieger B., &, Augustijns P. Interaction of HIV protease inhibitors with OATP1B1, 1B3, and 2B1. Xenobiotica. 2010;40:163–176. doi: 10.3109/00498250903509375. [DOI] [PubMed] [Google Scholar]
- Krishnamurthy S., &, Krishnamurthy G.T. Technetium-99m-iminodiacetic acid organic anions: review of biokinetics and clinical application in hepatology. Hepatology. 1989;9:139–153. doi: 10.1002/hep.1840090123. [DOI] [PubMed] [Google Scholar]
- Lee J.K., Brouwer K.R. Determination of intracellular volume of rat and human sandwich-cultured hepatocytes (Abstract ID 1595) The Toxicologist, Supplement to Toxicological Sciences. 2010;114:339. [Google Scholar]
- Chervu L.R., Nunn A.D., &, Loberg M.D. Radiopharmaceuticals for hepatobiliary imaging. Semin. Nucl. Med. 1982;12:5–17. doi: 10.1016/s0001-2998(82)80025-1. [DOI] [PubMed] [Google Scholar]
- Hawkins R.A.et al. Radionuclide evaluation of liver transplants Semin. Nucl. Med 18199–212.1988 [DOI] [PubMed] [Google Scholar]
- Brown P.H., Juni J.E., Lieberman D.A., &, Krishnamurthy G.T. Hepatocyte versus biliary disease: a distinction by deconvolutional analysis of technetium-99m IDA time-activity curves. J. Nucl. Med. 1988;29:623–630. [PubMed] [Google Scholar]
- Peters A.M., Myers M.J., Mohammadtaghi S., Mubashar M., &, Mathie R.T. Bidirectional transport of iminodiacetic organic anion analogues between plasma and hepatocyte. Eur. J. Nucl. Med. 1998;25:766–773. doi: 10.1007/s002590050281. [DOI] [PubMed] [Google Scholar]
- Ito K.et al. Which concentration of the inhibitor should be used to predict in vivo drug interactions from in vitro data AAPS PharmSci 4E25.2002 [DOI] [PMC free article] [PubMed] [Google Scholar]
- van Heeswijk R.P.et al. Time-dependent interaction between lopinavir/ritonavir and fexofenadine J. Clin. Pharmacol 46758–767.2006 [DOI] [PubMed] [Google Scholar]
- Jones H.M.et al. Mechanistic pharmacokinetic modeling for the prediction of transporter-mediated disposition in humans from sandwich culture human hepatocyte data Drug Metab. Dispos 401007–1017.2012 [DOI] [PubMed] [Google Scholar]
- Ménochet K., Kenworthy K.E., Houston J.B., &, Galetin A. Use of mechanistic modeling to assess interindividual variability and interspecies differences in active uptake in human and rat hepatocytes. Drug Metab. Dispos. 2012;40:1744–1756. doi: 10.1124/dmd.112.046193. [DOI] [PMC free article] [PubMed] [Google Scholar]
- Abe K., Bridges A.S., Yue W., &, Brouwer K.L.R.In vitrobiliary clearance of angiotensin II receptor blockers and 3-hydroxy-3-methylglutaryl-coenzyme A reductase inhibitors in sandwich-cultured rat hepatocytes: comparison with in vivo biliary clearance J. Pharmacol. Exp. Ther 326983–990.2008 [DOI] [PMC free article] [PubMed] [Google Scholar]
- Higgins J.W., Bedwell D.W., &, Zamek-Gliszczynski M.J. Ablation of both organic cation transporter (OCT)1 and OCT2 alters metformin pharmacokinetics but has no effect on tissue drug exposure and pharmacodynamics. Drug Metab. Dispos. 2012;40:1170–1177. doi: 10.1124/dmd.112.044875. [DOI] [PubMed] [Google Scholar]
- Watanabe T., Kusuhara H., Maeda K., Shitara Y., &, Sugiyama Y. Physiologically based pharmacokinetic modeling to predict transporter-mediated clearance and distribution of pravastatin in humans. J. Pharmacol. Exp. Ther. 2009;328:652–662. doi: 10.1124/jpet.108.146647. [DOI] [PubMed] [Google Scholar]
- Poirier A., Funk C., Scherrmann J.M., &, Lavé T. Mechanistic modeling of hepatic transport from cells to whole body: application to napsagatran and fexofenadine. Mol. Pharm. 2009;6:1716–1733. doi: 10.1021/mp8002495. [DOI] [PubMed] [Google Scholar]
- Jones H.M., Parrott N., Jorga K., &, Lavé T. A novel strategy for physiologically based predictions of human pharmacokinetics. Clin. Pharmacokinet. 2006;45:511–542. doi: 10.2165/00003088-200645050-00006. [DOI] [PubMed] [Google Scholar]
- Kawai R., Mathew D., Tanaka C., &, Rowland M. Physiologically based pharmacokinetics of cyclosporine A: extension to tissue distribution kinetics in rats and scale-up to human. J. Pharmacol. Exp. Ther. 1998;287:457–468. [PubMed] [Google Scholar]
- Takeda M.et al. Evidence for a role of human organic anion transporters in the muscular side effects of HMG-CoA reductase inhibitors Eur. J. Pharmacol 483133–138.2004 [DOI] [PubMed] [Google Scholar]
- Knauer M.J.et al. Human skeletal muscle drug transporters determine local exposure and toxicity of statins Circ. Res 106297–306.2010 [DOI] [PubMed] [Google Scholar]
- Rezk N.L., Crutchley R.D., Yeh R.F., &, Kashuba A.D. Full validation of an analytical method for the HIV-protease inhibitor atazanavir in combination with 8 other antiretroviral agents and its applicability to therapeutic drug monitoring. Ther. Drug Monit. 2006;28:517–525. doi: 10.1097/00007691-200608000-00006. [DOI] [PubMed] [Google Scholar]
- Jung B.H., Rezk N.L., Bridges A.S., Corbett A.H., &, Kashuba A.D. Simultaneous determination of 17 antiretroviral drugs in human plasma for quantitative analysis with liquid chromatography-tandem mass spectrometry. Biomed. Chromatogr. 2007;21:1095–1104. doi: 10.1002/bmc.865. [DOI] [PubMed] [Google Scholar]
- Leslie E.M., Mao Q., Oleschuk C.J., Deeley R.G., &, Cole S.P. Modulation of multidrug resistance protein 1 (MRP1/ABCC1) transport and atpase activities by interaction with dietary flavonoids. Mol. Pharmacol. 2001;59:1171–1180. doi: 10.1124/mol.59.5.1171. [DOI] [PubMed] [Google Scholar]
- Kalvass J.C., &, Maurer T.S. Influence of nonspecific brain and plasma binding on CNS exposure: implications for rational drug discovery. Biopharm. Drug Dispos. 2002;23:327–338. doi: 10.1002/bdd.325. [DOI] [PubMed] [Google Scholar]
Associated Data
This section collects any data citations, data availability statements, or supplementary materials included in this article.