

J Lippert, M Brosch, O von Kampen, M Meyer, H.-U Siegmund, C Schafmayer, T Becker, B Laffert, L Görlitz, S Schreiber, PJ Neuvonen, M Niemi, J Hampe and L Kuepfer
CPT: Pharmacometrics & Systems Pharmacology 1, e13 (2012); doi:10.1038/psp.2012.14
The authors note that due to a printer error, Figure 3b appears incorrectly in part. The Y-axis label should instead appear as “Pravastatin plasma conc. (µmol/l).” The corrected figure and its legend appear below.
Figure 3.
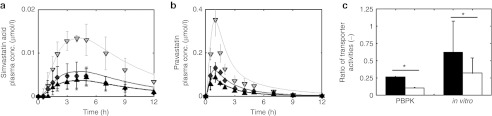
Validation of physiology-based pharmacokinetic (PBPK) models for simvastatin acid and pravastatin at the organism level and at the molecular scale. (a,b) Model-based prediction of pharmacokinetic phenotypes. After adjustment of model parameters with respect to the homozygous genotype TT (black; experiment: triangle (up)), the minor frequent homozygous genotype (CC, light gray; experiment: triangle (down)) was simulated by decreasing the transporter activity for (a) simvastatin acid28 and (b) pravastatin27 (all simulations are indicated by a solid line). Taking the average of the transporter activity of both homozygous genotypes correctly predicts the plasma curves of the heterozygous genotype (TC, dark gray; triangle diamonds) for both drugs. (c) Model-based prediction of the effect of the solute carrier organic anion transporter family member 1B1 single-nucleotide polymorphism on the transporter activities at the molecular scale. The ratio of transporter activities  is different for simvastatin acid (black) and pravastatin (white). This PBPK model-based finding (left) could be verified with in vitro assays (right) using HEK 293 cells and [3H]-labeled pravastatin and simvastatin acid. *P < 1 × 10⁻⁴, randomization test.