Abstract
A mathematical model component that extends an existing physiologically based multiscale systems pharmacology model (MSPM) of calcium and bone homeostasis was developed, enabling prediction of nonlinear changes in lumbar spine bone mineral density (LSBMD). Data for denosumab, a monoclonal antibody osteoporosis treatment, dosed at several levels and regimens, was used for fitting the BMD component. Bone marker and LSBMD data extracted from the literature described on/off-treatment effects of denosumab over 48 months [Miller, P.D. et al. Effect of denosumab on bone density and turnover in postmenopausal women with low bone mass after long-term continued, discontinued, and restarting of therapy: a randomized blinded phase 2 clinical trial. Bone 43, 222–229 (2008)]. An indirect model linking bone markers to LSBMD was embedded in the existing MSPM, reasonably predicting nonlinear increases in LSBMD during treatment (24 months); LSBMD declines following discontinuation and increases upon treatment reinstitution. This study demonstrates the utility of MSPM extension to describe a phenomena of interest not originally in a model, and the ability of this updated MSPM to predict nonlinear longitudinal changes in the clinically relevant endpoint, LSBMD, with denosumab treatment.
Osteoporosis is a silent disease, defined by decreased bone mineral density (BMD) with age, leading to an increased risk of bone fracture. Although both men and women lose bone mass as they age, in women, rapid losses in BMD accompany menopause during the fourth or fifth decade of life and then continue in the absence of therapeutic intervention. Often, extent of bone loss experienced during this period results in osteoporosis (>2.5 SD below mean peak bone mass of average young adults) or osteopenia (1.0–2.5 SD below mean peak bone mass of average young adults).1 In this population, the former condition is referred to as postmenopausal osteoporosis. In postmenopausal osteoporosis, disease progression results in elevated fracture rates in vertebrae and hip joints, increased associated mortality, and significant health-care costs.2,3,4 Therefore, although treatments exist for slowing or reversing BMD losses, postmenopausal osteoporosis still represents an ongoing clinical challenge with significant quality of life and monetary costs.
Screening and development of treatments for osteoporosis relies heavily on predictive biomarkers to inform the probability of reducing fracture rates before the execution of confirmatory clinical trials. Although fracture rates are a significant problem, in part because of comorbidity, the overall low-incidence rates makes confirmatory trials necessarily large and expensive. Therefore, biomarkers of disease modification provide important data about the likelihood of success or failure of new therapies under development. Two classes of clinically relevant biomarkers are most frequently used in the bone field. Bone turnover markers (BTMs) provide information on the rate and magnitude of bone formation produced by osteoblasts (OBs) and resorption produced by osteoclasts (OCs), whereas BMD reflects bone mass that often correlates with bone strength, and is considered the gold standard for monitoring and diagnosing osteoporosis.5
Efforts to correlate BTMs with BMD and to quantify their predictive value have ranged from simple linear regression to the use of artificial neural networks (e.g.,in refs. 6,7,8,9). In the overwhelming majority, these models were discrete event models using either the maximum change in a BTM, or a collection of BTMs, to attempt to predict BMD. They have shown differing degrees of predictive ability and usually have been case specific with respect to a specific therapeutic or therapeutic class under investigation. These disappointing results led Vestergaard et al. to conclude “Simple clinical and biochemical variables are not useful to predict spinal and femoral BMD in the individual perimenopausal woman.”8
In contrast to prior efforts to correlate BTMs with BMD, a multiscale systems pharmacology model (MSPM) with sufficient details would be expected to be able to predict these and other physiologically related phenomena. An investigator would then be equipped with a tool to compliment and inform clinical investigation and assist in designing related studies. With significantly less effort, costs, and risk, than conducting a clinical study, longitudinal on- and off-treatment effects, the results of combination treatment, and drug effect changes in cases of disease progression could be simulated. Then, based upon this information, directed studies could be executed with specified sampling schemes and supported design elements. Such a composite model, therefore, has the potential to simulate multiple end points of interest simultaneously, as though collected from a patient, and used to inform trial design and, a priori, assess the potential for a compound to produce treatment effects of interest.
In this study, we provide an example of this process of extending an existing MSPM. The example is a simple extension of a previously published mathematical multiscale model of calcium and bone homeostasis to enable accurate predictions of nonlinear changes in lumbar spine BMD (LSBMD). The preexisting calcium and bone homeostasis model draws on decades of published literature and addresses the complex relationships between the cells, cytokines, and calcium balance required for survival. It has been used to describe observed clinical effects due to hyper- and hypoparathyroidism, anabolic and catabolic bone therapeutics, and progressive renal failure.10 Thus, an important aspect of this study is the ease of mathematical extension, that in this case describes the resultant changes in LSBMD during a specific antiresorptive treatment. As it is not reasonable to re-create the entire underlying model within this publication due to article size restrictions, readers are directed to www.opendiseasemodels.org. At the website, an addendum providing minor corrections to original model publication text as well as the entire set of equations for the comprehensive model can be downloaded (model code provided in R).
The component of the model that extends its utility to the clinical outcomes level by predicting changes induced in LSBMD includes on- and off-treatment observations and a robust range of doses and regimens of denosumab. Of note, the LSBMD model and parameter estimates described here were subsequently used to predict LSBMD changes following progressive renal failure and were reported in that study as arising from “unpublished data.”11 Thus, that previously unpublished analysis of denosumab clinical data is what is being presented herein.
As background, denosumab is a fully human monoclonal IgG2 antibody that binds with high affinity and specificity to receptor activator of NF-κB ligand (RANKL), inhibiting its binding to the receptor activator of NF-κB receptor on OCs.12,13,14 In the absence of RANKL, OCs are not formed (i.e., no differentiation) and mature OCs enter apoptosis. Thus, RANKL inhibition represents a discrete intercession point in the biological link between bone resorption by OCs and bone formation by OBs. As the action of denosumab impacts only this single critical element of the bone morphogenic units, all levels of markers, electrolytes, cytokines, and changes in BMD can be considered downstream results of RANKL inhibition. The ability of the model to describe the observed data and predictions of controlling cytokine levels are presented herein, as well.
Overall, the results of this analysis demonstrate the utility and extensibility of properly derived MSPMs. Such models can be used to inform and increase the efficiency of clinical trials by increasing our understanding of the underlying physiology and impact of target modulation. They allow quantitative simulations of plausible outcomes to answer clinically relevant questions and in some cases obviate the need for “best guesses” of trial design elements. Of note, the models are not strictly tied to a single target or therapeutic class, and can be extended quickly by the addition of physiologic or cellular components of interest, as demonstrated here for LSBMD, and enabled by incorporation into the underlying bone and calcium homeostasis MSPM.
Results
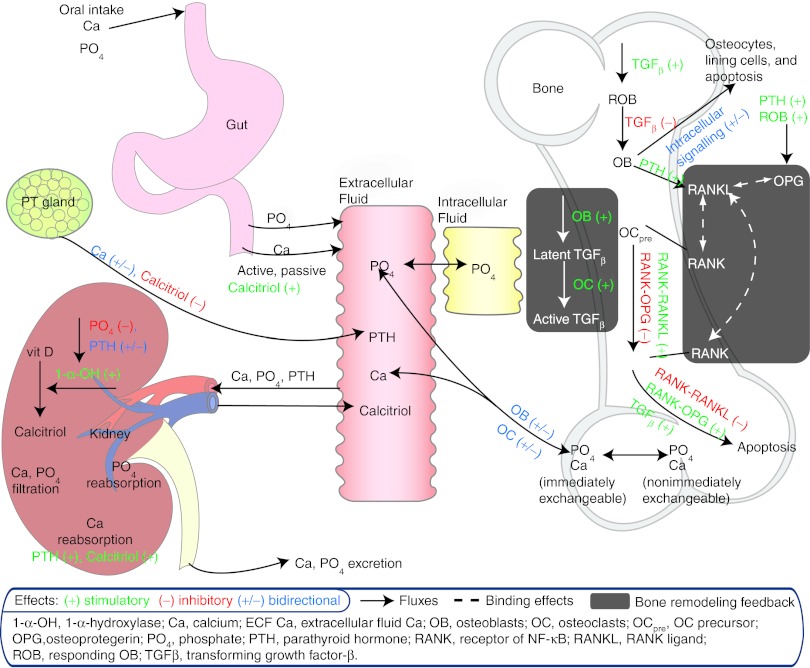
A mathematical model component that extends a previously published physiologically based model of calcium and bone homeostasis10 has been constructed, enabling predictions of nonlinear changes in LSBMD during and following discontinuation and reinstitution of treatment with denosumab. The added component uses a single differential equation that links longitudinal changes in C-terminal cross-linking telopeptide of type I collagen (CTx), and bone-specific alkaline phosphatase (BSAP) to generate predictions of nonlinear changes in LSBMD over time (Eq. 1). Feedback to predict off-treatment or reinstitution of treatment BTM observations is provided within the model, as previously published and without needed changes in the prior parameters, through the described inherent biological relationships of parathyroid hormone, NF-κB /RANKL/osteoprotegerin, and transforming growth factor β (TGF-β)15,16,17,18 (Figure 1)
Figure 1.
Schematic of physiologic system model to describe calcium homeostasis and bone remodeling (modified from Figure 1 of Peterson and Riggs).10
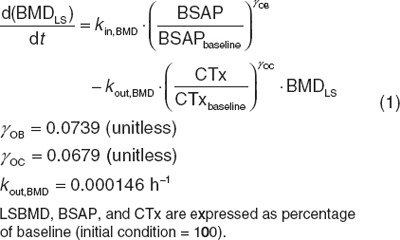 |
LSBMD is predicted using a zero-order production rate (solved under the initial conditions) that is affected by OB function and a first-order elimination that is affected by OC function. Sigmoidicity terms for each bone marker are estimated to describe the steepness of LSBMD change relative to the proportional change in the marker.
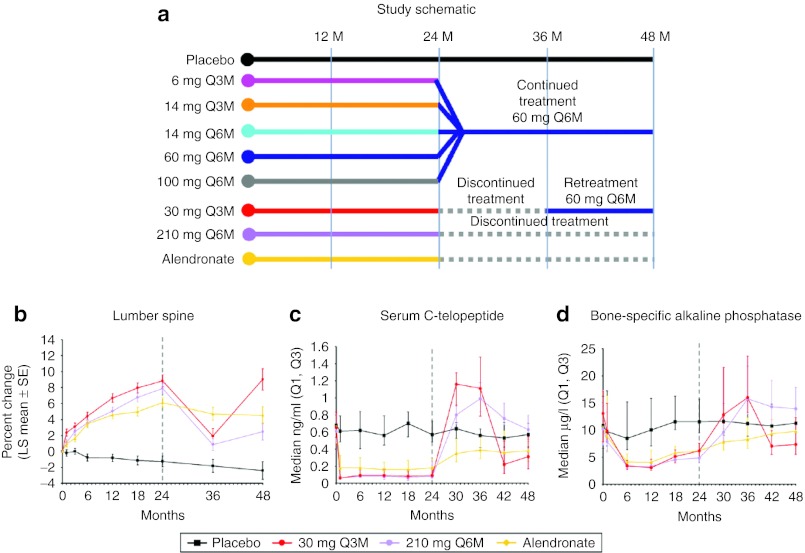
For ease of reference to the reader, the study schema and the observed central tendency estimator and variability at each measurement time for LSBMD, CTx, and BSAP are provided from Miller et al.14 for the two dose groups that had a reported period without treatment during the 4-year study duration (30 mg every 3 months (Q3M) and 210 mg every 6 months (Q6M)) (Figure 2).
Figure 2.
(a) Study design for the denosumab dose ranging trial and (b) resulting mean lumbar spine bone mineral density percent change, (c) median serum C-telopeptide, and (d) median serum bone-specific alkaline phosphatase. Treatment groups are placebo (black), 30 mg every 3 months for 8 doses and changed to 60 mg every 6 months starting on month 36 (red); 210 mg every 6 months for four doses then discontinued (purple), and the active control, Alendronate (yellow). Reprinted from Miller et al.14
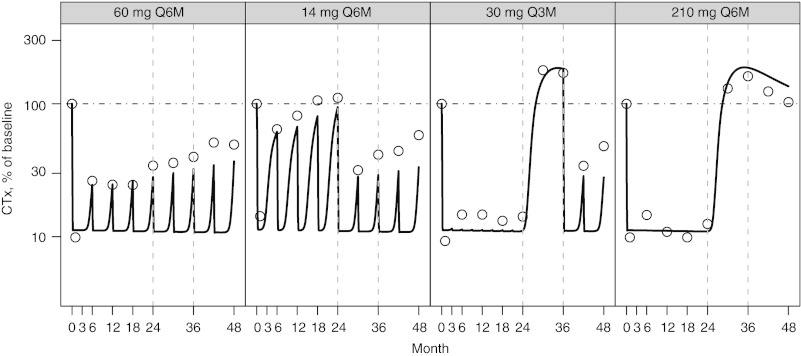
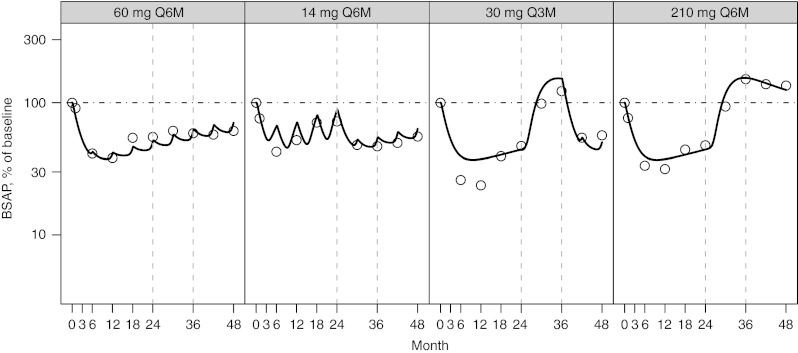
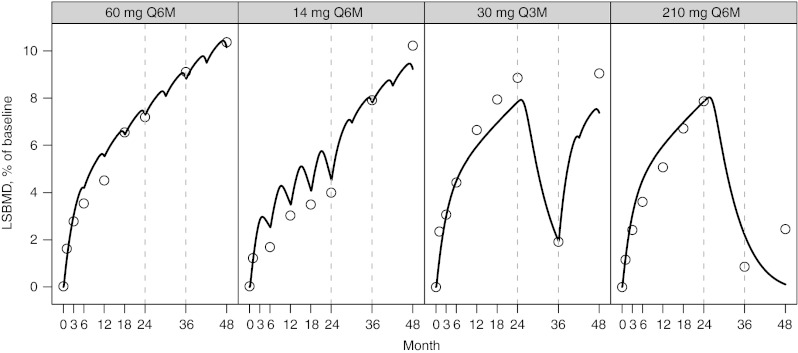
The observed and predicted longitudinal changes in CTx (Figure 3), BSAP, (Figure 4), and LSBMD (Figure 5) are presented as percentage of baseline. The data represent a 4-year period for the following denosumab treatment groups: 60 mg Q6M; 14 mg every Q6M for four doses and changed to 60 mg Q6M at month 24; 30 Q3M for 8 doses and changed to 60 mg Q6M starting on month 36; and 210 mg Q6M for four doses then discontinued. In nearly all cases, CTx and BSAP predicted values are within 20% of the observed central median and within the first-to-third quartile interval of the observed data (Figure 2). A single exception exists for the first two on-treatment measurement times for BSAP after administration of 30 mg Q3M, where the model predicts less suppression than observed. Bias (mean relative percent prediction errors) and precision (absolute mean relative percent prediction errors) measures, were calculated for LSBMD in each treatment group—60 mg Q6M (2.6%, 10.2%), 14 mg Q6M (11.7%, 16.5%), 30 mg Q3M (−12.6%, 13.5%), and 210 mg Q6M (17.7%, 41.6%)—indicating relative goodness-of-fit to the observed data. These measures were calculated for all observations (months 1, 3, 6, 12, 18, 24, 36, and 48). These same bias and precision metrics for LSBMD observations collected prior to any treatment disruptions (months 1, 3, 6, 12, 18, and 24) were 60 mg Q6M (4.3%, 12.8%), 14 mg Q6M (18.5%, 21.0%), 30 mg Q3M (−14.1%, 14.6%), and 210 mg Q6M (13.3%, 13.4%) (Figure 5).
Figure 3.
Percent of baseline (%) for C-telopeptide (CTx) following NF-κB ligand inhibition with denosumab administered at (panels from left to right): 60 mg every 6 months (Q6M); 14 mg every Q6M for four doses and changed to 60 mg Q6M at month 24; 30 mg every 3 months for 8 doses and changed to 60 mg Q6M starting on month 36; 210 mg every 6 months for four doses then discontinued. Open circles present observed CTx and model-predicted values are represented by the solid line. A horizontal reference (dotted line) is included on each figure at the baseline value of 100%. Observed values were reproduced from Miller et al.14
Figure 4.
Percent of baseline (%) for serum bone-specific alkaline phosphatase (BSAP) following NF-κB ligand inhibition with denosumab administered at (panels from left to right): 60 mg every 6 months (Q6M); 14 mg every Q6M for four doses and changed to 60 mg Q6M at month 24; 30 mg every 3 months for 8 doses and changed to 60 mg Q6M starting on month 36; 210 mg every 6 months for four doses then discontinued. Open circles present observed BSAP and model-predicted values are represented by the solid line. A horizontal reference (dotted line) is included on each figure at the baseline value of 100%. Observed values were reproduced from Miller et al.14
Figure 5.
Percent of baseline (%) for lumbar spine bone mineral density (LSBMD) following NF-κB ligand inhibition with denosumab administered at (panels from left to right): 60 mg every 6 months (Q6M); 14 mg every Q6M for four doses and changed to 60 mg Q6M at month 24; 30 mg every 3 months for 8 doses and changed to 60 mg Q6M starting on month 36; 210 mg every 6 months for four doses then discontinued. Open circles present observed LSBMD and model-predicted values are represented by the solid line. A horizontal reference (dotted line) is included on each figure at the baseline value of 100%. Observed values were reproduced from Miller et al.14
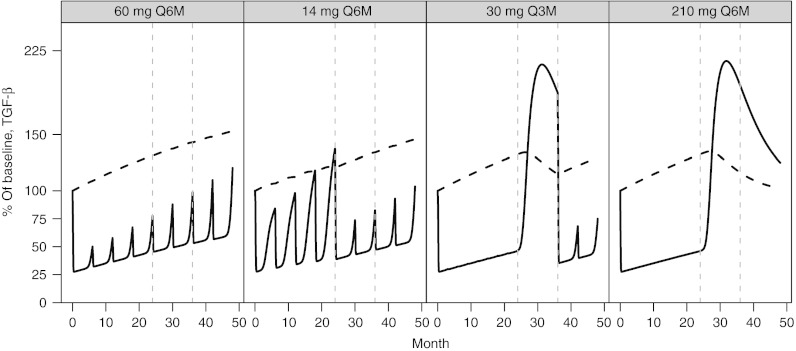
The inclusion and interaction of TGF-β within the model contributes markedly to the model's ability to predict nonlinear, longitudinal changes in LSBMD from BTMs both on- and off-treatment. TGF-β is known to mediate the differentiation and apoptosis rates of bone remodeling OC and OB cells, whereas those same cells regulate its production to serve as a feedback control (Figure 1). The dependence of active TGF-β on the precursor pool of latent TGF-β results in a rebound of both active TGF-β (Figure 6) and BTMs (Figures 3 and 4) leading to the appropriate longitudinal predictions of LSBMD. For example, latent TGF-β is predicted to accumulate during denosumab treatment in a manner similar to LSBMD, declines during periods of treatment cessation, and resumes accumulation upon reinstitution of therapy (Figure 6). In contrast to latent TGF-β, active TGF-β levels fluctuate with the level of osteoclastic activity, as measured by CTx, which by itself is altered by the degree of RANKL inhibition. Although not measured during this study and so only a hypothetical construct, the model predicts that levels of latent TGF-β have increased >50% above baseline after 4 years of treatment (60 mg Q6M) and minimal slope changes are suggested for other doses and dose regimens. For the 30 mg Q3M and 210 mg Q6M dose groups, latent TGF-β is predicted to rise to ~30% above baseline and produces a spike in active TGF-β following treatment cessation of ~120% above baseline and coinciding with the elimination of measurable levels of denosumab (data not shown, simulations based on work from Peterson et al.19)
Figure 6.
Percent of baseline (%) for transforming growth factor-β latent (dashed line) and active (solid line) following NF-κB ligand inhibition with denosumab administered at (panels from left to right): 60 mg every 6 months (Q6M); 14 mg every Q6M for four doses and changed to 60 mg Q6M at month 24; 30 mg every 3 months for 8 doses and changed to 60 mg Q6M starting on month 36; 210 mg every 6 months for four doses then discontinued.
Discussion
In this study, we present a simple extension to a previously published MSPM of calcium and bone homeostasis that enables predictions of nonlinear changes in LSBMD.10 Briefly, the underlying model was previously published and draws on decades of literature to address a number of the critical complex relationships between cells, cytokines, and calcium balance required for human survival. In that prior work, the model is described, with clinical effects due to hyper and hypoparathyroidism, anabolic and catabolic bone therapeutics, and progressive renal failure (more than 22 sets of observations) fit simultaneously. At the time of this submission, the complete model code in R is downloadable at www.opendiseasemodels.org and the code as implemented within Berkeley Madonna is provided in a companion article to this work (see appendix in Riggs et al.20). The resultant model provides the first published mathematical construct able to predict, comprehensively, the longitudinal changes in all included biomarker sets (this and prior publication) over a 4-year period using a single set of parameters and a single model construct. As such, it provides a way to simulate virtual patients and be used to evaluate hypotheses, explore study designs, and quantitate numerous scenarios relevant to biological study and clinical research. With the present extension to LSBMD, the model increases its utility via quantifiable investigation of this clinical end point following denosumab treatment. It also provides a construct that can be further extended using data from additional osteoporosis treatments (e.g., bisphosphonates, selective estrogen receptor modulators, vitamin D).
The overall aims of the current work were twofold: demonstrate the potential ease of mutiscale model extensibility, and take the important first step to increase the utility of the previously published calcium and bone homeostasis model to predict longitudinal LSBMD changes following treatment with denosumab. A simple relationship between biomarkers that were already being predicted within the prior model that represent OB and OC function was used to describe LSBMD changes during, and after changes in, denosumab treatment. Effects on OBs and OCs were governed by the preexisting feedback mechanisms within the model. Once constructed, parameters of the new component were estimated by fitting the model to longitudinal LSBMD data describing on- and off-treatment effects of denosumab over 4 years in a proof-of-concept trial. Of note, the model was always required to fit all other sets of data included in the model during prior development (see Peterson and Riggs).10 This ensured that the ability of the model to predict BMD was not at the expense of ability to predict other important conditions, diseases, or treatments.
Denosumab represents a discrete point of inhibition in the biological link between OCs and OBs, and all changes in levels of markers, electrolytes, cytokines, and BMD can be considered to be downstream events. Therefore, postdosing observations of BTMs and changes in BMD were not overtly confounded. Data obtained from Miller et al., in which seven different subcutaneous dose levels and regimens were studied over a 4-year period, proved to be of great value to this work.14 Of note, four of the seven dose groups converted from the subcutaneous dose administered in the first 24 months to 60 mg Q6M for the second 24-month period, and two dose groups, 30 mg Q3M, and 210 mg Q6M, were discontinued after the dose administered before month 24 and either resumed treatment at month 36 at 60 mg Q6M or remained off-treatment, respectively. These perturbations in treatment regimen, both in terms of dose level and continuity provided robust information about the system that was critical to inform parameter estimation.
By linking the current mathematical expression with the existing multiscale model of calcium and bone homeostasis, a single ordinary differential equation construct using CTx and BSAP was capable of describing observed longitudinal changes in LSBMD during and after discontinuation of denosumab treatment. This marks an advancement in the predictive utility of BTMs over previous correlative attempts (for e.g., see refs. 6,7,8). As mentioned in the introduction, BTM changes have been typically treated as discrete, or stationary, observations. However, it is readily observable from the data presented here, and elsewhere for denosumab, that to appropriately describe these effects, it is necessary to consider the longitudinal nature of changes in the system and the tightly connected interplay in the cytokines, paracrine, and endocrine constituents that maintain regulation over bone while acting to ensure tight regulation of calcium. Therefore, this work supports the use of BTMs as more quantitative predictors of outcome, but only when simultaneously considering the intimate relationships of the broader biologic system.
The ability of the model to predict the observed nonlinear changes in BMD from BTMs, both on- and off-treatment, is in part related to the interaction of the model components and the inclusion of a description of TGF-β as supported within the literature.15,16,17,18 TGF-β is known to accumulate during periods of net bone accretion. In the model, consistent with in vitro experiments, the levels of TGF-β are modulated, and parallel the changes in BMD as the cellular activity of OBs and OCs are influenced by disease, or in this case, denosumab treatment. In this sense, BMD functions as a reservoir for TGF-β, which is involved in regulating the cells (OCs and OBs) responsible for producing and destroying the bone and producing changes in BMD. Thus, an increase or decrease in BMD indirectly causes a commensurate change in TGF-β, a key cytokine in the paracrine/endocrine relationship that maintains calcium and bone homeostasis. This was an interesting finding of this work and supports the contention that bone and calcium homeostasis are inextricably linked, tightly regulated, and require a feedback mechanism to provide long-term predictions of BMD. It also suggests a plausible reason why simple linear or nonlinear regression models attempting to predict BMD from BTMs have not performed well historically.
Although this MSPM can predict the nonlinear changes in LSBMD as denosumab treatments start, stop, change, and or reinstituted, several fitting aspects warrant discussion. Overall, the BTMs are well estimated by the prior model, and two exceptions are noted. In the BSAP 30 mg Q3M dose group, the first two timepoints are over predicted. This appears to be a manifestation of the higher baseline value for that dose group (Figure 2) and the limitation of the modeling approach in which a single baseline level was assumed for all dose groups. The result was a transient over prediction in the suppression of BSAP. For CTx, a consistent underprediction was noted in the 60 mg Q6M and 14 mg Q6M dose groups, especially in the later 24 months. In these cases, the effect of RANKL inhibition on CTx demonstrates a mild degree of blunted response or rebound, which is partially captured by the model, and currently described as mediated through the TGF-β effect described previously (Figure 6). Of note, temporal drift in the analytics for CTx is not likely, as the placebo group does not demonstrate drift in this time frame (Figure 2). Nonetheless, the model adequately predicts LSBMD changes during the first 24 months (mean relative percent prediction errors < 22%) and for most data beyond 24 months. There is an unsatisfactory prediction of the LSBMD at the last time points of the 210 mg Q6M dose group, resulting in decreased precision when calculated using the 48-month time points. It is possible that further development of the model may rectify this errant prediction.
As with all models, the context under which they are developed and can be used must be considered before application, and this model is no exception. Certainly, there are numerous ways by which the model can be expanded to increase its utility and applicability, and is limited only by our scientific understanding of physiology and biology. Many of these are the focus of future work and are mentioned here to define the limits of this model. As such, this construct should not be considered complete, but rather “fit-for-purpose” and suitable for continued refinement, expansion, and addition of influential components of interest (e.g., sclerostin, Wnt pathway, vitamin D kinetics and direct actions, metalloproteinases, etc.). For BMD predictions, scalars that are able to explain differential changes in regional BMD (e.g., hip vs. lumbar spine) will likely be a focus of further work. Each of these continued developments will serve to improve model predictions and broaden the scope of utility.
As the focus of the work was the derivation of a model component to describe effects of denosumab treatment on LSBMD, attention was not paid to disease progression over the period studied. However, the general applicability of the derived relationship to predict BMD has subsequently been externally validated by use of the model to predict BMD changes in progressive renal failure,11 during menopause, and then with added estrogen-replacement therapy,20 and during endometriosis pharmacotherapy.20 In each instance, the model retained the structure presented in this study, and only progressive renal failure and an estrogen components, respectively, were added to the model. Therefore, these subsequent model extensions support the validity and utility of the LSBMD model component presented here as a viable model construct and point to the need for other aspects of physiology to be modified in the model to correctly support disease progression, rather than a simple heuristic linear component without physiologic basis.
A final consideration for further development of this and other multiscale systems pharmacology models is extension into stochastic frameworks. The model presently provides central tendency predictions and is not designed to generate uncertainty estimates. The evolution of multiscale models into this level of complexity is probably not too far off. Nonetheless, although the current model is deterministic, it provides users and investigators a tool to ask and answer questions about many aspects of clinical trial design and provide justification for design elements.
In conclusion, we have presented an extension component for a physiologically based multiscale systems pharmacology model of calcium and bone homeostasis that expands the utility of BTMs, in the context of broader system changes, as predictors of LSBMD during and following anti-RANKL treatment with denosumab.
Methods
As the physiology of the calcium and bone homeostatic system is significantly complex, involving multiple organs and endocrine feedback systems, the preexisting model that this work builds upon cannot be presented in its entirety. Readers are directed to the previously published physiologically based model of calcium and bone homeostasis published in the journal Bone that served as the starting point for model extension and are invited to explore the code by downloading the R version at www.opendiseasemodels.org. Briefly, three independently published models were consolidated and modified to produce a single integrated model. Raposo et al. published a mathematical model of systemic calcium homeostasis.21 Lemaire et al. provided a paracrine-centric model that quantitatively described the cellular linking of the cells that resorb and form bone, the OCs and OBs, often referred to as bone morphogenic units.22 Bellido et al. proposed an intracellular signaling pathway involving runt-related transcription factor 2, B-cell chronic lymphocytic leukemia/lymphoma 2 transcription factor, and cAMP response element-binding transcription factor as a plausible mechanism that describes differential catabolic and anabolic bone responses to continuous and intermittently administered parathyroid hormone, respectively.23 These three models were substantially modified to intricately link the related physiologic phenomena and produce predictions of related biomarkers, cytokines, and effects of disease states.10
Presented here is the added model component that enables predictions of nonlinear changes in LSBMD during, following discontinuation of, and after reinstitution of treatment with denosumab.10 Briefly, the model that was built upon contained 32 differential equations. To extend the model and predict longitudinal changes in BMD, data from a publication describing the on- and off-treatment effects of denosumab over 48 months in postmenopausal women were digitized using the software application Plot Digitizer version 2.4.1.14 BMD, serum CTx, a marker of OC function, and BSAP, a marker of OB function, were extracted and used to fit parameter estimates in the modeling application Berkeley Madonna (version 8.0.1; University of California, Berkeley, CA). All implementations of ordinary differential equations were solved using the fixed step size integration algorithm available in Berkeley Madonna (Fourth-order Runge–Kutta algorithm). Parameter estimation used the simplex search algorithm with least squares minimization employed by the Curve Fit option within Berkeley Madonna. Results were postprocessed for presentation using the open source software package R version 2.7.2 (http://r-project.org)
Model constructs were fit to the 48-month data and evaluated for the ability to describe the CTx and BSAP data through 48 months. The pharmacokinetics of denosumab have been well described previously and were used to simulate serum levels of denosumab following the doses used in the clinical publication.19 Model constructs were evaluated for their ability to predict BMD changes over time following multiple treatment regimens and doses of denosumab.
Quantitatively, model precision and bias for the BMD predictions were calculated using absolute mean relative percent prediction errors (Eq. 1) and mean relative percent prediction errors (Eq. 2), respectively.24 Evaluations of the absolute mean relative percent prediction errors and mean relative percent prediction errors were made for the entire 4-year period fitted and for the period prior to dose schedule modification at year 2.
Absolute mean relative percent prediction errors =
Mean relative percent prediction errors =
 |
Author Contributions
M.C.P. and M.M.R. wrote the manuscript, and designed and performed the research. M.M.R. analyzed the data.
Conflict of Interest
The authors declared no conflicts of interest.
Study Highlights
Acknowledgments
The authors thank Joseph Hebert for his assistance in preparing this manuscript for publication.
Supplementary Material
References
- Organization W.H. Assessment of fracture risk and its application to screening for postmenopausal osteoporosis. Report of a WHO Study Group. World Health Organization technical report series. 1994;843:1–129. [PubMed] [Google Scholar]
- Old J.L., &, Calvert M. Vertebral compression fractures in the elderly. Am. Fam. Physician. 2004;69:111–116. [PubMed] [Google Scholar]
- Bliuc D., Nguyen N.D., Milch V.E., Nguyen T.V., Eisman J.A., &, Center J.R. Mortality risk associated with low-trauma osteoporotic fracture and subsequent fracture in men and women. JAMA. 2009;301:513–521. doi: 10.1001/jama.2009.50. [DOI] [PubMed] [Google Scholar]
- Foundation I.O. The Burden of Brittle Bones Epidemiology, Costs & Burden of Osteoporosis in Australia—2007. International osteoporosis Foundation. 2007.
- Biver E.et al. Bone turnover markers for osteoporotic status assessment? A systematic review of their diagnosis value at baseline in osteoporosis Joint. Bone. Spine 7920–25.2012 [DOI] [PubMed] [Google Scholar]
- Gorai I., Taguchi Y., Chaki O., Nakayama M., &, Minaguchi H. Specific changes of urinary excretion of cross-linked N-telopeptides of type I collagen in pre- and postmenopausal women: correlation with other markers of bone turnover. Calcif. Tissue Int. 1997;60:317–322. doi: 10.1007/s002239900235. [DOI] [PubMed] [Google Scholar]
- Marcus R.et al. The relationship of biochemical markers of bone turnover to bone density changes in postmenopausal women: results from the Postmenopausal Estrogen/Progestin Interventions (PEPI) trial J. Bone Miner. Res 141583–1595.1999 [DOI] [PubMed] [Google Scholar]
- Vestergaard P.et al. Evaluation of methods for prediction of bone mineral density by clinical and biochemical variables in perimenopausal women Maturitas 40211–220.2001 [DOI] [PubMed] [Google Scholar]
- USFDA & CDER Forteo summary basis of approval. Forteo [teriparatide (rDNA origin)] InjectionCompany: Eli Lilly and Company. Application No. 021318. Approval Date: 11/26/2002.
- Peterson M.C., &, Riggs M.M. A physiologically based mathematical model of integrated calcium homeostasis and bone remodeling. Bone. 2010;46:49–63. doi: 10.1016/j.bone.2009.08.053. [DOI] [PubMed] [Google Scholar]
- Riggs M.M., Peterson M.C., &, Gastonguay M.R. Multiscale physiology-based modeling of mineral bone disorder in patients with impaired kidney function. J. Clin. Pharmacol. 2012;52:45S–53S. doi: 10.1177/0091270011412967. [DOI] [PubMed] [Google Scholar]
- McClung M.R.et al. Denosumab in postmenopausal women with low bone mineral density N. Engl. J. Med 354821–831.2006 [DOI] [PubMed] [Google Scholar]
- Lewiecki E.M.et al. Two-year treatment with denosumab (AMG 162) in a randomized phase 2 study of postmenopausal women with low BMD J. Bone Miner. Res 221832–1841.2007 [DOI] [PubMed] [Google Scholar]
- Miller P.D.et al. Effect of denosumab on bone density and turnover in postmenopausal women with low bone mass after long-term continued, discontinued, and restarting of therapy: a randomized blinded phase 2 clinical trial Bone 43222–229.2008 [DOI] [PubMed] [Google Scholar]
- Dallas S.L., Park-Snyder S., Miyazono K., Twardzik D., Mundy G.R., &, Bonewald L.F. Characterization and autoregulation of latent transforming growth factor β (TGF β) complexes in osteoblast-like cell lines. Production of a latent complex lacking the latent TGF β-binding protein. J. Biol. Chem. 1994;269:6815–6821. [PubMed] [Google Scholar]
- Janssens K., ten Dijke P., Janssens S., &, Van Hul W. Transforming growth factor-β1 to the bone. Endocr. Rev. 2005;26:743–774. doi: 10.1210/er.2004-0001. [DOI] [PubMed] [Google Scholar]
- Dallas S.L., Rosser J.L., Mundy G.R., &, Bonewald L.F. Proteolysis of latent transforming growth factor-β (TGF-β)-binding protein-1 by osteoclasts. A cellular mechanism for release of TGF-β from bone matrix. J. Biol. Chem. 2002;277:21352–21360. doi: 10.1074/jbc.M111663200. [DOI] [PubMed] [Google Scholar]
- Taipale J., Miyazono K., Heldin C.H., &, Keski-Oja J. Latent transforming growth factor-β 1 associates to fibroblast extracellular matrix via latent TGF-β binding protein. J. Cell Biol. 1994;124:171–181. doi: 10.1083/jcb.124.1.171. [DOI] [PMC free article] [PubMed] [Google Scholar]
- Peterson M.et al. A population PK/PD model describes the rapid, profound, and sustained suppression of urinary N-telopeptide following administration of AMG 162, a fully human monoclonal antibody against RANKL, to healthy postmenopausal women The AAPS Journal 242004 [Google Scholar]
- Riggs M.M., Bennetts M., van der Graaf P.H., Martin S.W. Integrated pharmacometrics and systems pharmacology model-based analyses to guide GnRH receptor modulator development for management of endometriosis. CPT Pharmacometrics Syst. Pharmacol. 2012;1:e10. doi: 10.1038/psp.2012.10. [DOI] [PMC free article] [PubMed] [Google Scholar]
- Raposo J.F., Sobrinho L.G., &, Ferreira H.G. A minimal mathematical model of calcium homeostasis. J. Clin. Endocrinol. Metab. 2002;87:4330–4340. doi: 10.1210/jc.2002-011870. [DOI] [PubMed] [Google Scholar]
- Lemaire V., Tobin F.L., Greller L.D., Cho C.R., &, Suva L.J. Modeling the interactions between osteoblast and osteoclast activities in bone remodeling. J. Theor. Biol. 2004;229:293–309. doi: 10.1016/j.jtbi.2004.03.023. [DOI] [PubMed] [Google Scholar]
- Bellido T.et al. Proteasomal degradation of Runx2 shortens parathyroid hormone-induced anti-apoptotic signaling in osteoblasts. A putative explanation for why intermittent administration is needed for bone anabolism J. Biol. Chem 27850259–50272.2003 [DOI] [PubMed] [Google Scholar]
- Sheiner L.B., &, Beal S.L. Some suggestions for measuring predictive performance. J. Pharmacokinet. Biopharm. 1981;9:503–512. doi: 10.1007/BF01060893. [DOI] [PubMed] [Google Scholar]
Associated Data
This section collects any data citations, data availability statements, or supplementary materials included in this article.


