

Abstract
We compare and contrast measurements of the mass accommodation coefficient of water on a water surface made using ensemble and single particle techniques under conditions of supersaturation and subsaturation, respectively. In particular, we consider measurements made using an expansion chamber, a continuous flow streamwise thermal gradient cloud condensation nuclei chamber, the Leipzig Aerosol Cloud Interaction Simulator, aerosol optical tweezers, and electrodynamic balances. Although this assessment is not intended to be comprehensive, these five techniques are complementary in their approach and give values that span the range from near 0.1 to 1.0 for the mass accommodation coefficient. We use the same semianalytical treatment to assess the sensitivities of the measurements made by the various techniques to thermophysical quantities (diffusion constants, thermal conductivities, saturation pressure of water, latent heat, and solution density) and experimental parameters (saturation value and temperature). This represents the first effort to assess and compare measurements made by different techniques to attempt to reduce the uncertainty in the value of the mass accommodation coefficient. Broadly, we show that the measurements are consistent within the uncertainties inherent to the thermophysical and experimental parameters and that the value of the mass accommodation coefficient should be considered to be larger than 0.5. Accurate control and measurement of the saturation ratio is shown to be critical for a successful investigation of the surface transport kinetics during condensation/evaporation. This invariably requires accurate knowledge of the partial pressure of water, the system temperature, the droplet curvature and the saturation pressure of water. Further, the importance of including and quantifying the transport of heat in interpreting droplet measurements is highlighted; the particular issues associated with interpreting measurements of condensation/evaporation rates with varying pressure are discussed, measurements that are important for resolving the relative importance of gas diffusional transport and surface kinetics.
I. Introduction
The interplay of kinetic and thermodynamic factors in regulating water partitioning between the condensed and gas phases in atmospheric aerosol is a subject of ongoing investigation.1−4 An assumption is frequently made that the activation of aerosol to form cloud condensation nuclei at supersaturated relative humidities (RHs), and the hygroscopic growth in particle size at subsaturated RHs, are both regulated purely by thermodynamic principles; the partitioning of water (and any other semivolatile components) between the condensed and gas phases is estimated according to aerosol volume rather than surface area.5−7 Recently, the existence of secondary organic aerosol in kinetically arrested glassy states has been identified, with implications for the partitioning of water between the gas and condensed phases.8 Aerosol particles with a highly viscous bulk, characterized as a rubber or glassy state,9,10 and with low molecular diffusivity are likely to exist in a state of disequilibrium from the surrounding gas phase due to the slow rate for the bulk transport of water.11−13
Interpreting the molecular mechanism for the condensation or evaporation of water to/from an aerosol particle requires an understanding of the gas phase transport to the particle surface, the transport across the surface boundary and transport into the particle bulk.3,14,15 Further, it has been recommended that the mass accommodation coefficient (αM) for describing the kinetics for crossing the surface boundary be separated into surface and bulk accommodation contributions to discriminate between the kinetics of the surface accommodation process and the transport between the surface and near-surface bulk.3 Low molecular diffusivity into the particle bulk may hinder condensation or evaporation through a slowing of bulk accommodation.11,15 In describing the kinetics of transport across the surface boundary, we choose here to refer to the mass accommodation coefficient rather than either the surface or bulk accommodation coefficients as we will discuss measurements that have reported this value for the uptake of water vapor at a liquid water surface. For this system, the transport between the surface and the bulk liquid is likely fast enough to justify the use of a single coefficient for the overall absorption process (see, e.g., Shiraiwa et al.15). The mass accommodation coefficient will also be used interchangeably with the evaporation coefficient, depending on the process under study; the values for these two coefficients are assumed to be equivalent by microscopic reversibility.3
As a further consideration, molecular transport between the condensed and gas phases leads to the deposition or loss of heat from a droplet during condensation and evaporation, respectively, and the transport of heat must be understood if the molecular mass flux is to be rationalized.16−21 Typically, for a particle of finite volume, energy is dissipated from the particle into the gas phase during condensation, and the heat flux between the droplet and the gas is dependent on the efficiency with which gas molecules colliding with the surface are able to transfer energy on collision with the condensed phase. This efficiency is quantified by a thermal accommodation coefficient (αT), the probability that an outgoing molecule, having scattered from the surface, is in thermal equilibrium with the surface.3 In this manuscript, we assume the thermal accommodation coefficient for gas phase molecules colliding with an aqueous solution to be unity, in agreement with experimental data found in the water growth literature (see, e.g., refs (18), (20), and (22)). It should be recognized that a value of unity is not observed for a wide range of other systems,23 with, for example, studies of the Brownian motion of liquid oil droplets implying thermal accommodation coefficients on the order of 0.9.24,25 However, for the purposes of this study we will not explore values of αT other than unity.
Measurements of the mass accommodation coefficient of gas phase water at a liquid water surface have a long and contentious history with values spanning a range from 0.001 to 1.3,26−28 Indeed, even over the past decade the mass accommodation coefficient has been measured by a number of different approaches and reported values have spanned a range from 0.05 to 1.0, albeit converging to the upper end of the earlier measurements.3,23,26,29 Molecular dynamics simulations consistently imply that the value is unity.30−33 Further, the influence of surface composition (e.g., the presence of a surface active organic component) on mass accommodation coefficients remains ambiguous.34−39 Confidence in the exact value of αM is crucial, as it is a key determining factor in estimating the activated fraction of aerosol and the cloud droplet number in cloud parcel models, influencing the maximum supersaturation achieved in clouds.40−42 Indeed, the uncertainty in this value could be a significant contributor to the uncertainty in the radiative forcing estimated for the indirect effect of aerosols on climate.26,43 At a limiting value for αM of 1.0, the gas phase diffusion of water vapor to the droplet surface and the removal of heat limit the rate of condensational growth, and cloud droplet growth is insensitive to the surface accommodation kinetics.40 If the value of the mass accommodation coefficient were to be below 0.1, condensational growth would be limited by surface kinetics leading to an increased value for the water vapor saturation in clouds, with the consequence that a larger fraction of the aerosol distribution would be activated.44 In short, a large mass accommodation coefficient leads to a lower cloud droplet number concentration but larger droplets on average; a small mass accommodation coefficient leads to a larger cloud droplet number concentration but smaller droplets on average. Clouds containing a large number of smaller droplets are known to have a higher reflectivity and persist for longer in the atmosphere, increasing their radiative forcing effect.5,40,41,45−47
Measurements of water condensation/evaporation at a range of pressures, water saturations (relative humidities, RH), and temperatures are required to fully resolve the kinetics of the mass accommodation process from the limitations to the rate imposed by gas diffusion and to ensure consistency across a broad range of environmental conditions.3 To interpret these measurements, calculations of the mass and heat transfer between the gas and condensed phases are needed. The mass flux of water to or from a droplet during condensation or evaporation, respectively, is dependent on the concentration gradient of water in the gas phase. To calculate the mass flux, numerous thermophysical parameters must be known. Constraining the value of αM from condensation/evaporation data requires knowledge of the pressure, temperature, and compositional dependence of these key thermophysical parameters and transport coefficients, such as the gas phase diffusion coefficients and thermal conductivities of the components. Here, we assess the influence of the uncertainties associated with both these transport coefficients and the experimental environmental conditions, particularly the saturation/RH, in interpreting measurements of evaporation or condensation of water.
In section II we briefly review a semianalytic framework for calculating the molecular flux during condensation/evaporation and the time dependence in droplet size, an approach that can be used to study the condensation/evaporation of spherical liquid droplets.16,17,43 In section III we assess the uncertainties associated with the key thermophysical properties required to predict evaporative or condensational fluxes, specifically the diffusion coefficients and gas phase thermal conductivities, the saturation vapor pressure of water and the enthalpy of vaporization of water. Finally, in section IV we consider the impact of these uncertainties in interpreting measurements made with a range of experimental techniques that have been used to determine the mass accommodation coefficient of water. The techniques considered here include droplet growth measurements in a cloud expansion chamber,18,20 cloud condensation nuclei activation measurements in a flow tube instrument,48−51 condensation measurements with optical tweezers,17 and evaporation measurements with an electrodynamic balance.52−56 Although there are differences between these approaches, the same semianalytic framework treating spherical liquid droplets can be used to simulate all of them. In addition, we identify the key quantities that determine the uncertainty with which the mass accommodation coefficient can be estimated from each of these approaches.
II. The Semi Analytical Model of Condensation and Evaporation
The condensation (evaporation) rate to (from) a noninteracting liquid droplet suspended in a gaseous medium can be represented by applying the basic theories of mass and heat transport for a spherically symmetric system (see, e.g., refs (1), (16), (19), and (57−60)). The appropriate theory is chosen on the basis of the nondimensional size of the droplet, using the Knusden number Kn which is defined as the ratio of the mean free path of the gaseous medium and the radius of the studied droplet. If Kn ≪ 1 (continuum regime), the mass and heat transfer can be modeled with continuum theories such as diffusion and thermal conduction, whereas at Kn ≫ 1 (kinetic regime), kinetic gas theory can be used to model the collisions between the particle and the surrounding gas phase molecules. At Kn values close to unity (transition regime), the standard approach is to match the continuum and kinetic theories yielding a framework that applies over the whole Kn space and reproduces the continuum and kinetic theories as the Kn values approach 0 and infinity, respectively (see, e.g., refs (1) and (19) and references therein).
Kulmala et al.16 have presented a semianalytic approach for predicting the rate of mass transfer between a liquid droplet and the surrounding gas phase, which can be applied in situations where the temperature gradients in the system are sufficiently small for the droplet temperature to remain approximately constant over each time step. The mass flux (I, kg s–1) of the condensing vapor (in our case water) on a droplet of radius r (m) can be written as
| 1 |
where Mv is the molecular mass (kg), Dim is the binary diffusion coefficient of the vapor in the surrounding gas mixture (m2 s–1), L is the enthalpy of vaporization of the vapor (J kg–1), K is the thermal conductivity of the gas mixture (W m–1 K–1), pe(T∞) is the equilibrium pressure of the vapor (Pa) at the temperature of the gas phase far removed from the droplet, T∞, and R is the ideal gas constant (J K–1 mol–1). The degree of saturation of the vapor at infinite distance is given by S∞, and Sr is the corresponding value at the droplet surface. The initial saturation values at t = 0 s when the droplet is in thermal equilibrium with the gas can be written as
| 2 |
| 3 |
where pr(T∞) is the vapor pressure at the droplet surface including the Kelvin correction and p∞(T∞) is the partial pressure of the vapor at infinite distance. These are referenced to the equilibrium pressure of the vapor at the temperature of the gas phase above its pure liquid phase. Implicit to eq 1 is an accounting for the influence of the change in droplet surface temperature on the mass flux to or from the droplet.16 More specifically, including the second term in the denominator of eq 1 accounts for the suppression of the growth rate due to elevation of the surface temperature by the latent heat produced during condensation, or conversely, the reduction in the evaporation rate due to depression of the surface temperature during evaporation.
Equation 1 holds for quasistationary droplet growth/evaporation by ordinary diffusion, where the droplet surface is in thermodynamic equilibrium with the gas layer just adjacent to it. The term A in eq 1 accounts for the influence of convective Stefan flow on the flux:
| 4 |
where ptot is the total gas pressure (Pa). If the role of Stefan flow is neglected (A ∼ 1) and the second term in the denominator of eq 1 is ignored, the equation reduces to the conventional expression for isothermal mass transfer including the gas-diffusional correction (see, e.g., ref (60)).
The transitional correction factors for mass and heat transfer accounting for the different Kn regimes are given in eq 1 by βM and βT, respectively. Kulmala et al. use the Fuchs–Sutugin transitional correction factors,16 which can be expressed in the form
| 5 |
where Kni and αi refer to the Knudsen number for either mass (i = M) or heat (i = T) transfer, and the mass or thermal accommodation coefficients, respectively. KnM is defined as the ratio of the mean free path of water molecules to the particle radius. We take the definition of KnT reported by Wagner61 as the ratio of the mean free path of the components responsible for heat transfer (bath gas and water) to the particle radius. The effective mean free paths for the mass transfer (λM) and heat transfer (λT) are calculated from the appropriate transport coefficients as
| 6 |
| 7 |
Cv is the specific heat capacity of the gas at constant volume (J K–1 kg–1), ρ is the mass concentration of the gas (kg m–3), and c̅ is the average mean speed of the gas molecules (m s–1).
Two approximations are made in the derivation of eq 1 and the significance of the regimes under which these approximations fail must be noted. The first approximation determines the scaling of the vapor pressure at the droplet surface by the temperature change incurred due to the latent heat generated/removed during condensation/evaporation, eqs 19 and 22 of ref (16). In short, the approximation made is
| 8 |
where Ta is the temperature of the droplet surface. If the vapor is water, the difference between the exact and approximate values for this exponential is larger than 5% when the temperature difference exceeds ∼6 K at 300 K. We consider that eq 1 must be used with care if the difference between the temperatures of the droplet and gas exceeds this value. For the simulations presented later in this manuscript, the largest difference in temperature between the gas and particle is 5 K. The validity of using this treatment for examining sensitivities to the thermophysical parameters can therefore be assumed.
The second approximation provides a simplification of the continuum regime mass flux expression, eqs 18 and 24 in ref (16), leading to a mass flux that is linearly dependent on the vapor pressure. In short, the approximation made is
 |
9 |
with a similar expression for the partial pressure of the vapor at infinite distance, p∞. Given that the mass flux is directly proportional to the logarithmic quantity, when the partial pressure of the vapor is equal to the partial pressure of the buffer gas (i.e., air or nitrogen), the mass flux will be underestimated by 10%. At a temperature of 293 K and 100% RH, these conditions exist at a total gas pressure of 4.6 kPa when the gas phase is composed of 2.3 kPa of water and 2.3 kPa of air or nitrogen. When the total gas pressure is 10 kPa, the error in the approximation falls to less than 2%. Thus, caution must be exercised when this semianalytical framework is used for modeling evaporation/condensation at low pressure when the partial pressure of the vapor constitutes more than 50% of the total pressure.
Equation 1 can be used to model the time evolution of a condensation or evaporation event by iterative propagation of time. The conditions required for initializing the calculation depend on the experimental context. For instance, in the expansion chamber work,18,20 knowledge of the initial temperature and supersaturation, total gas pressure, and particle size is required. For optical tweezers measurements,17 the initial droplet radius, the initial saturation ratio of water at the droplet surface and the final saturation ratio once the droplet has equilibrated with the gas phase, the temperature and the total gas pressure must be known. The key thermophysical parameters on which the semianalytic model relies are the vapor diffusion coefficient of water in the gas mixture, the enthalpy of vaporization of water from the solution and the thermal conductivity of the gas mixture. After each time step, the mass lost/gained from the droplet must be used to estimate the droplet radius for the beginning of the next time step from knowledge of the density of the droplet.
III. Assessment of the Uncertainties Associated with Key Thermophysical Quantities
A survey of mass accommodation studies published in the literature to date highlights the fact that there has been inconsistency in the parametrizations used for the thermophysical properties required for the analysis of kinetic measurements.18,62,63 In the following section we report the results of a literature survey of the diffusion coefficient, D, and thermal conductivity, K, for gas mixtures of air/water and nitrogen/water, with the aim of determining not only the most appropriate parametrizations to use but also their associated levels of uncertainty. Any uncertainties in the values of D and K will propagate through the analysis to give limitations on the precision with which αM and αT can be determined. We also briefly review the accuracies of values of the saturation vapor pressure of water, density of solution, and the enthalpy of vaporization from water and aqueous solutions.
III.a. Gas Phase Diffusion Coefficients
For mass transfer of water to occur between a particle and a surrounding gas phase, water vapor molecules must diffuse to or from the droplet surface. The rate of diffusion is related to the magnitude of the gradient driving it, the concentration gradient, via a constant of proportionality known as the diffusion coefficient (see eq 1). The diffusion coefficient for water vapor in gaseous nitrogen or air is pressure dependent, increasing with a decrease in pressure and leading to an increased rate of diffusion to or from the particle surface.
The diffusion coefficient of the vapor is dependent on the composition of the gas mixture with, for example, different values for diffusion in air and nitrogen. Blanc’s Law64 relates the diffusion coefficient of a vapor i in a gas mixture, Dim, to its diffusion coefficient in each of the pure components making up the mixture, Dij, using the mole fraction, xj, of each component as a weighting.
| 10 |
Blanc’s law is applicable in cases where the species i exists as a trace component in the mixture. Some evaporation/condensation measurements have been carried out in air, some in nitrogen, and some in another gas such as helium, with measurements carried out in both humidified and unhumidified gas flows.17,18,52,54,62,63 We consider only the cases of air and nitrogen as a bath gas in the section below. The full details of the literature review are presented in the Supporting Information and only the conclusions will be presented here.
III.a.i. Diffusion Coefficient of Water in Air and Water in Nitrogen
Eleven different parametrizations for calculating the diffusion coefficient of water in air, D(H2O–air), as a function of temperature and pressure were found in the literature.18,65−74 Detailed information on the origin and any stated uncertainty in each study is provided in the Supporting Information. Both experimentally determined and theoretically predicted parametrizations were considered, as well as those that combined an element of both. For a temperature of 298.15 K, values of D(H2O–air) at 1 atm total pressure predicted by the different literature parametrizations were found to span the range 2.60 × 10⁻⁵ to 2.14 × 10⁻⁵ m2 s–1, a decrease of 17.6%. The lowest value was given by Chapman–Enskog theory using interaction parameters as given in Poling et al.64 It is worth noting that numerous values for the interaction parameters σ and Ω for air and water can be found in the literature,64,65,75,76 leading to differences in the diffusion coefficients calculated depending on which of the published values are used.
Following a critical examination of the different parametrizations, that of Massman was deemed to be the most reliable as it arises from a locally weighted polynomial regression (LOESS) fit to 58 experimental D(H2O–air) values from a total of 27 different experiments.72 This was the largest body of solely water-in-air diffusion values considered in any of the parametrizations. All data were corrected to 1 atm pressure assuming an inverse pressure dependence and spanned the temperature range 273.15 to 373.15 K. The use of a LOESS fit allowed the identification and removal of anomalous data points from the fit. No attempt was made by the author to correct the body of literature data for compositional effects, the assumption being that each experiment was likely to possess more than one source of variability.
The Massman parametrization72 for calculating the diffusion coefficient of water in air (cm2 s–1) at the desired temperature (T/K) and pressure (p/atm) is given by
| 11 |
where p0 = 1 atm and T0 = 273.15 K. The value of D0, equivalent to the diffusion coefficient at 273.15 K and 1 atm pressure, was found by the LOESS fit to be 0.2178 cm2 s–1. The value of α was constrained as 1.81 on the basis of previous work.65 The absolute uncertainty in the Massman fit for the diffusion coefficient of water in air is reported as ±7%, representing the maximum percentage difference between the experimental data and the results of the LOESS fit.
In the same paper, Massman reports a parametrization for calculating the diffusion coefficient of water in nitrogen, which takes the same form as eq 11.72 The value of D0 is marginally different from that for water in air, with a value of 0.2190 cm2 s–1. The absolute uncertainty associated with this parametrization is stated as ±6%.
III.a.ii. Diffusion Coefficient of Water in Humid Air and Nitrogen
For measurements performed at a range of total gas pressures but constant relative humidity, the relative proportions of water vapor and the gas components vary. In the extreme limit, when the total pressure equals the partial pressure of water, twelve different parametrizations have been reported for the self-diffusion coefficient for water-in-water vapor D(H2O–H2O).62,69,73,76−82 For a temperature of 298.15 K, values of D(H2O–H2O) at 1 atm total pressure were found to span the range 2.59 × 10⁻⁵ to 3.29 × 10⁻⁶ m2 s–1, a decrease of 87%. Nine of the studies gave diffusion coefficients at 298.15 K grouped within the range 1.90 × 10⁻⁵ to 1.46 × 10⁻⁵ m2 s–1, and these are considered to be the most accurate. These values can be compared with, for example, the reported values of D(H2O–air) at 1 atm total pressure which span the range 2.60 × 10⁻⁵ to 2.14 × 10⁻⁵ m2 s–1. Thus, the diffusion coefficient for water in humid air/nitrogen can be expected to vary between the values in the dilute limit in dry air/nitrogen and the value for self-diffusion as the relative proportions of the gas phase constituents varies.64,75
Recognizing that Blanc’s law is not strictly applicable to the case of calculating the diffusion coefficient for a mixture in which the “trace” vapor component is dominant and self-diffusion must be included, we choose to neglect explicitly this dependence on composition in our model calculations. It has been reported previously that such an assumption incurs at most an error of ±5% in the diffusion coefficient.83 Instead, we have limited the pressure range over which experimental measurements are simulated and recommend that when interpreting the sensitivity analyses in section IV for measurements at the lowest pressure (10 kPa total pressure, consisting of 3.1 kPa of water vapor at 100% RH and 298 K), the reader should consider that there exists a greater uncertainty in the binary diffusion coefficient at low pressure than at higher pressure. We have chosen not to be more explicit in treating the diffusion constant of the mixture here as the validity of the semianalytical treatment itself is questionable when the partial pressure of the vapor dominates the partial pressure of the gas.18 Under such cirucmstances, a pressure gradient is established that can also be considered to drive mass flux. We shall return to a discussion of the conceptual problems in interpreting measurements at low pressure in our conclusions but limit the sensitivity analysis in section IV to a consideration of experimental regimes in which both the accuracy of the binary diffusion constant and the validity of eq 1 can be assumed.
III.b. Gas Phase Thermal Conductivity
The conduction of heat to or from the droplet within the gas phase is critical in determining the time dependence of the surface temperature of the droplet and the steady state wet-bulb temperature, and thus plays an important role in governing the mass flux. It is therefore necessary to know the thermal conductivities for water vapor, air, nitrogen, and any other gases used in condensation/evaporation measurements. In addition, it is important to determine how to combine them to calculate the thermal conductivity of a mixture with specified composition.
III.b.i. Thermal Conductivity of Air and Nitrogen
Six different parametrizations were found in the literature for the thermal conductivity of air as a function of temperature and pressure.18,84−88 The origin of each of the parametrizations is given in the Supporting Information and only a brief overview is included here. The different parametrizations were found to match each other closely, with a decrease in the thermal conductivity of air of only 2.4% between the highest and lowest values calculated at a temperature of 298.15 K and a pressure of 1 atm.
Following an examination of the different parametrizations, the most reliable was judged to be a study originating from the University of Idaho and the National Institute of Standards and Technology (NIST) by Lemmon and Jacobsen,85 currently used as the reference for the CRC Handbook. In this work, the authors performed a critical review of the literature and created a database of robust experimental values published over the temperature range 60–2500 K and pressure range 0.001–101 MPa. These values were then fitted with a complex theoretical framework consisting of dilute gas, residual fluid, and critical enhancement terms to allow the thermal conductivity of air to be calculated accurately over a wide range of pressures and temperatures. For the purposes of the present study we need consider only the dilute gas term from the parametrization. This is based on Chapman–Enskog theory with a collision integral fitted to experimental data and is suitable for measurements at atmospheric pressure and below. As the calculations even for this term are quite involved, we provide eq 12, a quadratic fit to thermal conductivity values calculated using the dilute gas term over the temperature range 270–300 K.
| 12 |
The uncertainty in the thermal conductivity of air calculated using this equation is ±2% over the considered temperature range.
Similarly, the most reliable treatment for the thermal conductivity of nitrogen is also taken from the work of Lemmon and Jacobsen.85 As before, only the dilute term from the parametrization needs to be considered. A quadratic fit to the data calculated using this term over the temperature range 270 to 300 K takes the form
| 13 |
The uncertainty in the values calculated using this equation is ±2%.
III.b.ii. Thermal Conductivity of Water
Six different parametrizations were found in the literature for the thermal conductivity of water vapor as a function of temperature and pressure.18,73,86−89 The origin of each of the parametrizations is given in detail in the Supporting Information and only a brief overview is included here. The different parametrizations were found to span the range 0.0191 to 0.0156 W m–1 K–1 at 298.15 K, a decrease of 18.3%. Five of the parametrizations were found to give thermal conductivities closely grouped together, with the sixth predicting considerably lower values than the others.
The parametrization considered to be the most reliable following the literature survey is that of Sengers and Watson,89 which originates from the NIST and is based on a fit to experimental data. It is also endorsed by the International Association for the Properties of Water and Steam. Using the dilute term of the parametrization only (suitable for atmospheric pressure and below), a quadratic fit to values calculated over the temperature range 270 to 300 K gives
| 14 |
The uncertainty in the values calculated using this equation is ±2% over the considered temperature range.
III.b.iii. Thermal Conductivity of a Mixture
Seven different parametrizations for determining the thermal conductivity of a mixture were found in the literature, with two of these explicitly used for calculating the thermal conductivity of humid air.18,64,88,90−92 Six of the parametrizations were based on the Wassiljewa equation.93 This is an empirical relationship based on kinetic theory and is shown in eq 15 for a binary mixture, requiring knowledge of the thermal conductivities of the pure components, Ki, their mole fractions, xi, and the values of the parameters A12 and A21, where 1 and 2 are the species of interest.
| 15 |
The difference in the mixture thermal conductivities predicted by each of the parametrizations arises from the different methods used to calculate the parameters A12 and A21. These are variously related to pure component viscosities, critical constants, molecular masses, normal boiling points, and the reduced temperature. Further details of each parametrization are provided in the Supporting Information.
The values of Kmix predicted using each of the parametrizations were compared with experimental data from Touloukian et al.,87 consisting of tabulated values for the thermal conductivity of a mixture of steam and air at 353.2 K with varying mole fractions of air. Where viscosities were required to determine A12 and A21, the viscosity of water was taken from work by Huber et al.94 (associated uncertainty ±2%) and the viscosities of air and nitrogen from Lemmon and Jacobsen85 (associated uncertainties ±1% and ±0.5%, respectively). These studies were deemed the most appropriate following a survey of the literature, details of which are provided in the Supporting Information. It was found that for the seven different parametrizations for Kmix tested, none reproduced the magnitude of the experimental data well and only three were able to reproduce the curvature seen in the thermal conductivity with increasing mole fraction of air (Figure S7 in the Supporting Information). Of these, the parametrization of Lindsay and Bromley90 was chosen for use in this study, as it was reported in the original paper to reproduce 85 mixture thermal conductivities for 16 gas pairs from the literature with an average deviation of 1.9% (1% for water in air).
III.c. Saturation Vapor Pressure of Water, Enthalpy of Vaporization of Water, and Density of Solution
Saul and Wagner95 and Wagner and Pruss96 have provided a parametrization for the temperature dependence of the saturation vapor pressure of water with an associated uncertainty reported to be ±0.025%,97−99 consistent with the values reported by Haar et al.100,101 Uncertainties in the saturation vapor pressure lead to uncertainties in the mass flux calculated from eq 1 during condensation or evaporation. The uncertainties in the experimental saturation value are generally considerably larger than this small uncertainty in the saturation vapor pressure and so the uncertainty in this latter quantity can be largely neglected. However, the parametrization for the saturation vapor pressure used by Winkler et al.18 provided by Wukalowitsch102 systematically underestimates the vapor pressure by ∼0.2% (>5 Pa) in the temperature range of interest. The consequences of this will be discussed in section IV.
For the sensitivity analyses presented in section IV, measurements on a range of mixed component aerosols are reviewed, including aqueous ammonium sulfate and sodium chloride aerosol, and pure water aerosol growing in supersaturated conditions. The enthalpy for vaporization of water from pure liquid water is reported as 43.98 kJ mol–1 at 298 K.101 Values for the latent heat for ten aqueous solutions of sodium and ammonium salts at the saturation concentration have been reported by Apelblat et al.,103,104 including for an aqueous solution of sodium chloride. These values span the range from 43.37 to 45.00 kJ mol–1 with the value for sodium chloride being 44.24 kJ mol–1. Given that most of the measurements assessed in section IV are made on aerosol in the dilute limit, the enthalpy for vaporization of pure water is assumed, consistent with the value used in most of the literature (e.g., see refs (18) and (48)). However, given that some of the aerosol evaporation/condensation measurements will pass through states with significant salt concentrations and may also be somewhat susceptible to the slight dependence of the enthalpy of vaporization on temperature, it is not unreasonable to consider the sensitivity of the different techniques to an uncertainty in the enthalpy of vaporization of ±0.75 kJ mol–1 or ±1.7%. This magnitude of error could be incurred by simply ignoring the compositional and temperature dependence of the enthalpy of vaporization.
The density of solution is required to convert the change in particle mass calculated from the flux eq 1 to a change in droplet radius. For many of the sensitivity studies that will be performed, the droplet solution may actually be pure water. The temperature dependence of the density of pure water is known accurately96 and a parametrization that is valid over the temperature range 0–150 °C has been provided by Popiel and Wojtkowiak.98 The estimated uncertainty in density calculated from this parametrization is between ±0.002% and ±0.004%. Use of a parametrization provided by Winkler et al. incurs a systematic underestimate of density by 0.03% at 290 K rising to an overestimate by 0.08% at 305 K.18 These differences are negligible for the experiments described by Winkler et al.18 However, we must also consider the density of salt solutions for some of the experiments discussed here. For example, at 293 K the density of aqueous sodium chloride at a concentration of 0.5 M (a water activity of 0.984) is 1002.5 kg m–3 compared with the value for water of 998.2 kg m–3, a 0.3% difference.101,105−107 This rises to 2% at a water activity of 0.9, with a density of 1018 kg m–3 and a concentration of 2.44 M. A 2% error in density can lead to an error in diameter of 0.7%, which is usually considerably lower than the other uncertainties in any condensation/evaporation measurement. To achieve a similar level of error through an incorrect assignment of droplet temperature, the temperature would need to be incorrect by tens of kelvin.
IV. Sensitivities of Measurements of Evaporation and Condensation to Uncertainties in the Thermophysical Quantities and Environmental Conditions
The kinetics of water condensation and evaporation in aerosol have been studied using a wide range of experimental techniques. Measurements have been made on single particles in an electrodynamic balance52−56 and in optical tweezers;17 on droplet trains with particles of close to monodisperse size22 and on liquid jets;108−112 and on ensembles of growing particles in an expansion chamber,18,20,61 a Continuous Flow Streamwise Thermal Gradient CCN Chamber (CFSTGC), and the Leipzig Aerosol Cloud Interaction Simulator48,49,51 under conditions of supersaturated growth. We do not intend to be comprehensive in examining all of these approaches in the analysis presented here. However, we will examine the sensitivities to uncertainties in the key thermophysical parameters and environmental conditions for measurements made in an expansion chamber, a CFSTGC, optical tweezers, and an EDB. We will also identify the predominant uncertainties that are likely to limit the accuracy of each technique for retrieving a value of the mass accommodation/evaporation coefficient. In each case, we consider the dynamics as occurring on single isolated particles, providing a baseline analysis of sensitivities that ignores the complexity that may arise from interparticle couplings. It is clear that including the possibility of interparticle couplings can only lead to an increase in the uncertainties in reported values.18,113 The values for, and the uncertainties associated with, the diffusion coefficients, thermal conductivities, saturation pressure, and enthalpy of vaporization were taken as recommended in section III. Experimental uncertainties were taken from appropriate publications that report measurements using each technique.
IV.a. Expansion Chamber Measurements of Condensational Growth
Condensational growth rates on 9 nm diameter silver seed particles have been studied in an expansion chamber during adiabatic expansion over a temperature range from 250 to 290 K and with water vapor supersaturations ranging from 1.3 to 1.5.18,20 One additional measurement was made on 80 nm diameter diethylhexyl sebacate particles at a supersaturation of 1.02. The pressure of the surrounding nitrogen atmosphere was in the range 10–100 kPa. The growth in droplet size was monitored by the constant angle Mie scattering technique with a laser of wavelength 632.8 nm and at a scattering angle of 15°.114 Extrema (maxima and minima) in the light scattering amplitudes were taken from the measurements and compared with theoretical calculations, identifying the time at which the droplets achieved a particular size. Although not providing a continuous record of particle size, such an approach does allow the time at which the droplets reach a certain size to be identified with considerable accuracy. The uncertainty in droplet size arising from an uncertainty in refractive index (due to a change in droplet temperature) is <0.1% (<2 nm for the upper size limit in particle radius of 2 μm reported). Uncertainties in the growth times were estimated to be ±1 ms but were commonly reported as ±2 ms in the published data sets, derived from the extent of the time frame early on in the expansion during which nucleation was assumed to be constrained. Uncertainties in the temperature and pressure of the chamber were reported as ±0.05 K and ±0.2 kPa, respectively, and uncertainties in the saturation as ±1% and ±3% (±0.01 and ±0.03 as a fraction of saturation of 1) at pressures of 100 and 20 kPa, respectively. At the lowest pressures, droplet growth was found to be controlled by heat flux from the particle; with increasing pressure, the gas phase diffusivity decreases and both the heat and mass flux were recognized as important in controlling the growth rate. Equal sensitivity to the mass and thermal accommodation coefficients was established at a pressure of around 90 kPa. Thus, low pressure measurements of the thermal accommodation coefficient were used to constrain the model and retrieve the mass accommodation coefficient from higher pressure measurements.
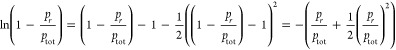
Simulations of the time-dependent droplet growth following activation of 9 nm diameter seed particles have been performed using values for the thermophysical parameters and environmental conditions selected to both maximize and minimize the apparent growth rate, based on the uncertainties in these quantities discussed above (diffusion constant, thermal conductivity, enthalpy of vaporization, and saturation value). For a chosen value of αM between 1.0 and 0.1, the upper and lower limits of the size from the upper and lower limits of the growth rate can be used to define an envelope for the time-dependent droplet growth, as shown in Figure 1. The time frame for the simulations is typical of that studied in the measurements (experimental data reported between 10 and 80 ms) and incorporates the uncertainty in t = 0 s. Uncertainties in the transport coefficients and the saturation value dominate the breadth of the envelope. As expected, use of an inaccurate treatment of the saturation vapor pressure for water discussed in section III.c is insignificant. Further, the accuracies associated with the pressure, temperature, temperature dependence of the density of water and the enthalpy of vaporization are sufficiently high that these do not contribute to the breadth of the envelope. Although it is clear that the time-dependent trends for αM values below 0.5 are clearly resolved, above this value the envelopes in uncertainty overlap and it is not possible to discriminate unambiguously between values of αM. This is true for both the higher pressure and lower pressure measurements simulated here.
Figure 1.
Sensitivity of the time dependence of droplet growth in an expansion chamber type measurement to the mass accommodation coefficient (gray, αM = 1; red, αM = 0.5; blue, αM = 0.2; green, αM = 0.1). The upper and lower limits of each envelope come from the uncertainties in the thermophysical parameters and the saturation, as described in the text. Two pressures are considered: (a) 98.4 kPa and (b) 18 kPa.
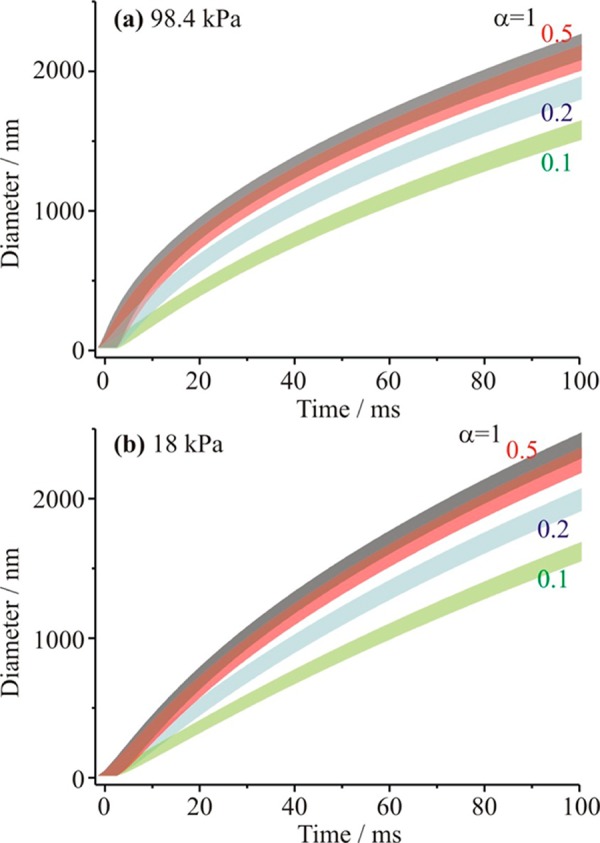
The sensitivity of the retrieved value of αM to the uncertainties in the transport coefficients (0 to +10% error) and saturation value (0 to +4%) are presented in Figure 2; these ranges in uncertainty are chosen to cover the expected ranges discussed earlier. The solid color bars indicate the range in uncertainty that must be considered for the various parameters. Only errors that lead to a systematic overestimation of αM are considered; the sensitivity to negative errors in these values are not considered as these would only lead to the retrievals of values of αM that are significantly larger than 1. Measurements made by the expansion chamber approach are insensitive to the other thermophysical parameters described in the previous paragraph and these are not shown. We have found that the value of αM estimated from the data is also insensitive to the initial size of the particle within the spread of sizes reported as the size distribution for the seed particles. In Figure 2, the change in αM that is required to counter a particular value of the uncertainty in the thermophysical property or environmental condition is reported, such that the change in the droplet size over the experimental time window of 10–80 ms remains less than ±20 nm. Typical growth rates are ∼20 nm ms–1 in this time window.18,20 Thus, setting a tolerance of ±20 nm corresponds to an uncertainty in time of ∼1 ms or of 1–2% in size over the time frame during which radii are experimentally determined.15 In the absence of a quantitative value for this accuracy in the literature, we have deliberately chosen to assess the measurements based on a conservative estimate of the uncertainty in the size; the uncertainty may be larger than this but is unlikely to be smaller given the breadth in size for the extrema in the light scattering intensity.18,114 If the uncertainty in the size at any time is greater than this, the spread of values of αM with which the data are consistent would be larger than shown in Figure 2.
Figure 2.
Sensitivity of the value of the mass accommodation coefficient retrieved from the time-dependent data from expansion chamber measurements at 98.4 kPa to uncertainties in diffusion coefficient (black), thermal conductivity (red), and saturation (blue). The upper and the lower limits for each reflect mass accommodation coefficients that give rise to time-dependent growths in size that are consistent with the experimental measurements within the upper and lower limits on the size and time accuracy described in the text. The accepted range of the uncertainties for the diffusion coefficient, thermal conductivity and saturation is shown at the bottom by the solid bars (same colors as above).
Figure 2 should be interpreted in the following way. For zero error in a thermophysical parameter or the saturation value, the experimentally measured time-dependent growth is consistent with αM values in the range 0.62–1.3 when the set tolerances are satisfied in theoretically reproducing the measured time dependence in size. For a +5% error in either the diffusion coefficient for water-in-nitrogen or the thermal conductivity of nitrogen, αM values in the range 0.54–1.2 would provide a satisfactory fit to the experimental data within the criteria defined above. The similarity in the sensitivities to these two constants comes from the comparability in the heat and mass flux in limiting the condensational growth at pressures of around 100 kPa. For an error of +1% in saturation, αM values in the range 0.53–0.95 would provide a satisfactory fit to the data. Put simply, these sensitivities again suggest that although it is possible to discriminate between values of 0.2 and 0.5 for the αM from these measurements consistent with Figure 1, discriminating between 0.5 and 1.0 is not possible given the uncertainties in the key thermophysical and environmental parameters.
In the treatment of the experimental data provided by Winkler et al.,18 the parametrization used for the thermal conductivity of water vapor is not in agreement with the formalism determined in this work as being the most reliable as a result of the literature survey. At 298.15 K, the thermal conductivity calculated using the Winkler parametrization is 15.5% lower than the value given using the best fit parametrization (refer to Supporting Information Figure S6). However, given the insensitivity of the expansion chamber measurements to this value, no error in analysis has been incurred. As noted in section III.c, the parametrization used for estimating the saturation vapor pressure of water also led to systematically low values by 0.25% when compared with the best available treatment. This level of uncertainty leads to an accumulated error in size due to the change in mass flux of only 0.1% after 100 ms, an error of <2 nm, or equivalent to the error arising from uncertainties in refractive index. This is clearly much less than the influence of uncertainties in the quantities assessed in Figure 2.
Beyond the uncertainties in the transport coefficients, it is clear that the largest sensitivity in the retrieved value of the αM arises in the value of the saturation, a value that is extremely hard to measure. Although quoted uncertainties for this value range from ±1% to ±3%, a more accurate assessment of this uncertainty would be desirable. During the condensational growth, the temperature at the surface of droplets in the expansion has been shown to vary by less than 0.2 K in the first 200 ms, even if the number concentration of growing droplets is large.18 The temperature of the gas phase has been reported to vary by as much as 0.5 K, depending on droplet concentration. The effect of these two uncertainties on the retrieved value of αM, arising as it does from interparticle couplings, has not been considered here although it should perhaps be better quantified. In these simulations, we have convolved the uncertainty in the exact time at which condensational growth starts (t = 0 s) with the other uncertainties. Again, if the uncertainty in this time could be reduced, the sensitivity to αM would be improved. The droplet radii recorded at times longer than 20 ms are only sensitive to αM through the very rapid growth that occurs at early time (<10 ms) and direct measurements of the sizes are typically not available at such an early time. From this analysis, we expect that exact values of αM cannot be resolved if the value is >0.5, on the basis of the uncertainties in the thermophysical properties, time, and supersaturation. Thus, it can be concluded that these measurements are consistent with a value of αM that is larger than 0.5. This result is in line with the conclusions of Winkler et al.,18 who suggested the value of the mass accommodation coefficient must be greater than 0.4.
IV.b. Activation Kinetics from Measurements of CCN Activity
The activation kinetics of inorganic salt particles have been studied with instruments such as the Continuous Flow Streamwise Thermal Gradient CCN Chamber (CFSTGC)49,51,115−117 and the Leipzig Aerosol Cloud Interaction Simulator (LACIS).48 Typical inorganic salts studied include ammonium sulfate and sodium chloride, and quasi-monodisperse dry particle sizes of 50–100 nm are typically selected by a DMA. The principle of operation originates from the more rapid diffusion of water vapor mass than heat. Aerosol is passed through a flow tube with wetted walls and a temperature gradient is imposed along the length of the tube. A radial supersaturation profile is established, which is a maximum at the center-line of the flow and which varies along the length of the tube. Typical supersaturations span the range from 0 to 2.5% and 0 to 1.4% in the LACIS and CFSTGC instruments, respectively. The supersaturation achieves a maximum part way along the flow tube and then declines, consistent with the particles reaching a maximum size and then evaporating before their size is determined at the end of the tube. Droplets typically grow as large as 10 μm in diameter, and their size is determined by light scattering using, for example, an optical particle counter. Growth times can be as long as 1.5 and 12 s in the LACIS and CFSTGC instruments, respectively. Measurements are performed at atmospheric pressure. For CFSTGC measurements, uncertainties in diameter can be typically ±10% for particles ∼1 μm in size, improving to ±5% for particles ∼10 μm in size. Uncertainties in supersaturation are typically ±0.025% for supersaturations in the range 0.2–1%. For LACIS measurements, uncertainties in diameter are reported to be similar to CGSTGC measurements and uncertainties in supersaturation are less clearly defined.
Calculations of the diameter of a droplet at a growth time of 10 s have been performed under conditions of constant supersaturation, with values for the thermophysical parameters and exact supersaturation selected to maximize or minimize the size achieved. The different instruments show characteristic variations in supersaturation and temperature along the flow length48,49,51 that we have not sought to reproduce here; the sensitivities to the uncertainties in the thermophysical parameters and environmental conditions will not depend on the exact trajectory in RH taken by the aerosol. Instead, we have focused on estimating the influence of uncertainties in the thermophysical parameters and the calibration of the supersaturation at a fixed temperature of 300 K for ammonium sulfate particles initially 90 nm in diameter. αM has been varied between 1.0 and 0.1 and, for each value, the upper and lower limits of the predicted size have been used to define an upper and lower limit on an uncertainty envelope, as shown in Figure 3. Although it is clearly possible to discriminate between values of αM of 1.0 and 0.1 in these measurements, within the uncertainties of the measurements and model predictions, the uncertainty envelopes overlap considerably even for αM values of 0.2 and 0.5.
Figure 3.
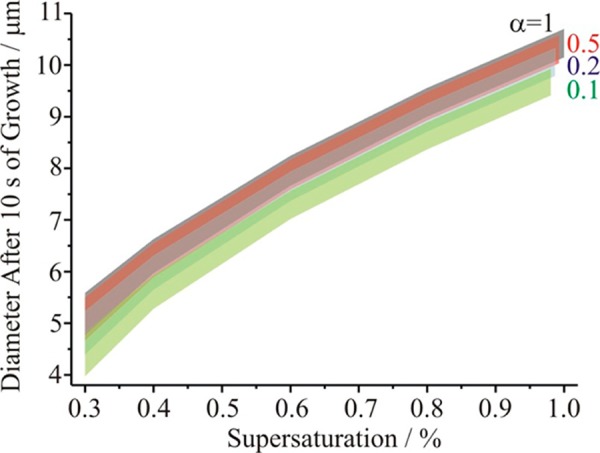
Sensitivity of growth size at 10 s in a continuous flow streamwise thermal gradient CCN chamber type measurement to the mass accommodation coefficient (gray, αM = 1; red, αM = 0.5; blue, αM = 0.2; green, αM = 0.1). The upper and lower limits of each envelope come from the uncertainties in the thermophysical parameters and the saturation, as described in the text. The envelopes at a saturation of ∼1% are taken to marginally different values to help indicate the range of values to be expected for each value of αM.
The sensitivity of αM to the uncertainties in thermophysical parameters (0 to +10% error) and saturation are presented in Figure 4a; the ranges in uncertainty are chosen to reflect the expected ranges discussed earlier. The solid color bars indicate the range in uncertainty that must be considered for the various parameters. Measurements made by this approach are insensitive to the self-diffusion coefficient of water-in-water vapor, to the thermal conductivity of water vapor and the initial droplet size, and these are not shown in Figure 4. Similarly, sensitivities to uncertainties in solution density, refractive index when the droplets are sized, and enthalpy of vaporization are considerably smaller than those shown. The change in αM that is required to counter the uncertainty in the thermophysical property or environmental condition is reported, such that the change in the droplet size at the measurement time of 10 s remains within −5% of the baseline size for the case without any errors in the thermophysical parameters or environmental conditions. An upper error on the size of +5% is not considered, as this would lead to a retrieved value of αM that would be considerably larger than 1.
Figure 4.
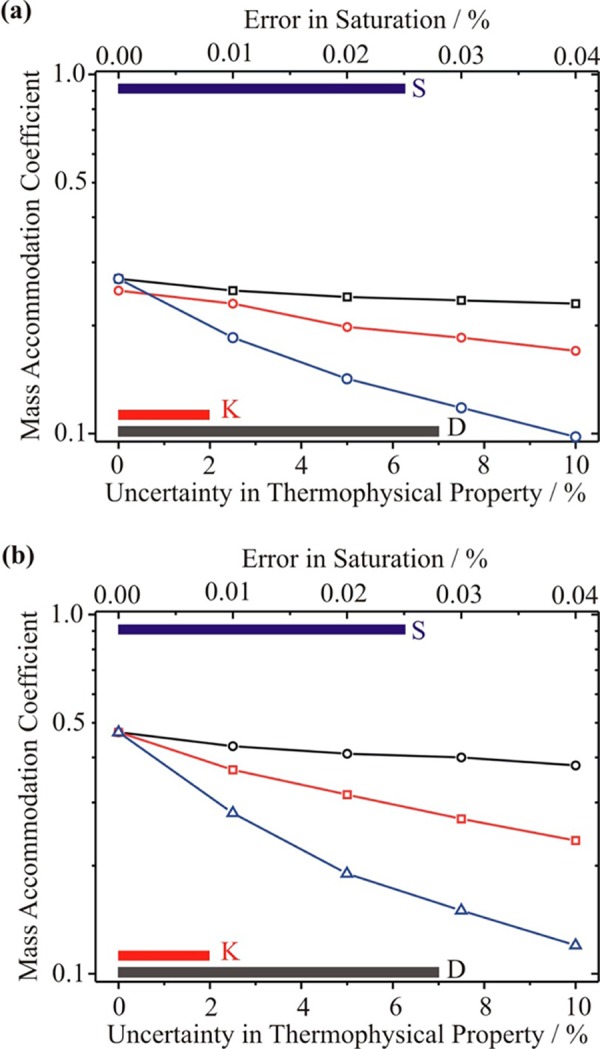
Sensitivity of the value of the mass accommodation coefficient retrieved from the growth size in CFSTGC measurements to uncertainties in diffusion coefficient (black), thermal conductivity (red), and saturation (blue). Note the log scale for αM. Only the lower limits for each quantity are shown. The accepted range of the uncertainties for the diffusion coefficient, thermal conductivity, and saturation is shown at the bottom by the solid bars (same colors as above) (a) Sensitivities assuming an acceptable tolerance on the uncertainty in radius of −5%. (b) Sensitivities assuming an acceptable tolerance on the uncertainty in radius of −2%.
Figure 4a should be read as follows. For zero error in the diffusion coefficient, thermal conductivity, and saturation, the minimum value of the mass accommodation coefficient that would be consistent with the measurements within the error on the size determination would be 0.27. Values considerably larger than 1 would also be consistent, although these are not considered here. These simulations are for a supersaturation of 0.3%; higher values of the supersaturation lead to larger changes in the droplet size, and an even lower value of αM is found to be consistent with the growth measurement. These simulations reflect the lack of discrimination apparent in the previous figure, even for values of αM of 0.2 and 0.5. If the accuracy in the size determination/spread in the final size distribution could be improved to be better than ±2%, the ability to resolve between values of αM would be improved and this is shown in Figure 4b. However, the strong sensitivity to the saturation and to a lesser extent the thermal conductivity remains.
In summary, measurements of the kinetics of CCN activation can allow discrimination between values of αM if less than 0.2. However, for values larger than this we suggest that the growth kinetics for all values of αM are within the uncertainties of the thermophysical parameters and saturation value. This is indeed broadly consistent with previous assessments of the LACIS and CFSTGC techniques.48,49,51 Once again, the importance of an accurate measurement of the saturation is crucial and with these techniques the value varies significantly during the trajectory taken by the aerosol through the instrument. From this analysis, we expect an upper limit for αM that can be resolved by this technique of 0.25. Given the uncertainties in the thermophysical properties, size, and saturation, we suggest that the differences in the condensation kinetics for values larger than this cannot be resolved. Thus, these measurements can be stated as reporting a value for αM that is larger than 0.25, consistent with the values reported by the expansion chamber measurements. As for the expansion chamber work, the experimental times and droplet sizes at which measurements are made provide only an indirect signature of the value of αM: the sizes at the time of measurement are governed by the early time dependence in the growth kinetics for particles ≪1 μm in diameter during which αM directly has an impact.
IV.c. Condensation Measurements Made with Aerosol Optical Tweezers
We have recently reported the details of a new method for investigating condensation and evaporation from a water droplet surface with a resolution approaching a molecular layer.17 A solution droplet is initially captured by a single beam gradient force optical trap (optical tweezers) and rapidly equilibrates with the surrounding gas phase environment, achieving a steady size at which the vapor pressure is equal to the surrounding partial pressure of water. Instantaneous perturbations to the droplet temperature of a few millikelvin are initiated by changing the extent of optical heating.17,118,119 The droplet size must then respond, with evaporation or condensation leading to a change in the solute concentration until the droplet vapor pressure is once again restored to balance the surrounding RH. Measurements were made at RHs higher than 95% for droplets in a size range of between 3.5 and 5 μm with each evaporation or condensation event leading to a size change of <10 nm on a time scale of <5 s. To attempt to resolve the influence of surface processes on the condensational/evaporation kinetics from limitations imposed by gas diffusion, measurements were made over a range in pressure from ∼4 to 100 kPa. The recorded time dependence of droplet size was fitted to a single exponential, representing the kinetics by a rate constant for the mass transfer with a typical error of ±5%. Uncertainties in the droplet size are ≪1 nm, temperatures are <0.2 K, and times ≪50 ms. The largest uncertainty is expected to be the water activity, a factor that led to problems in initially interpreting our kinetic data. The water activity can be retrieved by fitting the refractive index of the droplet from the cavity enhanced Raman fingerprint with a typical uncertainty of ±0.06% in the refractive index.118 At an RH of 98.5%, typical of the measurements, this corresponds to a salt solution concentration of 20 ± 4 g L–1, an uncertainty in RH of ±0.2%.
Initially, we consider the sensitivity of the rate constant measured by the technique to the value of αM, the gas phase saturation and the uncertainties in the thermophysical parameters at two pressures, 100 and 20 kPa. Given the failing of a key assumption in the derivation of eq 1 under conditions of low pressure, uncertainties in the values in the transport coefficients, and ambiguities in the conceptual framework discussed below, a total pressure below 10 kPa is not considered. Indeed, at the lowest pressures it is anticipated that the condensation/evaporation kinetics will be determined by the efficiency of heat transport rather than mass transfer. The rate constants are calculated for a typical condensation event with the droplet radius changing from 4000 to 4006 nm at an RH of 98.86% and temperature of 293 K. Only the sensitivities to the thermophysical parameters that influence the rate constant significantly are shown at each pressure. At high pressure, Figure 5a, the rate constant is insensitive to the self-diffusion coefficient and thermal conductivity of water vapor. The uncertainties in the diffusion coefficient of water-in-air and the thermal conductivity of air are such that the sensitivity of the rate constant to αM is insufficiently pronounced to allow values larger than ∼0.4 to be resolved, as indicated by the dotted lines that designate the lowest rate constant that could be measured with the uncertainty in the transport coefficients. The solid color bars indicate the range in uncertainty that must be considered for the various parameters. At a pressure of 20 kPa, Figure 5b, the rate constant for condensational growth is insensitive to all of the thermophysical parameters except for the thermal conductivity of air. The figure indicates that the optical tweezers technique would only be able to discriminate between values of αM smaller than 0.4 due to the uncertainty in the thermal conductivity.
Figure 5.
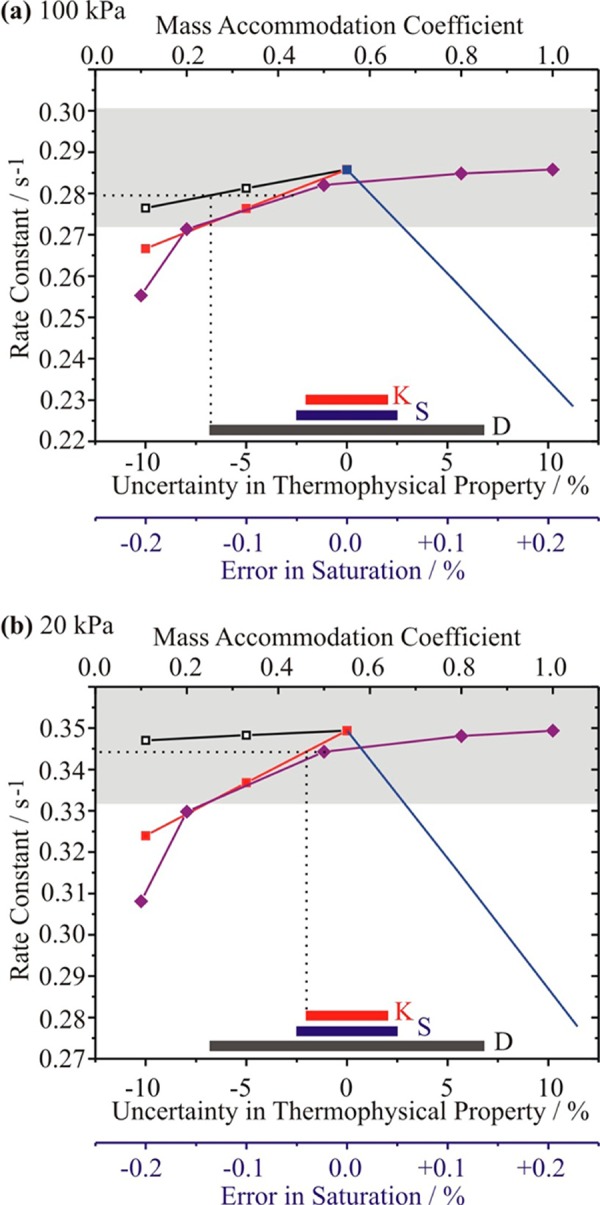
Sensitivity of rate constant for condensational growth measured in optical tweezers studies to the uncertainties in diffusion coefficient (black), thermal conductivity of air (red), and saturation (blue). The sensitivity of the rate constant to the mass accommodation coefficient is also shown (purple). The accepted range of the uncertainties for the diffusion coefficients and thermal conductivities is shown at the bottom by the solid bars (same colors as above). The gray shaded box indicates the level of uncertainty in the measured rate constants. Pressures: (a) 100 kPa and (b) 20 kPa.
Once the current uncertainty associated with the rate constant is considered (±5%), an uncertainty indicated by the extent of the gray box in Figure 5, measurements of the rate constant are only expected to be outside this error if the value of αM falls below 0.2, with a marginal improvement at intermediate pressures. Thus, we expect an upper limit for αM that can be resolved by this technique of 0.2. Above this value, we can only expect to be able to conclude than αM is greater than 0.2.
The sensitivities of the rate constants to the uncertainty in the saturation value are also shown in Figure 5. It is clear that the current accuracy with which the salt concentration and RH can be determined, ±0.06% in refractive index and ±0.2% in RH, is inadequate for us to determine the mass accommodation coefficient. A reduction in the uncertainty associated with the RH to ±0.05% is possible from an improvement in the resolution of the resonant mode wavelengths. If this level of accuracy is achieved, examples of the pressure dependence of the condensational rate constant with the associated uncertainties in the thermophysical parameters and RH are shown in Figure 6 for values of αM between 1.0 and 0.05. Although these simulations clearly indicate that it will be possible to determine values of the mass accommodation coefficient of less than 0.15, accurately determining the value of the mass accommodation coefficient when above 0.15 will not be possible within the uncertainties associated with the measurements and the thermophysical parameters. It will therefore only be possible to confirm if the value of αM is larger than 0.15 with the optical tweezers technique.
Figure 6.
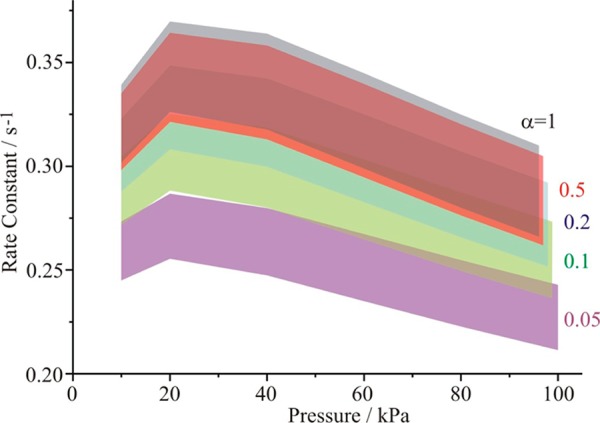
Sensitivity of condensational growth rate measured by optical tweezers technique to the mass accommodation coefficient (gray, αM = 1; red, αM = 0.5; blue, αM = 0.2; green, αM = 0.1; purple, αM = 0.05). The upper and lower limits of each envelope come from the uncertainties in the thermophysical parameters and the saturation, as described in the text. The envelopes at a pressure of 100 kPa are taken to marginally different values to help indicate the range of values to be expected for each value of αM.
IV.d. Evaporation Measurements Made with an Electrodynamic Balance
The evaporation of water from aqueous droplets levitated in an electrodynamic balance (EDB) has been studied by a number of research groups, including Davis and co-workers,55,56,120,121 Jakubczyk and co-workers,54 and Reid and co-workers.52 A charged droplet, initially 10–20 μm radius, is generated by a droplet-on-demand generator with an induction electrode52 or by electrospray.55 The charged droplet is then captured within an EDB, either based on a hyperboloidal electrodes design54 or having concentric cylindrical electrodes52 operating at atmospheric pressure. Measurements are performed either in a chamber flushed through with gas54 or in a direct gas jet,52 and either in dry nitrogen/air or in humidified nitrogen/air. In the latter case, measurements of RH near saturation cannot be performed with sufficient accuracy to perform kinetic analysis and the RH must instead be retrieved from the kinetic measurements directly, along with a value for the evaporation coefficient.54 Typically, when evaporating into dry nitrogen/air, the droplet evaporates completely (or becomes too small to be retained within the trap) over a time scale of ∼2 s.56 Evaporation into humidified nitrogen is considerably slower and has been studied for >20 s with the radius decreasing from ∼10 to <5 μm.54 In all cases, the evolving size of the droplet is measured from elastic light scattering, either from a resonance spectrum or from recording the time-dependent phase function. Typically, the accuracy of a single size estimate is ±15 nm, once local minima in the fitting of the phase function are excluded from the fitting process.54 Evaporation measurements have been performed for droplets containing inorganic salts and organic components, and at a range of temperatures.52,54−56 Suppression of surface temperature due to evaporative cooling must be considered and, thus, the droplet temperature is marginally lower than that of the surrounding gas phase. Zientara et al. reported that a correction factor is required that becomes significant as the freezing point of water is approached to account for thermal effusion, but the correction factor approaches 1 as the temperature at the droplet surface increases above 280 K.54
We consider specifically the evaporation of water droplets, initially ∼9.8 μm in radius, into a humidified atmosphere of air, as these measurements have been used to estimate the evaporation coefficient.54 Sensitivities of the time dependence of the evaporation to a specified error in the diffusion coefficient of water-in-air, the thermal conductivity of air, and the saturation have been investigated. Sensitivities to the other thermophysical parameters are too small to require further consideration. The base case simulation is chosen, which uses the best estimates of all the thermophysical parameters and a saturation value of 0.9762, typical of the reported experiments. To examine the sensitivities to errors in the transport coefficients or saturation, the evaporation coefficient was varied to compensate for the error in the chosen property such that the time dependence of size remained within the reported error of the experiments for all evaporation times up to 16 s. Only positive errors in the transport coefficients are shown, as these lead to a reduction in the recovered value of the evaporation coefficient, which is reported as being unity by Zientara et al.54 The uncertainties in the lower limit for the evaporation coefficient derived from this sensitivity analysis, indicated by the error bars in Figure 7, come from keeping the size within a ±15 nm tolerance on the size for the base simulation. A sensitivity analysis has been performed at two temperatures. It is clear from Figure 7 that the rather small uncertainties associated with the key transport coefficients can lead to quite significant systematic errors in the evaporation coefficient estimated from the time dependence of the droplet size. Ignoring these uncertainties can lead to an estimation of the evaporation coefficient that is significantly below its true value: if values of the transport coefficients are used that are larger than the values used in the analysis previously, but still within the uncertainties, the value of the evaporation coefficient retrieved would be larger than previously reported. By comparison, for the expansion chamber measurements discussed in section IV.a, the retrieved value for the mass accommodation coefficient is much less sensitive to the uncertainties in the transport coefficients than the EDB measurements. Further, it can be seen from Figure 7 that the retrieved value of the evaporation coefficient from the EDB technique is strongly dependent on the saturation value inferred in the measurement.
Figure 7.
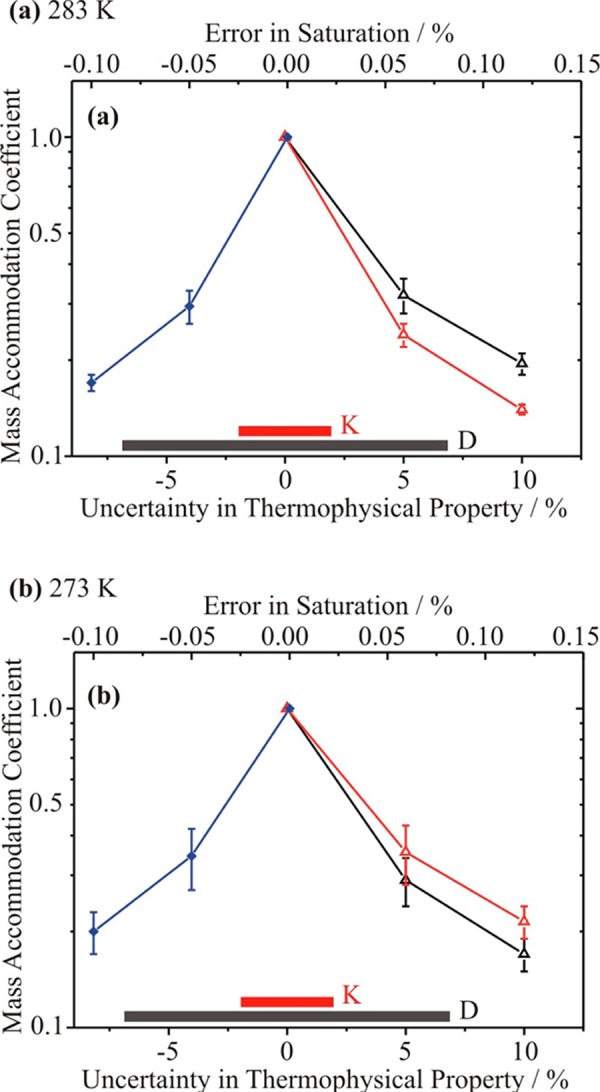
Sensitivity of the retrieved value of the mass accommodation coefficient from measurements of the time-dependent evaporation of droplets trapped by an EDB to uncertainties in diffusion coefficient (black), thermal conductivity (red), and saturation (blue). The accepted range of the uncertainties for the diffusion coefficient and thermal conductivity is shown at the bottom by the solid bars (same colors as above). Two temperatures are considered: (a) 283 K and (b) 273 K.
In Figure 8 we show the simulated time dependencies of a water droplet during evaporation for a range of values of the evaporation coefficient and including the uncertainties in the values of the diffusion coefficient for water in air and for the thermal conductivity, but neglecting the uncertainty in the saturation value at this stage. It is clear that given the uncertainties in these transport coefficients, it is not possible to resolve between different values of the evaporation coefficient from these measurements if the mass accommodation coefficient is 0.1 or larger. It may be possible, if the saturation value is known accurately, to resolve the difference between a value of 0.1 and 0.05. However, one factor not considered in the assessment of the evaporation kinetics of this approach is the accuracy with which the start time for the evaporation event is known. We have found that this uncertainty can induce large errors in interpreting the evaporation kinetics.52 Indeed, there is a flight time for the travel of the injected droplet into the EDB trap that can be in excess of 100 ms. This error in start time is equivalent to a systematic error in the size of ∼30 nm at any stated time, already a larger contribution to the uncertainty in size than quoted by Jakubczyk and co-workers.54
Figure 8.
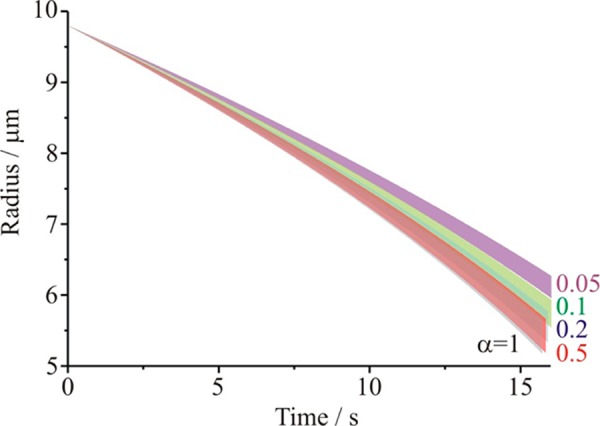
Sensitivity of time dependence of droplet evaporation in an EDB measurement to the mass accommodation coefficient (gray, αM = 1; red, αM = 0.5; blue, αM = 0.2; green, αM = 0.1; purple, αM = 0.05). The upper and lower limits of each envelope come from the uncertainties in the thermophysical parameters, as described in the text. The envelopes at the long time limit are taken to marginally different values to help indicate the range of values to be expected for each value of αM.
In measurements that use the electrodynamic balance approach to determine the evaporation coefficient, it is common to use the time dependence over the first few seconds until the droplet decreases below 6 μm radius to estimate the saturation value.54 It is assumed that this early time portion of the evaporation process is independent of the evaporation surface kinetics. However, on the basis of the uncertainties resulting from the transport coefficients, we suggest it is not possible to even estimate the saturation value from the early time data. It is possible to compensate for changes in the saturation and the evaporation coefficient such that the time dependence of droplet radius remains the same within the uncertainty associated with the measurement of the size. This is shown in Figure 9a, which shows two almost identical time-resolved profiles of droplet size but for evaporation coefficients as different as 0.1 and 1.0. The differences in size between the two at all times is <±15 nm, the stated uncertainty in the size measurement. Thus, we suggest that it is not possible to independently retrieve values of the saturation and evaporation coefficient from this approach, and Figure 9b shows the interdependence of the two values. Given the sensitivity to the saturation value identified by the analysis of the optical tweezers measurements, this is not surprising.
Figure 9.
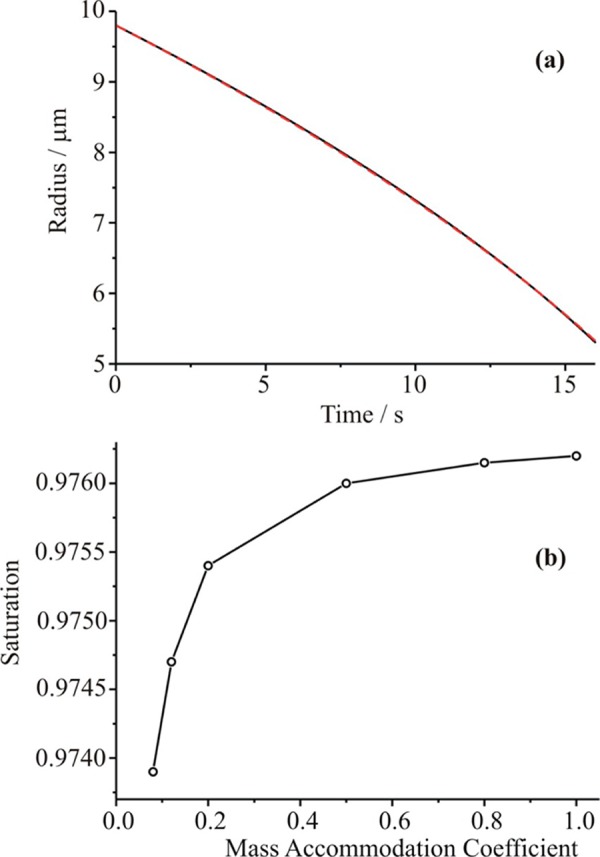
(a) Two simulated time dependencies for the evaporation of water droplets: αM = 1 and S = 0.9762, black line; αM = 0.1 and S = 0.9744, red dashed line. (b) Interdependence of the retrieved values of the mass accommodation coefficient and the saturation. A low value of the saturation with a low value of αM is equivalent to a high value of the saturation with a high value of αM, within the uncertainty in the size measurements.
V. Conclusions
We have examined the impact of uncertainties in key transport coefficients, thermophysical parameters, and experimental conditions, such as saturation, on the ability of different measurement techniques to determine the value of the mass accommodation coefficient, αM, for water condensing on or evaporating from a water surface. The key thermophysical parameters that must be used in retrieving values of αM from experimental measurements are the diffusion coefficient and thermal conductivity of the gas phase surrounding the droplet. To determine the most reliable parametrizations to use for the diffusion coefficients of water in air/nitrogen and the thermal conductivities of air, nitrogen, and water vapor, a literature search has been undertaken and the results critically analyzed.
The measurement techniques assessed are the expansion chamber,18,20 Continuous Flow Streamwise Thermal Gradient CCN Chamber49,51 and Leipzig Aerosol Cloud Interaction Simulator,48 optical tweezers,17 and the electrodynamic balance.52,54−56 Using the same semianalytic framework to model heat and mass transfer to/from aerosol particles in all the studied systems, two types of simulations have been performed. The first highlights the ability of each technique to resolve between different values of αM given the magnitude of the uncertainties in the thermophysical and environmental parameters used in the model; the second shows how the value of αM retrieved by a technique would be altered by compensating for a given uncertainty in a thermophysical or environmental parameter. In assessing each technique we have identified the observed quantities that could be better quantified to more tightly constrain the retrieved values of αM and, given the limitations of current data, have recommended the limiting values of αM that can be determined. In all cases, better quantification of the saturation value would lead to an improved constraint on the value of αM and this is perhaps unsurprising. We suggest that the expansion chamber measurements are consistent with a value that is larger than 0.5 and the activation kinetics measurements with a value larger than 0.25. Measurements made by the former approach could be used to better constrain αM if the induction time for the onset of heterogeneous nucleation was more accurately defined allowing a reduced uncertainty in growth time, and if measurements of evolving droplet size could be made at times earlier than 20 ms, typical of the current reported measurements. Measurements of activation kinetics could be better used to constrain αM if the droplet size was more accurately measured and if the errors in the saturation profile along the flow tubes were better quantified. In reconciling the values reported by these techniques, we consider that the value can be safely assumed to be larger than 0.5 for water adsorbing to a water surface, independently verifying assessments made by previous authors.3,18 Notably, this limiting value is also consistent with the jet and droplet evaporation work of Saykally and co-workers not evaluated in this study who report the evaporation coefficient to be larger than 0.5.15,110,122
In contrast to these ensemble techniques, we consider that the single particle measurements performed so far have insufficient sensitivity to contribute to the debate on the value of αM. The optical tweezers approach,17 although providing extremely accurate measurements of molecular fluxes, requires a considerable reduction in the uncertainty associated with the value of saturation. If this improvement is achieved, uncertainties in the thermophysical parameters will still conspire to limit the resolution of values of αM if above 0.2. The strengths of this particular technique are that near-isothermal growth kinetics near equilibrium can be accurately examined. This will allow measurements to be made on droplets coated in surface active organic films34 and will permit a direct comparison of the kinetics of condensation and evaporation. Further, measurements can be made over a wide range of droplet compositions with varying subsaturated water activity, retaining approximately constant water activity in the droplet bulk throughout a growth/evaporation event. It is not clear that such measurements can be made by any other approach.
The EDB measurements performed by us and other workers should be considered to be the least reliable for retrieving values of αM.52,54 The size regime within which measurements are performed requires that the thermophysical parameters be known with an accuracy that is not currently accessible. Such a level of accuracy is required to allow an improved estimation of the saturation. Currently, a unique retrieval of the saturation and the value of αM from an evaporation profile is not possible. Improvements in the accuracy of size measurements and the start time are essential. Sequential measurements of mass transfer kinetics made for droplets of known or assumed αM (e.g., pure water droplets) followed by droplets with an unknown value of αM (e.g., surfactant coated droplets) could provide an extremely accurate method for comparatively assessing kinetics, something that it is difficult to achieve in ensemble measurements. However, we consider that values reported by this approach so far should be considered to be unreliable.54
A variety of other techniques have been used to estimate values of αM. These have included the droplet train instrument.22 We have chosen not to assess this approach here as it has been extensively reviewed and discussed in the literature.3,26 It is also not straightforward to assess the technique by the semianalytic framework used here without resorting to complex fluid dynamics calculations, which we consider is beyond the remit of the current work.30,123 However, it should be recognized that there are large uncertainties in the diffusion coefficient of water in the low-pressure environment when water dominates the composition of the gas phase and also in the thermal conductivity of the mixture, and these will be particularly important to resolve when droplet train measurements at very low temperatures are interpreted. These problems are common with the optical tweezers approach.
Considering the problems associated with interpreting measurements at low pressure/high water mole fraction in the gas phase, two further problems immediately present themselves that challenge the current conceptual picture adopted in understanding mass and heat transfer during the condensation or evaporation of water. The first relates to our understanding of the process of water diffusion in the limit of very low inert gas concentrations. At the low pressure limit, considering in particular the case where the gas phase is composed entirely of water vapor, the concentration gradient that drives mass transport is equivalent to a pressure gradient, whereas eq 1 from Kulmala et al.16 assumes a constant pressure by definition. The accuracy of the correction for convective mass transport used in the semianalytical framework must therefore be better understood and the applicability of eq 1 at the limit of low-pressure condensation of water should be quantified. Second, for all the cases considered in this manuscript the gross mass flux is considerably larger than the net mass flux, i.e., the uptake coefficient γ ≪ 1.14 At low pressure, as the mole fraction of water in the gas phase approaches 1, the excess latent heat deposited in the droplet via condensation must still be carried away by desorbing molecules. If γ → 1, the mass and thermal accommodation coefficients could no longer be assumed to be independent. Practically, this limit can only be achieved experimentally during condensation or evaporation in to a vacuum, or in molecular dynamics simulations. Our results also highlight the fact that the simultaneous consideration of mass and heat transport is a prerequisite for a successful determination of accommodation coefficients from condensation/evaporation data.
Acknowledgments
R.E.H.M. acknowledges the NERC for funding of a postdoctoral research position. J.P.R. acknowledges the EPSRC for support as a Leadership Fellow. I.R. acknowledges the European Commission FP7 (ERC Starting Grant project ATMOGAIN no. 278277) for financial support.
Supporting Information Available
Full details (including tables and figures) of the parametrizations identified in the literature survey regarding the diffusion coefficient of water in air; the diffusion coefficient of water in water vapor; the viscosity of air; the viscosity of nitrogen; the viscosity of water; the thermal conductivity of air; the thermal conductivity of nitrogen; the thermal conductivity of water; and formulas for determining the thermal conductivity for a mixture. This material is available free of charge via the Internet at http://pubs.acs.org.
The authors declare no competing financial interest.
Supplementary Material
References
- Vehkamaki H.; Riipinen I. Chem. Soc. Rev. 2012, 41, 5160–5173. [DOI] [PubMed] [Google Scholar]
- Krieger U. K.; Marcolli C.; Reid J. P. Chem. Soc. Rev. 2012, 41, 6631–6662. [DOI] [PubMed] [Google Scholar]
- Kolb C. E.; Cox R. A.; Abbatt J. P. D.; Ammann M.; Davis E. J.; Donaldson D. J.; Garrett B. C.; George C.; Griffiths P. T.; Hanson D. R.; et al. Atmos. Chem. Phys. 2010, 10, 10561–10605. [Google Scholar]
- McFiggans G.; Artaxo P.; Baltensperger U.; Coe H.; Facchini M. C.; Feingold G.; Fuzzi S.; Gysel M.; Laaksonen A.; Lohmann U.; et al. Atmos. Chem. Phys. 2006, 6, 2593–2649. [Google Scholar]
- Charlson R. J.; Schwartz S. E.; Hales J. M.; Cess R. D.; Coakley J. A.; Hansen J. E.; Hofmann D. J. Science 1992, 255, 423–430. [DOI] [PubMed] [Google Scholar]
- Riipinen I.; Pierce J. R.; Yli-Juuti T.; Nieminen T.; Hakkinen S.; Ehn M.; Junninen H.; Lehtipalo K.; Petaja T.; Slowik J.; et al. Atmos. Chem. Phys. 2011, 11, 3865–3878. [Google Scholar]
- Zhang X.; Pandis S. N.; Seinfeld J. H. Aerosol Sci. Technol. 2012, 46, 874–885. [Google Scholar]
- Virtanen A.; Joutsensaari J.; Koop T.; Kannosto J.; Yli-Pirila P.; Leskinen J.; Makela J. M.; Holopainen J. K.; Poeschl U.; Kulmala M.; et al. Nature 2010, 467, 824–827. [DOI] [PubMed] [Google Scholar]
- Mikhailov E.; Vlasenko S.; Martin S. T.; Koop T.; Poschl U. Atmos. Chem. Phys. 2009, 9, 9491–9522. [Google Scholar]
- Zobrist B.; Marcolli C.; Pedernera D. A.; Koop T. Atmos. Chem. Phys. 2008, 8, 5221–5244. [Google Scholar]
- Bones D. L.; Reid J. P.; Lienhard D. M.; Krieger U. K. Proc. Natl. Acad. Sci. U. S. A. 2012, 109, 11613–11618. [DOI] [PMC free article] [PubMed] [Google Scholar]
- Zobrist B.; Soonsin V.; Luo B. P.; Krieger U. K.; Marcolli C.; Peter T.; Koop T. Phys. Chem. Chem. Phys. 2011, 13, 3514–3526. [DOI] [PubMed] [Google Scholar]
- Tong H. J.; Reid J. P.; Bones D. L.; Luo B. P.; Krieger U. K. Atmos. Chem. Phys. 2011, 11, 4739–4754. [Google Scholar]
- Poschl U.; Rudich Y.; Ammann M. Atmos. Chem. Phys. 2007, 7, 5989–6023. [Google Scholar]
- Shiraiwa M.; Pfrang C.; Koop T.; Poeschl U. Atmos. Chem. Phys. 2012, 12, 2777–2794. [Google Scholar]
- Kulmala M.; Vesala T.; Wagner P. E. Proc. R. Soc. London, Ser. A-Math. Phys. Eng. Sci. 1993, 441, 589–605. [Google Scholar]
- Miles R. E. H.; Knox K. J.; Reid J. P.; Laurain A. M. C.; Mitchem L. Phys. Rev. Lett. 2010, 105, 116101. [DOI] [PubMed] [Google Scholar]
- Winkler P. M.; Vrtala A.; Rudolf R.; Wagner P. E.; Riipinen I.; Vesala T.; Lehtinen K. E. J.; Viisanen Y.; Kulmala M. J. Geophys. Res.-Atmos. 2006, 111, D19202. [Google Scholar]
- Kulmala M.; Vesala T. J. Aerosol Sci. 1991, 22, 337–346. [Google Scholar]
- Winkler P. M.; Vrtala A.; Wagner P. E.; Kulmala M.; Lehtinen K. E. J.; Vesala T. Phys. Rev. Lett. 2004, 93, 075701. [DOI] [PubMed] [Google Scholar]
- Wagner P. E. J. Aerosol Sci. 1991, 22, 789–791. [Google Scholar]
- Li Y. Q.; Davidovits P.; Shi Q.; Jayne J. T.; Kolb C. E.; Worsnop D. R. J. Phys. Chem. A 2001, 105, 10627–10634. [Google Scholar]
- Davis E. J. Atmos. Res. 2006, 82, 561–578. [Google Scholar]
- Millikan R. A. Phys. Rev. 1923, 22, 1–23. [Google Scholar]
- Epstein P. S. Phys. Rev. 1924, 23, 710–733. [Google Scholar]
- Davidovits P.; Worsnop D. R.; Jayne J. T.; Kolb C. E.; Winkler P.; Vrtala A.; Wagner P. E.; Kulmala M.; Lehtinen K. E. J.; Vesala T.; et al. Geophys. Res. Lett. 2004, 31, L22111. [Google Scholar]
- Mozurkewich M. Aerosol Sci. Technol. 1986, 5, 223–236. [Google Scholar]
- Marek R.; Straub J. Int. J. Heat Mass Transf. 2001, 44, 39–53. [Google Scholar]
- Davidovits P.; Kolb C. E.; Williams L. R.; Jayne J. T.; Worsnop D. R. Chem. Rev. 2006, 106, 1323–1354. [DOI] [PubMed] [Google Scholar]
- Morita A.; Sugiyama M.; Kameda H.; Koda S.; Hanson D. R. J. Phys. Chem. B 2004, 108, 9111–9120. [Google Scholar]
- Vieceli J.; Roeselova M.; Potter N.; Dang L. X.; Garrett B. C.; Tobias D. J. J. Phys. Chem. B 2005, 109, 15876–15892. [DOI] [PubMed] [Google Scholar]
- Takahama S.; Russell L. M. J. Geophys. Res.-Atmos 2011, 116, D02203. [Google Scholar]
- Neshyba S.; Nugent E.; Roeselova M.; Jungwirth P. J. Phys. Chem. C 2009, 113, 4597–4604. [Google Scholar]
- Donaldson D. J.; Vaida V. Chem. Rev. 2006, 106, 1445–1461. [DOI] [PubMed] [Google Scholar]
- Chan M. N.; Chan C. K. Atmos. Chem. Phys. 2005, 5, 2703–2712. [Google Scholar]
- Cruz C. N.; Pandis S. N. J. Geophys. Res.-Atmos. 1998, 103, 13111–13123. [Google Scholar]
- Chan M. N.; Chan C. K. Atmos. Environ. 2007, 41, 4423–4433. [Google Scholar]
- Thornton J. A.; Abbatt J. P. D. J. Phys. Chem. A 2005, 109, 10004–10012. [DOI] [PubMed] [Google Scholar]
- Mmereki B. T.; Chaudhuri S. R.; Donaldson D. J. J. Phys. Chem. A 2003, 107, 2264–2269. [Google Scholar]
- Chuang P. Y.; Charlson R. J.; Seinfeld J. H. Nature 1997, 390, 594–596. [Google Scholar]
- Nenes A.; Ghan S.; Abdul-Razzak H.; Chuang P. Y.; Seinfeld J. H. Tellus Ser. B 2001, 53, 133–149. [Google Scholar]
- Kreidenweis S. M.; Walcek C. J.; Feingold G.; Gong W. M.; Jacobson M. Z.; Kim C. H.; Liu X. H.; Penner J. E.; Nenes A.; Seinfeld J. H. J. Geophys. Res.-Atmos. 2003, 108, 4213. [Google Scholar]
- Laaksonen A.; Vesala T.; Kulmala M.; Winkler P. M.; Wagner P. E. Atmos. Chem. Phys. 2005, 5, 461–464. [Google Scholar]
- Nenes A.; Charlson R. J.; Facchini M. C.; Kulmala M.; Laaksonen A.; Seinfeld J. H. Geophys. Res. Lett. 2002, 29, 1848. [Google Scholar]
- Rosenfeld D. Science 2000, 287, 1793–1796. [DOI] [PubMed] [Google Scholar]
- Hudson J. G.; Yum S. S. J. Atmos. Sci. 1997, 54, 2642–2654. [Google Scholar]
- Yum S. S.; Hudson J. G.; Xie Y. H. J. Geophys. Res.-Atmos. 1998, 103, 16625–16636. [Google Scholar]
- Voigtlaender J.; Stratmann F.; Niedermeier D.; Wex H.; Kiselev A. J. Geophys. Res.-Atmos. 2007, 112, D20208. [Google Scholar]
- Raatikainen T.; Moore R. H.; Lathem T. L.; Nenes A. Atmos. Chem. Phys. 2012, 12, 4227–4243. [Google Scholar]
- Lance S.; Medina J.; Smith J. N.; Nenes A. Aerosol Sci. Technol. 2006, 40, 242–254. [Google Scholar]
- Roberts G. C.; Nenes A. Aerosol Sci. Technol. 2005, 39, 206–221. [Google Scholar]
- Davies J. F.; Haddrell A. E.; Reid J. P. Aerosol Sci. Technol. 2012, 46, 666–677. [Google Scholar]
- Shaw R. A.; Lamb D. J. Chem. Phys. 1999, 111, 10659–10663. [Google Scholar]
- Zientara M.; Jakubczyk D.; Kolwas K.; Kolwas M. J. Phys. Chem. A 2008, 112, 5152–5158. [DOI] [PubMed] [Google Scholar]
- Shulman M. L.; Charlson R. J.; Davis E. J. J. Aerosol Sci. 1997, 28, 737–752. [Google Scholar]
- Taflin D. C.; Zhang S. H.; Allen T.; Davis E. J. AIChE J. 1988, 34, 1310–1320. [Google Scholar]
- Barrett J.; Clement C. J. Colloid Interface Sci. 1992, 150, 352–364. [Google Scholar]
- Barrett J. C.; Clement C. F. J. Aerosol Sci. 1988, 19, 223–242. [Google Scholar]
- Davis E. J.; Schweiger G.. The Airborne Microparticle; Springer-Verlag: Berlin, 2002. [Google Scholar]
- Seinfeld J. H.; Pandis S. N.. Atmospheric Chemistry and Physics: From Air Pollution to Climate Change; Wiley & Sons: New York, 2006. [Google Scholar]
- Wagner P. E. In Aerosol Microphysics II: Chemical Physics of Microparticles; Marlow W. H., Ed.; Springer: Berlin, 1982; Vol. 29, p 129. [Google Scholar]
- Gershenzon M.; Davidovits P.; Williams L. R.; Shi Q. A.; Jayne J. T.; Kolb C. E.; Worsnop D. R. J. Phys. Chem. A 2004, 108, 1567–1573. [Google Scholar]
- Voigtlander J.; Stratmann F.; Niedermeier D.; Wex H.; Kiselev A. J. Geophys. Res.-Atmos. 2007, 112, D20208. [Google Scholar]
- Poling B. E.; Prausnitz P. M.; O’Connell J. P.. The Properties of Gases and Liquids, 5th ed.; McGraw Hill: New York, 2001. [Google Scholar]
- Chen N. H.; Othmer D. F. J. Chem. Eng. Data 1962, 7, 37–41. [Google Scholar]
- Fuller E. N.; Ensley K.; Giddings J. C. J. Phys. Chem. 1969, 73, 3679–3685. [Google Scholar]
- Fuller E. N.; Schettler P. D.; Giddings J. C. Ind. Eng. Chem. 1966, 58, 19–27. [Google Scholar]
- Gilliland E. R. Ind. Eng. Chem. 1934, 26, 681–685. [Google Scholar]
- Hirschfelder J. O.; Curtiss C. F.; Bird R. B.. Molecular theory of gases and liquids; Wiley: New York, 1954. [Google Scholar]
- Huang T. C.; Huang C. H.; Yang F. J. F.; Kuo C. H. J. Chromatogr. 1972, 70, 13–24. [Google Scholar]
- Marrero T. R.; Mason E. A. Chem. Eng. Commun. 1980, 7, 159–168. [Google Scholar]
- Massman W. J. Atmos. Environ. 1998, 32, 1111–1127. [Google Scholar]
- Matsunaga N.; Nagashima A. J. Phys. Chem. 1983, 87, 5268–5279. [Google Scholar]
- Slattery J. C.; Bird R. B. AIChE J. 1958, 4, 137–142. [Google Scholar]
- Bird R. B.; Stewart W. E.; Lightfoot E. N.. Transport Phenomena; revised 2nd ed.; John Wiley & Sons, Inc.: New York, 2007. [Google Scholar]
- Fokin L. R.; Kalashnikov A. N. High Temp. 2008, 46, 614–619. [Google Scholar]
- Hellmann R.; Bich E.; Vogel E.; Dickinson A. S.; Vesovic V. J. Chem. Phys. 2009, 131, 014303. [DOI] [PubMed] [Google Scholar]
- Lee H.; Thodos G. Ind. Eng. Chem. Fundam. 1983, 22, 17–26. [Google Scholar]
- Liu H. Q.; Macedo E. A. J. Supercrit. Fluids 1995, 8, 310–317. [Google Scholar]
- Plawsky J.Transport Phenomena Fundamentals, 2nd ed.; CRC Press: Boca Raton, FL, 2010. [Google Scholar]
- Swinton F. L. In Diffusion Processes; Sherwood J., Ed.; Gordon and Breach: London, 1971. [Google Scholar]
- Yoshida K.; Matubayasi N.; Nakahara M. J. Chem. Phys. 2006, 125, 074307. [DOI] [PubMed] [Google Scholar]
- Marrero T. R.; Mason E. A. J. Phys. Chem. Ref. Data 1972, 1, 3–118. [Google Scholar]
- The Engineering Toolbox, www.engineeringtoolbox.com.
- Lemmon E. W.; Jacobsen R. T. Int. J. Thermophys. 2004, 25, 21–69. [Google Scholar]
- Pruppacher H. R.; Klett J. D.. Microphysics of Clouds and Precipitation; D. Reidel Publishing Co.: Dordrecht, Holland, Boston, 1978. [Google Scholar]
- Touloukian Y. S.; Liley P. E.; Saxena S. C.. Thermophysical properties of matter: the TPRC data series: a comprehensive compilation of data; IFI/Plenum: New York, 1970; Vol. 3. [Google Scholar]
- Tsilingiris P. T. Energy Convers. Manage. 2008, 49, 1098–1110. [Google Scholar]
- Sengers J. V.; Watson J. T. R. J. Phys. Chem. Ref. Data 1986, 15, 1291–1314. [Google Scholar]
- Lindsay A. L.; Bromley L. A. Ind. Eng. Chem. 1950, 42, 1508–1511. [Google Scholar]
- Mason E. A.; Saxena S. C. Phys. Fluids 1958, 1, 361–369. [Google Scholar]
- Tondon P. K.; Saxena S. C. Appl. Sci. Res. 1968, 19, 163–167. [Google Scholar]
- Li H. L.; Wilhelmsen O.; Lv Y. X.; Wang W. L.; Yan J. Y. Int. J. Greenhouse Gas Control 2011, 5, 1119–1139. [Google Scholar]
- Huber M. L.; Perkins R. A.; Laesecke A.; Friend D. G.; Sengers J. V.; Assael M. J.; Metaxa I. N.; Vogel E.; Mares R.; Miyagawa K. J. Phys. Chem. Ref. Data 2009, 38, 101–125. [Google Scholar]
- Saul A.; Wagner W. J. Phys. Chem. Ref. Data 1987, 16, 893–901. [Google Scholar]
- Wagner W.; Pruss A. J. Phys. Chem. Ref. Data 1993, 22, 783–787. [Google Scholar]
- Sato H.; Uematsu M.; Watanabe K.; Saul A.; Wagner W. J. Phys. Chem. Ref. Data 1988, 17, 1439–1540. [Google Scholar]
- Popiel C. O.; Wojtkowiak J. Heat Transfer Eng. 1998, 19, 87–101. [Google Scholar]
- Popiel C. O.; Wojtkowiak J. Heat Transfer Eng. 1999, 20, 97–97. [Google Scholar]
- Haar L.; Gallagher J. S.; Kell G. S.. NBS/NRC Steam Tables; Hemisphere Publishing Corp.: New York, 1984. [Google Scholar]
- Handbook of Chemistry and Physics, 87th ed.; CRC Press LLC: Boca Raton, FL, 2006–2007. [Google Scholar]
- Wukalowitsch M.Thermodynamische Eigenschaften des Wassers und des Wasserdampfes; VEB Verlag Tech.: Berlin, 1958. [Google Scholar]
- Apelblat A.; Korin E. J. Chem. Thermodyn. 2003, 35, 699–709. [Google Scholar]
- Menczel B.; Apelblat A.; Korin E. J. Chem. Thermodyn. 2004, 36, 41–44. [Google Scholar]
- Millard R. C.; Seaver G. Deep-Sea Res. Part A 1990, 37, 1909–1926. [Google Scholar]
- Tang I. N.; Munkelwitz H. R. Aerosol Sci. Technol. 1991, 15, 201–207. [Google Scholar]
- Tang I. N.; Munkelwitz H. R.; Wang N. J. Colloid Interface Sci. 1986, 114, 409–415. [Google Scholar]
- Cappa C. D.; Drisdell W. S.; Smith J. D.; Saykally R. J.; Cohen R. C. J. Phys. Chem. B 2005, 109, 24391–24400. [DOI] [PubMed] [Google Scholar]
- Cappa C. D.; Smith J. D.; Drisdell W. S.; Saykally R. J.; Cohen R. C. J. Phys. Chem. C 2007, 111, 7011–7020. [Google Scholar]
- Smith J. D.; Cappa C. D.; Drisdell W. S.; Cohen R. C.; Saykally R. J. J. Am. Chem. Soc. 2006, 128, 12892–12898. [DOI] [PubMed] [Google Scholar]
- Drisdell W. S.; Saykally R. J.; Cohen R. C. Proc. Natl. Acad. Sci. U. S. A. 2009, 106, 18897–18901. [DOI] [PMC free article] [PubMed] [Google Scholar]
- Drisdell W. S.; Saykally R. J.; Cohen R. C. J. Phys. Chem. C 2010, 114, 11880–11885. [Google Scholar]
- Widmann J. F.; Davis E. J. J. Aerosol Sci. 1997, 28, 1233–1249. [Google Scholar]
- Wagner P. E. J. Colloid Interface Sci. 1985, 105, 456–467. [Google Scholar]
- Lathem T. L.; Nenes A. Aerosol Sci. Technol. 2011, 45, 604–615. [Google Scholar]
- Moore R. H.; Raatikainen T.; Langridge J. M.; Bahreini R.; Brock C. A.; Holloway J. S.; Lack D. A.; Middlebrook A. M.; Perring A. E.; Schwarz J. P.; et al. Environ. Sci. Technol. 2012, 46, 3093–3100. [DOI] [PubMed] [Google Scholar]
- Nenes A.; Chuang P. Y.; Flagan R.; Seinfeld J. H. J. Geophys. Res.-Atmos. 2001, 106, 3449–3474. [Google Scholar]
- Miles R. E. H.; Walker J. S.; Burnham D. R.; Reid J. P. Phys. Chem. Chem. Phys. 2012, 14, 3037–3047. [DOI] [PubMed] [Google Scholar]
- Knox K. J.; Reid J. P. J. Phys. Chem. A 2008, 112, 10439–10441. [DOI] [PubMed] [Google Scholar]
- Qu X.; Davis E. J. J. Aerosol Sci. 2001, 32, 861–875. [Google Scholar]
- Qu X.; Davis E. J.; Swanson B. D. J. Aerosol Sci. 2001, 32, 1315–1339. [Google Scholar]
- Drisdell W. S.; Cappa C. D.; Smith J. D.; Saykally R. J.; Cohen R. C. Atmos. Chem. Phys. 2008, 8, 6699–6706. [Google Scholar]
- Garrett B. C.; Schenter G. K.; Morita A. Chem. Rev. 2006, 106, 1355–1374. [DOI] [PubMed] [Google Scholar]
Associated Data
This section collects any data citations, data availability statements, or supplementary materials included in this article.