Abstract
Using a microfluidic cell volume sensor we measured the change in the cell volume of Madin-Darby Canine Kidney (MDCK) cells induced by shear stress. An increase in shear stress from 0.2 to 2.0 dyn/cm2 resulted in a volume decrease to a steady state volume ~ 20 – 30 % smaller than the initial resting cell volume. Independent experiments based on fluorescence quenching confirmed the volume reduction. This shear-induced cell shrinkage was irreversible on the time scale of the experiment (~ 30 min). Treatment of 0.1 μM Hg2+ significantly inhibited the volume decrease, suggesting that the shear-induced cell shrinkage is associated with water efflux through aquaporins. The volume decrease cannot be inhibited by 75 mM TEA, 100 μM DIDS, or 100 μM Gd3+ suggesting that volume reduction is not directly mediated by K+ and Cl− channels that typically function during regulatory volume decrease (RVD), nor is it through cationic stretch-activated ion channels (SACs). The process also appears to be Ca2+ independent because it was insensitive to intracellular Ca2+ level. Since cell volume is determined by the intracellular water content, we postulate that the shear induced reductions in cell volume may arise from increased intracellular hydrostatic pressure as the cell is deformed under flow, which promotes the efflux of water. The increase in internal pressure in a deformable object under the flow is supported by the finite element mechanical model.
Keywords: Cell volume, Flow shear stress, MDCK, Impedance-based sensor
Introduction
Renal epithelial cells are exposed to a broad range of shear stresses due to the change in urinary flow under physiological and pathological conditions. Flow shear stress can affect the physiological behavior of renal tubule cells by altering ion channel activity [1, 2], organization of cytoskeleton [3–5], gene expression [6], or transcription factors [4]. Thus, sensing and responding to shear stress is an important function of epithelial cells.
Flow induced changes in ion transport have been observed with patch-clamp recording [1, 7]. Increases in shear stress cause Ca2+ influx in many cell types [8–11] and that activates a cascade of signal pathways affecting biochemical reactions and ion transport [12]. Flow-dependent Ca2+-activated K+ channels are postulated to account for the increase of K+ secretion under flow in the rabbit connecting tubule (CNT) [1] and cortical collecting ducts (CCD) [13, 14]. Shear stress might also activate stretch-activated ion channels (SACs) by creating gradients in membrane tension [15]. It has been recently reported that SACs are responsive to both shear stress and osmotic swelling [16, 17]. Since the influx or efflux of osmolytes from cells is accompanied by the water transport, effect of shear stress on membrane transport will cause the changes in cell volume. In addition, cell volume could also be changed by shear stress induced change in cell shape that promotes the efflux of water. Simple mechanics predicts that shear stress can introduce an increase in intracellular pressure due to cell deformation and that pressure will increase the efflux of water. These may result in changes in solute concentration and also in cytoplasmic stress with its biochemical consequences [18, 19].
Using the cell volume sensor based on an impedance measurement [20], we observed that cell volume decreases in response to increased flow shear stress. The change in the cell volume was only partly reversible within the experimental duration of ~ 1hr, suggesting that the cell structure had been altered during shear stress application. The shear-induced volume reduction was inhibited by Hg2+ suggesting the involvement of water efflux. Pharmacological blocking tests revealed that the volume changes did not utilize Ca2+-activated signaling pathways, K+ or Cl− channels, Na+-H exchange or SACs. Finite element analysis results suggest that the decrease in cell volume by shear stress could be attributed to the compressive stress inside the cells that changes the cell shape and enhances water efflux.
Materials and Methods
Solution preparation
Hypotonic solution (168 mOsm) consisted of 75 mM NaCl, 5 mM KCl, 2 mM MgCl2, 1 mM CaCl2 with 10 mM HEPES at pH 7.4. Isotonic (320 mOsm) solution was prepared by adding mannitol to the hypotonic solution. This isotonic solution was lightly titrated with NaCl to have the same conductivity as the hypotonic solution. This titration step added less than 0.1 mM NaCl to the isotonic solution. The osmolarity was measured using an osmometer (Advanced Model 303, Advanced Instrument, Norwood, MA). Drug solutions of 10 mM of 4,4′-diisothiocyanatostilbene-2,2′-disulfonic acid (DIDS) and 100 mM amiloride solutions were prepared in DMSO and stored in the freezer. A 10 μM stock of HgCl2 solution was prepared in isotonic solution and further diluted to 0.1 μM for experiments. Gadolinium chloride was prepared as a 10 mM stock solution in water. The solution of 5-(N,N-dimethyl)amiloride hydrochloride was prepared in isotonic saline and 75 mM tetraethylammonium (TEA) chloride solution was prepared in isotonic solution by replacing NaCl.
Cell culture
Microscope slides were cut to ~22 mm × 13 mm to fit on the sensor chip and cleaned as previously described [21]. MDCK cells (ATCC) were grown to confluence on the slide in a 35 mm Petri dish using Dulbecco’s Modified Eagle’s Medium (DMEM) containing 10% fetal bovine serum and 1% penicillin-streptomycin. It took 4–6 days to grow the cells to confluence. The cell passage number was between 5 and 35. Cells showed good adhesion on the glass surface without specialized coatings.
Measurement of cell volume change using cell volume sensor
The cell volume sensor was described in our previous paper [20]. It measures the real part of the (extracellular) impedance of a thin flow chamber of fixed volume containing the cells. An increase in cell volume appears as an increase in extracellular resistance. A slide with attached cells was inverted over the sensor so that cells faced the chamber. The sensing chamber was 1.5 mm wide, 2.5 mm long, and 18 or 24 μm thick and contained an evaporated four-electrode Pt array deposited on the surface by e-beam deposition. The chamber resistance was measured by supplying a constant current (100 Hz, 200 nA) to the outer pair of electrodes, while measuring the voltage between the inner pair with phase-lock detection [20]. Since the impedance of the cell membrane is high at these frequencies, the change of resistance represents the change of cell volume [20, 22]. The solution flow rate was controlled using a syringe pump (PHD 22/2200, Harvard Apparatus, Holliston, MA). The data was plotted as the ratio of cell volume change to the resting cell volume as previously described [20, 21, 23]. To measure the resistance of the empty chamber, after an experiment was finished the chamber was perfused with a detergent (1% Triton X-100) to permeabilize the cells and the chamber was then rinsed with isotonic solution. The resistance (or voltage) in the sensing chamber was then defined as Vempty. The ratio of the cell volume change to the resting volume at time t can be approximated as:
| (1) |
where, ΔCV is cell volume change, CVo is resting cell volume, Vt is the voltage measured in the chamber at time t, and Vo is the initial voltage (chamber resistance with resting cells) in isotonic solution.
As a control, cells were fixed with 4 % paraformaldehyde for 10 min and treated with 0.1 % Triton X-100 solution for 5 min to remove the membranes. After the fixed cells were rinsed with isotonic solution, we examined whether there was any artifactual signal that could be interpreted as a change of cell volume with shear stress and found no significant change. We display raw data for this measurement because the fixed cells could not be removed from the sensing chamber to measure Vempty. To observe a change in the cell morphology, we recorded micrographs of the cells while collecting cell volume data using an upright microscope (Zeiss) equipped with a 10x objective and CCD camera.
Measurement of volume change using fluorescence concentration quenching [24]
To check out our method against published methods we also measured volume changes using fluorescence quenching. This method measures concentration-dependent quenching of intracellular calcein [24]. MDCK cells were grown to confluence and after rinsing with isotonic solution, they were incubated with isotonic solution containing 4 μM of calcein-AM (Invitrogen, Carlsbad, CA). To calibrate the sensitivity of the dye to cell volume changes, we exposed the cells to hypotonic and hypertonic solutions and monitored the fluorescence intensity. After we confirm that changes of cell volume caused the change of the fluorescence intensity, we examined the change in the cell volume under shear stress by using fluorescence. The relative fluorescence intensity was calculated using the following equation (Eqn. 2).
| (2) |
where Irel is relative fluorescence intensity change, It is fluorescence intensity at time t, IBk is background fluorescence intensity, and Io is fluorescence intensity at t=0.
Intracellular Ca2+ measurement
Cells were loaded with 6 μM Fluo-4 AM (Invitrogen, Carlsbad, CA) in isotonic solution for 30 min in an incubator. The cells were then rinsed with isotonic solution and incubated for another 10 min. The slide was mounted on the sensor and we collected fluorescence micrographs. Time-lapse experiments were recorded using AxioVision software (Zeiss).
Finite element analysis
We built a simple 2D model and calculated the intracellular stress distribution under flow using finite element analysis (ANSYS/CFX, ANSYS Inc.). The model consists of a flow chamber having the same dimensions as the sensor and a deformable elastic cell attached to the bottom of the chamber. The model had steady flow with non-slip boundary conditions and we used two-way coupling of fluid-structure interaction method. The fluid domain was calculated by ANSYS/CFX, and the deformable cell domain was analyzed by ANSYS. The flow domain and cell domain were coupled through continuity boundary condition for displacement, traction, and velocity at the fluid-cell interface.
Shear stress calculation
We used two microfluidic sensors with different channel heights of 18 and 24 μm. Unless otherwise noted, the experiments were conducted using a device with 24 μm channel height. Assuming confluent cells form a planar sheet, the wall shear stress τ was calculated using [25]:
| (3) |
here μ is viscosity, Q is volume flow rate, w is channel width, and d is channel height, respectively. Viscosity was assumed to be 1.0 × 10⁻³ Pa s.
Results
Shear stress induced decrease in cell volume
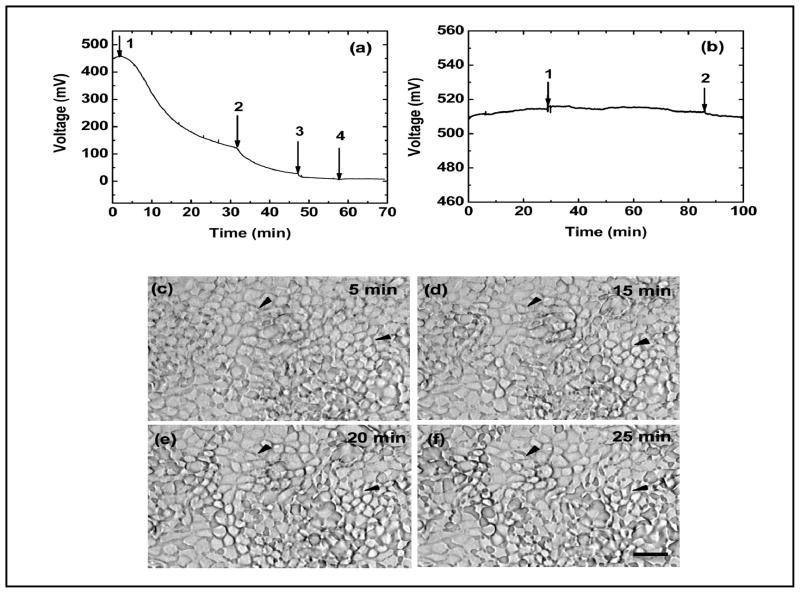
We initially measured the change of MDCK cell volume with stepwise increases in the flow rate using a sensor with an 18 μm high channel. The cells were first exposed to low shear at 0.1 μl/min (0.2 dyn/cm2) until the signal stabilized. We did not observe any noticeable Ca2+ response at this flow rate using the same chamber. We then increased the flow rate to 1, 5, 7.5, and 10 μl/min corresponding to shear stress of 2.0, 10, 15, and 20 dyn/cm2, and followed the changes of cell volume (Fig. 1a). Fig. 1a shows that a stepwise increase in the flow rate (0.1 to 1 μl/min) caused the cells to rapidly shrink indicating a loss of intracellular water. A successive increase from 1 μl/min (2.0 dyn/cm2) to 10 μl/min (20 dyn/cm2) resulted in further decreases, eventually reaching a steady state volume approximately 30% smaller than the original volume.
Fig. 1.
(a) Resistance measurement of the sensor showing a change in the MDCK volume in response to shear flow. The arrows indicate an increase of flow rate from 0.1 μl/min (0.2 dyn/cm2) to 1: 1.0 μl/min (2.0 dyn/cm2); 2: 5.0 μl/min (10 dyn/cm2); 3: 7.5 μl/min (15 dyn/cm2); 4: 10.0 μl/min (20 dyn/cm2). The overall decrease of cell volume ranged from 10 to 30 % from steady state. (b) Fixed cells do not respond to shear stress. The arrows in (b) indicate change of shear stress from 0.2 to 2.0 and return to 0.2 dyn/cm2, respectively. (c)–(f) Corresponding optical micrographs of cells obtained during the volume measurement in (a) at 5, 15, 20, and 25 min, respectively. There was no noticeable loss of cells from the chamber, but large changes in the cell morphology and widened intracellular gaps (two examples are indicated by black arrows). The scale bar is 10 μm.
The flow-dependent volume decrease is not an artifact due to the loss of cells from the sensing chamber. We collected optical micrographs every minute during the course of the measurement. Figures 1c–f are micrographs of the cells obtained at 5, 15, 20, and 25 min in Fig. 1a, showing that MDCK cells were not detached from the surface for shear of 0.2 – 2.0 dyn/cm2. However, shear stress caused large changes in cell morphology at 2.0 dyn/cm2, as indicated by the wide intercellular gaps (this was a widespread phenomenon, two examples were indicated by black arrows in Fig. 1c–f). This data supports the view that the decrease in mean cell volume arose from cell shrinkage, not the loss of cells.
We tested whether a change in flow rate (perfusion pressure) caused the chamber height to increase, which would be interpreted as a reduction in cell volume. There was no significant change in the signal in empty chambers containing fixed and permeabilized MDCK cells when the flow rate was increased (Fig. 1b).
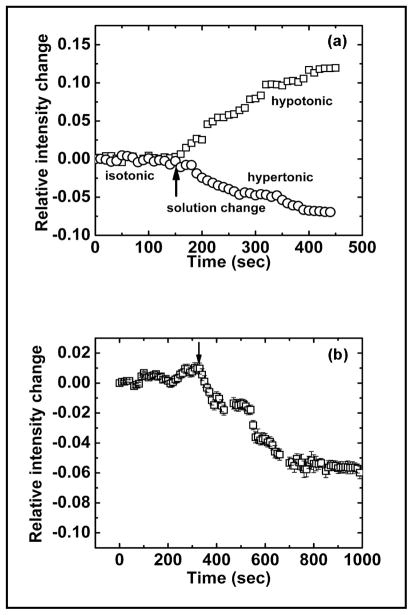
To confirm the effects of shear stress we double checked the data using the fluorescence quenching assay. We first examined whether the fluorescence was sensitive to anisotonic challenges. After stabilized in isotonic solution, the cells were exposed to 168 mOsm solution causing the cells to swell, while a 429 mOsm solution causing the cells to shrink. Figure 2a shows mean of relative fluorescence intensity from ten different locations, extracted from the time-lapse images. As shown in Fig. 2a, cell swelling increases the fluorescence intensity of calcein due to the reduced quenching and cell shrinkage decreased the intensity. We then applied shear stress to cells loaded with calcein and Fig. 2b shows the average intensity from ten different locations in a population of cells. The error bar indicates the standard deviation of ten measurements. When the shear stress increased from 0.7 to 7.0 dyn/cm2, as indicated by the arrow, the fluorescence intensity significantly decreased showing that the shear stress caused cell shrinkage supporting our earlier sensor data.
Fig. 2.
Volume change measured with fluorescence quenching. (a) The change of cell volume in response to hypotonic and hypertonic perfusion. (b) The change of cell volume in response to shear stress. Both data sets were obtained from fluorescence micrographs of MDCK cells loaded with 4 μM calcein. The arrows in (a) indicates the solution change from isotonic (320 mOsm) to hypotonic (168 mOm) or hypertonic solution (429 mOsm). The arrow in (b) indicates the change of the shear stress from 0.7 to 7.0 dyn/cm2. The plot in (b) is the average of relative intensity changes obtained from ten different locations in each of the micrographs. The error bar indicates the standard deviation.
Hg2+ inhibits the shear-induced volume shrinkage
To examine whether the volume decrease is a result of water transport via aquaporins (AQPs), we treated cells with 0.1 μM HgCl2 and then measured the volume change under shear stress. Fig. 3 shows that Hg2+ significantly inhibited the shear-induced volume decrease. This suggests that the water transport via AQPs is involved with the cell shrinkage during shear stress. AQP2 and AQP3 are endogenously expressed in kidney epithelial cells [26] and low level of AQP2, 3 has been observed in wild type MDCK cells [27, 28]. Hg2+ blocks the water permeability of both AQP2 and 3, but lack the blocking effect on AQP4 [23, 29]. While cell shrinkage must be linked with loss of water regardless of mechanism, APQs can affect the kinetics of volume change. The slight increase in cell volume we saw at later times suggests that Hg2+, probably through non-specific effects, may have relaxed the stress in the cytoskeleton by inhibiting myosin, or increased the cell permeability to external salts such as NaCl [21, 30–32].
Fig. 3.
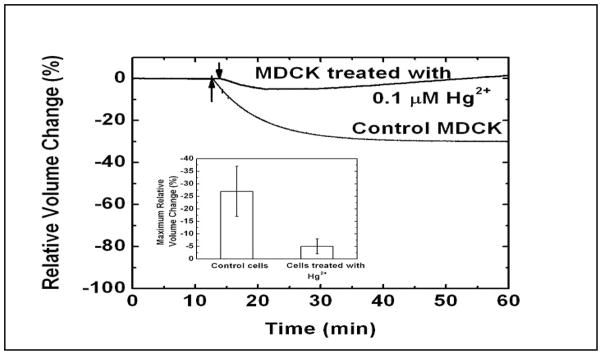
Volume response of cells to shear stress after mercurial treatment. The MDCK cells were treated with 0.1 μM HgCl2 for 1 min followed by rinsing with isotonic solution. The volume change of the cells under shear stress was measured using the volume sensor. The arrows indicate the change of shear stress from 0.2 to 2.0 dyn/cm2. The graph insert shows the maximum relative volume change of control cells (n=3) and cells treated with HgCl2 (n=4). The error bar indicates the standard deviation. The cells treated with Hg2+ showed less cell volume reduction than the control cells suggesting that AQPs were involved.
Slow recovery of flow-dependent shrunken cells
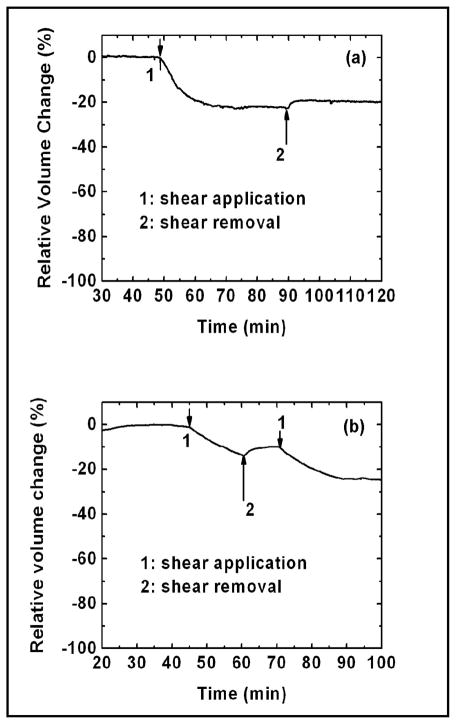
If water is the only molecule released from the cells by shear stress, cells might be expected to return to their initial volume when the shear stress is removed. However, if the cell anatomy changes, the local stress changes will correlate with osmotic pressure changes [18] and the recovery of cell volume may be delayed or never achieved. Similarly, changes in solute concentration during the change in shape would lead to a delayed recovery. Figure 4a shows a plot of relative cell volume over relatively a long period of time. The cell volume decreased by ~30% in response to an increase of shear stress from 0.2 to 2 dyn/cm2 as indicated by arrow ‘1’ in Fig. 4(a). When the shear stress was removed (as indicated by the arrow ‘2’), the cell volume only partially recovered over the duration of the experiment. The removal of shear stress during the cell volume decrease partially recovered the cell volume (Fig. 4(b)).
Fig. 4.
Volume response to reversible steps in shear stress amplitude showing that the cellular response to shear stress is irreversible on a scale of 30 min. The arrows in (a) and (b) indicate the change of shear stress (1: from 0.2 to 2.0 dyn/cm2 and 2: from 2.0 to 0.2 dyn/cm2). Removing high shear stress did not restore the reduced cell volume to the initial value (a).
The shear-induced volume decrease does not involve Ca2+ activated pathways
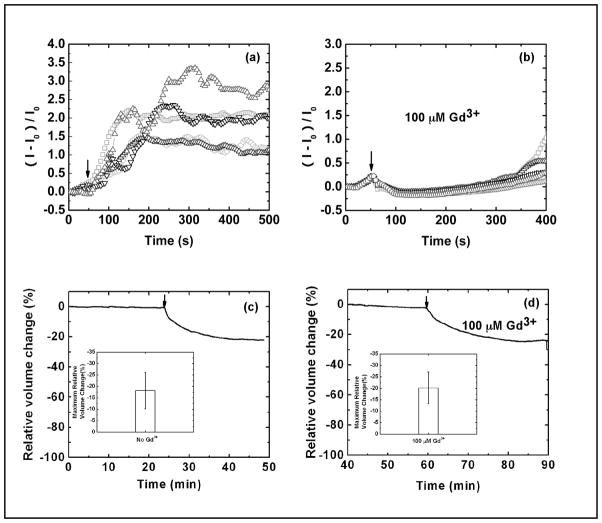
Using the Ca2+-sensitive dye, Fluo 4, we investigated the role of Ca2+ in the flow-dependent decrease in cell volume. A stepwise change of stress from 0.5 to 5.5 dyn/cm2 caused a transient increase in Ca2+ (Fig. 5a) and a decrease in cell volume (Fig. 5c). We applied 100 μM Gd3+, a known inhibitor for non-selective stretch-activated-channels (SACs) [33, 34], to block the Ca2+ entry via SACs. Gd3+ completely blocked the shear-induced Ca2+ entry (Fig. 5b), but it did not affect the shear-induced cell shrinkage (Fig. 5d). These data suggest that the effect of shear stress on cell volume is not associated with Ca2+-activated signal pathways nor with SACs.
Fig. 5.
Effects of shear stress on intracellular Ca2+ and volume showing that the cell volume decrease under the shear stress is Ca2+ independent. (a) The Ca2+ increase in response to a stepwise rise of shear stress from 0.5 to 5.5 dyn/cm2. (b) The flow-induced Ca2+ uptake is blocked by 100 μM Gd3+. Multiple regions in the chamber are measured and plotted in (a) and (b). (c) Cell volume response to an increase in isotonic shear stress from 0.2 to 2.0 dyn/cm2. (d) Volume response to shear stress in the presence of 100 μM of Gd3+ showing Gd3+ does not inhibit the flow induced cell shrinkage. The arrow indicates the change of flow rate. The inserted graphs in (c) and (d) show the average of maximum relative cell volume change obtained from three independent experiments. The error bar indicates the standard deviation.
The role of ion channels in shear-induced shrinkage of cells
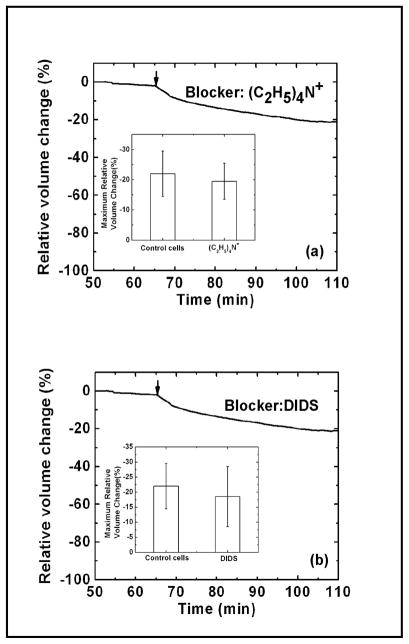
Although renal epithelium has a high intracellular K+, to maintain electroneutrality the efflux of K+ must be paralleled by the efflux of Cl− or other anion so transport of KCl could occur via a pair of commonly available ion channels. Large-conductance K+ channels (maxi-K) have been detected in the apical membrane of MDCK cells [35, 36]. These channels can be activated by membrane depolarization, increases in intracellular Ca2+ concentration, or membrane stretch [13, 37–39]. To test the role of K+ channels we measured the volume response to shear stress in the presence of 75 mM tetraethylammonium (TEA), a known K+ channel blocker [40]. As shown in Fig. 6a, substituting NaCl with TEA (75 mM) did not eliminate the shear-induced shrinkage. This result suggests that K+ channels do not play a major role. A Cl− channel blocker, 100 μM DIDS, also had no effect on shrinkage (Fig. 6b). In addition, neither amiloride, an ENaC inhibitor, nor dimethyl amiloride, a Na+-H+-exchange (NHE) inhibitor showed any effect (data not shown). Our data using pharmacologic blockers suggests that cell shape (cytoskeletal stress), not solute permeability, is the key player in shear-induced decrease in the cell volume.
Fig. 6.
Cell volume response to flow shear stress in the presence of 75 mM TEA (a) and 100 μM DIDS (b) showing that the cell volume decrease in response to shear stress is not likely to be mediated via K+ and Cl− channels. The arrow indicates the change of shear stress from 0.2 to 2.0 dyn/cm2. The inserted graphs in (a) and (b) show the average of maximum relative cell volume change obtained from three independent experiments in controls and in the presence of TEA and DIDS, respectively.
Numerical modeling of intracellular stress
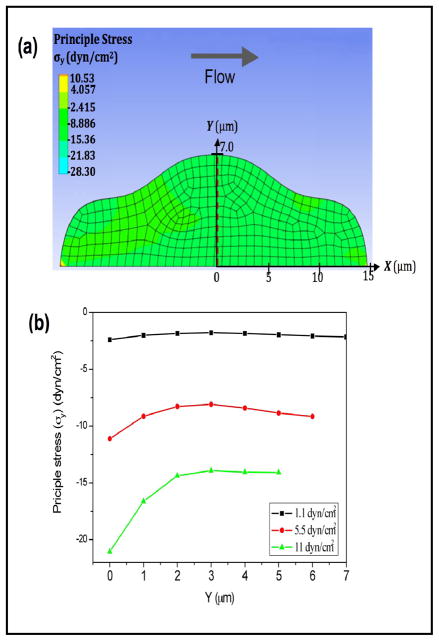
To estimate the influence of flow on intracellular pressure, we built a model of a cell in a flow chamber and calculated the distribution of internal stress using CFD software. The cell was defined as a deformable object with a Young’s modulus of 450 Pa [41]. As shown in Fig. 7a, a flow rate of 5 μl/min (5.5 dyn/cm2) produces a compression in the direction vertical to the bottom surface (Fig. 7b), indicating an increase in intracellular pressure. An increase in the flow rate enhances the intracellular compression (Fig. 7b). The simulation result suggests that flow induces a decrease in cell volume as a result of compressive stress that raises intracellular hydrostatic pressure.
Fig. 7.
(a) 2D simulation of the stress distribution in a deformable cell under shear stress (arrow) showing a compression in the transverse direction to flow. The cell modulus was 450 Pa; the flow rate was 5 μl/min (5.5 dyn/cm2). (b): Stress distribution along the y-direction (from basal to apical surface) at the center plane indicated by red dashed line in (a) at shear stresses of 1.1 (black), 5.5 (red) and 11 (green) dyn/cm2, showing an increase in compression with increased flow.
Discussion
We report for the first time that cells shrink when subjected to an increase in shear stress. Fluorescence quenching supports the results obtained by the volume sensor. Since cell volume is determined by water content, our results indicate that the shear stress must modulate the water content of the cell. It has been previously reported that AQP2 and 3 are endogenously expressed in kidney epithelium [26] and the water transport via AQP2 and 3 can be irreversibly blocked by Hg2+ [23, 29]. If the shear-induced cell shrinkage involves the water transport, the blocking of AQPs should inhibit the rate of relaxation of cell volume but cannot affect the endpoints since AQPs are catalysts, not sources of free energy. As shown in Fig. 3, 0.1 μM HgCl2 blocked the volume decrease during the shear-stress application suggesting the shear-induced cell shrinkage involves the water transport and AQPs may contribute to the transport of water. The slight increase in volume at later times may have arisen from penetration of Hg2+ since Hg2+ is known to diffuse into cells under stretch causing excessive cell swelling [21].
While the volume decrease could be driven by the loss of solutes through flow-activated pathways, we could show that several common channels were not involved. Flow shear stress affects Ca2+-activated K+ channels known to be blocked by TEA or quinidine [36] and possibly SACs [16, 37, 42, 43]. The flow-induced volume decrease might result from the solute movement but there must be anionic and cationic channels active so that the net charge of transferred solutes is neutral [18, 43]. Previously, large-conductance K+ channels (maxi-K) have been identified in MDCK cells and known to be blocked by TEA or quinidine [36]. Our data shows that flow-induced volume decrease could not be blocked by K+ channel blocker (TEA) nor Cl− channel blocker (DIDS) (Fig. 6), suggesting that maxi-K+ channel was not the major source for the volume decrease. Na+-H+ exchanger blockade did not prevent the cell shrinkage by shear stress (data not shown), eliminating the involvement of exchanger in shear-induced release of solutes.
SACs exhibit mechanosensitivity to both osmotic swelling and fluid shear stress [16, 17] and may contribute to RVD in some cell types [44, 45]. These channels are endogenously expressed in all cell types including renal epithelial cells, notably in the distal nephron and collecting ducts [17, 46, 47]. Since 100 μM Gd3+ was not able to inhibit the volume decrease by shear flow, while it did inhibit the regulatory volume decrease following osmotic stimuli [48], it is likely that MDCK cells do not use the same channels for mediating flow-induced volume change. Based on the lack of effect of ion channel blockers on shear-induced shrinkage (Fig. 6a,b) and the slow recovery of cell volume (Fig. 4a,b) we suspect that the shear stress effects on cell volume arise from flow-induced changes in cell shape or equivalently changes in cytoskeletal stress. This change in cell shape would significantly raise intracellular hydrostatic pressure resulting in an efflux of water. Our sensor measures changes in the volume of a population cells as defined by the volume enclosed by the plasma membrane. Modeling the cell as a deformable object, finite element calculations show that the internal compressive stresses rise as the cell is deformed. This indicates an increase in pressure within the cell. Given that the water flux across the membrane is driven by both osmotic and hydrostatic pressure, we suggest that the initial water efflux in response to the flow can be driven by internal pressure in parallel with solute transport. Changes in cell shape involve both passive and active changes in cytoskeletal structure. Because the changes in cross-linking take time to relax [49], the elimination of flow shear stress will not restore the shrunken cells to their initial volume in a short period of time as shown in Fig. 4a and 4b. Alternatively, but not exclusively, there may be some loss of intracellular solutes that are not contained in the perfusion solution so the cells could never return to their starting volume. In summary, flow shear causes cells, MDCKs in particular, to shrink and the shrunken cells do not recover over a period of 30 min after the removal of the flow. The volume change is the result of water transport across the membrane possibly driven by hydrostatic pressure.
Acknowledgments
This work is supported by grants from the National Institute of Diabetes and Digestive and Kidney Diseases Grant DK77302, and NIHLBI to (F.S).
References
- 1.Taniguchi J, Imai M. Flow-dependent activation of maxi K+ channels in apical membrane of rabbit connecting tubule. J Membr Biol. 1998;164:35–45. doi: 10.1007/s002329900391. [DOI] [PubMed] [Google Scholar]
- 2.Satlin LM, Sheng S, Woda CB, Kleyman TR. Epithelial Na+ channels are regulated by flow. Am J Physiol Renal Physiol. 2001;280:F1010–1018. doi: 10.1152/ajprenal.2001.280.6.F1010. [DOI] [PubMed] [Google Scholar]
- 3.Duan Y, Gotoh N, Yan Q, Du Z, Weinstein AM, Wang T, Weinbaum S. Shear-induced reorganization of renal proximal tubule cell actin cytoskeleton and apical junctional complexes. Proc Natl Acad Sci USA. 2008;105:16483–16488. doi: 10.1073/pnas.0804954105. [DOI] [PMC free article] [PubMed] [Google Scholar]
- 4.Essig M, Terzi F, Burtin M, Friedlander G. Mechanical strains induced by tubular flow affect the phenotype of proximal tubular cells. Am J Physiol Renal Physiol. 2001;281:F751–F762. doi: 10.1152/ajprenal.2001.281.4.F751. [DOI] [PubMed] [Google Scholar]
- 5.Wang J, Heo J, Hua SZ. Spatially resolved shear distribution in microfluidic chip for studying force transduction mechanisms in cells. Lab Chip. 2010;10:235–239. doi: 10.1039/b914874d. [DOI] [PMC free article] [PubMed] [Google Scholar]
- 6.Kaysen JH, Campbell WC, Majewski RR, Goda FO, Navar GL, Lewis FC, Goodwin TJ, Hammond TG. Select de novo gene and protein expression during renal epithelial cell culture in rotating wall vessels is shear stress dependent. J Membr Biol. 1999;168:77–89. doi: 10.1007/s002329900499. [DOI] [PubMed] [Google Scholar]
- 7.Carattino MD, Sheng S, Kleyman TR. Epithelial Na+ channels are activated by laminar shear stress. J Biol Chem. 2004;279:4120–4126. doi: 10.1074/jbc.M311783200. [DOI] [PubMed] [Google Scholar]
- 8.Jensen ME, Odgaard E, Christensen MH, Praetorius HA, Leipziger J. Flow-induced [Ca2+]i increase depends on nucleotide release and subsequent purinergic signaling in the intact nephron. J Am Soc Nephrol. 2007;18:2062–2070. doi: 10.1681/ASN.2006070700. [DOI] [PubMed] [Google Scholar]
- 9.Liu W, Xu S, Woda C, Kim P, Weinbaum S, Satlin LM. Effect of flow and stretch on the [Ca2+]i response of principal and intercalated cells in cortical collecting duct. Am J Physiol. 2003;285:F998–F1012. doi: 10.1152/ajprenal.00067.2003. [DOI] [PubMed] [Google Scholar]
- 10.Mo M, Eskin SG, Schilling WP. Flow-induced changes in Ca2+ signaling of vascular endothelial cells: Effect of shear stress and atp. American Journal of Physiology Heart Circulation Physiology. 1991;260:H1698–H1707. doi: 10.1152/ajpheart.1991.260.5.H1698. [DOI] [PubMed] [Google Scholar]
- 11.Schwartz G, Callewaert G, Droogmans G, Nilius B. Shear stress induced calcium transients in endothelial cells from human umbelical cord veins. J Physiol (Camb) 1992;458:527–538. doi: 10.1113/jphysiol.1992.sp019432. [DOI] [PMC free article] [PubMed] [Google Scholar]
- 12.Quinlan MR, Docherty NG, Watson RW, Fitzpatrick JM. Exploring mechanisms involved in renal tubular sensing of mechanical stretch following ureteric obstruction. Am J Physiol Renal Physiol. 2008;295:F1–F11. doi: 10.1152/ajprenal.00576.2007. [DOI] [PubMed] [Google Scholar]
- 13.Woda CB, Bragin A, Kleyman TR, Satlin LM. Flow-dependent K+ secretion in the cortical collecting duct is mediated by a maxi-k channel. Am J Physiol Renal Physiol. 2001;49:F786–793. doi: 10.1152/ajprenal.2001.280.5.F786. [DOI] [PubMed] [Google Scholar]
- 14.Liu W, Morimoto T, Woda C, Kleyman TR, Satlin LM. Ca2+ dependence of flow-stimulated k secretion in the mammalian cortical collecting duct. Am J Physiol Renal Physiol. 2007;293:F227–235. doi: 10.1152/ajprenal.00057.2007. [DOI] [PubMed] [Google Scholar]
- 15.Markin VS, Sachs F. Thermodynamics of mechanosensitivity. Physical Biology. 2004;1:110–124. doi: 10.1088/1478-3967/1/2/007. [DOI] [PubMed] [Google Scholar]
- 16.Wu L, Gao X, Brown RC, Heller S, O’Neil RG. Dual role of the trpv4 channel as a sensor of flow and osmolality in renal epithelial cells. Am J Physiol Renal Physiol. 2007;293:F1699–1713. doi: 10.1152/ajprenal.00462.2006. [DOI] [PubMed] [Google Scholar]
- 17.O’Neil RG, Heller S. The mechanosensitive nature of trpv channels. Pflugers Arch. 2005;451:193–203. doi: 10.1007/s00424-005-1424-4. [DOI] [PubMed] [Google Scholar]
- 18.Spagnoli C, Beyder A, Besch S, Sachs F. Atomic force microscopy analysis of cell volume regulation. Phys Rev E Stat Nonlin Soft Matter Phys. 2008;78:031916. doi: 10.1103/PhysRevE.78.031916. [DOI] [PMC free article] [PubMed] [Google Scholar]
- 19.Johnson CP, Tanbg HY, Carag C, Speicher D, Discher DE. Forced unfolding of proteins within cells. Science. 2007 doi: 10.1126/science.1139857. [DOI] [PMC free article] [PubMed] [Google Scholar]
- 20.Ateya DA, Sachs F, Gottlieb PA, Besch S, Hua SZ. Volume cytometry: Microfluidic sensor for high-throughput screening in real time. Anal Chem. 2005;77:1290–1294. doi: 10.1021/ac048799a. [DOI] [PubMed] [Google Scholar]
- 21.Heo J, Meng F, Sachs F, Hua SZ. Dynamic effects of Hg2+-induced changes in cell volume. Cell Biochem Biophys. 2008;51:21–32. doi: 10.1007/s12013-008-9010-y. [DOI] [PMC free article] [PubMed] [Google Scholar]
- 22.Fricke H. A mathematical treatment of the electrical conductivity of colloids and cell suspensions. J Gen Physiol. 1924;6:375–384. doi: 10.1085/jgp.6.4.375. [DOI] [PMC free article] [PubMed] [Google Scholar]
- 23.Heo J, Meng F, Hua SZ. Contribution of aquaporins to cellular water transport observed by a microfluidic cell volume sensor. Anal Chem. 2008;80:6974–6980. doi: 10.1021/ac8008498. [DOI] [PMC free article] [PubMed] [Google Scholar]
- 24.Hamann S, Kiilgaard JF, Litman T, Alvarez-Leefmans FJ, Winther BR, Zeuthen T. Measurement of cell volume changes by fluorescence self-quenching. Journal of Fluorescence. 2002;12:139–145. [Google Scholar]
- 25.Fox RW, McDonald AT. Introduction to fluid mechanics. 4. New York: J. Wiley; 1992. [Google Scholar]
- 26.Baum MA, Ruddy MK, Hosselet CA, Harris HW. The perinatal expression of aquaporin-2 and aquaporin-3 in developing kidney. Pediatr Res. 1998;43:783–790. doi: 10.1203/00006450-199806000-00011. [DOI] [PubMed] [Google Scholar]
- 27.Yui N, Lu HJ, Bouley R, Brown D. Aqp2 is necessary for vasopressin- and forskolin-mediated filamentous actin depolymerization in renal epithelial cells. Biology Open. 2012;1:101–108. doi: 10.1242/bio.2011042. [DOI] [PMC free article] [PubMed] [Google Scholar]
- 28.Matsuzaki T, Suzuki T, Takata K. Hypertonicity-induced expression of aquaporin 3 in mdck cells. American Journal of Physiology - Cell Physiology. 2001;281:C55–C63. doi: 10.1152/ajpcell.2001.281.1.C55. [DOI] [PubMed] [Google Scholar]
- 29.Meinild AK, Klaerke DA, Zeuthen T. Bidirectional water fluxes and specificity for small hydrophilic molecules in aquaporins 0–5. J Biol Chem. 1998;273:32446–32451. doi: 10.1074/jbc.273.49.32446. [DOI] [PubMed] [Google Scholar]
- 30.Vassallo DV, Moreira CM, Oliveira EM, Bertollo DM, Veloso TC. Effects of mercury on the isolated heart muscle are prevented by dtt and cysteine. Toxicol Appl Pharmacol. 1999;156:113–118. doi: 10.1006/taap.1999.8636. [DOI] [PubMed] [Google Scholar]
- 31.Ballatori N, Boyer JL. Disruption of cell volume regulation by mercuric chloride is mediated by an increase in sodium permeability and inhibition of an osmolyte channel in skate hepatocytes. Toxicol Appl Pharmacol. 1996;140:404–410. doi: 10.1006/taap.1996.0237. [DOI] [PubMed] [Google Scholar]
- 32.Rothstein A, Mack E. Actions of mercurials on cell volume regulation of dissociated mdck cells. Am J Physiol. 1991;260:C113–121. doi: 10.1152/ajpcell.1991.260.1.C113. [DOI] [PubMed] [Google Scholar]
- 33.Yang XC, Sachs F. Block of stretch-activated ion channels in xenopus oocytes by gadolinium and calcium ions. Science. 1989;243:1068–1071. doi: 10.1126/science.2466333. [DOI] [PubMed] [Google Scholar]
- 34.Caldwell RA, Clemo HF, Baumgarten CM. Using gadolinium to identify stretch-activated channels: Technical considerations. Am J Physiol. 1998;275:C619–621. doi: 10.1152/ajpcell.1998.275.2.C619. [DOI] [PubMed] [Google Scholar]
- 35.Rothstein A, Mack E. Volume-activated calcium uptake: Its role in cell volume regulation of madin-darby canine kidney cells. Am J Physiol. 1992;262:C339–347. doi: 10.1152/ajpcell.1992.262.2.C339. [DOI] [PubMed] [Google Scholar]
- 36.Bolivar JJ, Cereijido M. Voltage and Ca2+-activated K+ channel in cultured epithelial cells (mdck) J Membr Biol. 1987;97:43–51. doi: 10.1007/BF01869613. [DOI] [PubMed] [Google Scholar]
- 37.Irnaten M, Barry RC, Quill B, Clark AF, Harvey BJP, O’Brien CJ. Activation of stretch-activated channels and maxi-K+ channels by membrane stress of human lamina cribrosa cells. Investigative Ophthalmology & Visual Science. 2009;50:194–202. doi: 10.1167/iovs.08-1937. [DOI] [PubMed] [Google Scholar]
- 38.Pacha J, Frindt G, Sackin H, Palmer LG. Apical maxi K channels in intercalated cells of cct. Am J Physiol. 1991;261:F696–705. doi: 10.1152/ajprenal.1991.261.4.F696. [DOI] [PubMed] [Google Scholar]
- 39.Hirsch J, Leipziger J, Frobe U, Schlatter E. Regulation and possible physiological role of the Ca2+-dependent K+ channel of cortical collecting ducts of the rat. Pflugers Arch. 1993;422:492–498. doi: 10.1007/BF00375077. [DOI] [PubMed] [Google Scholar]
- 40.Geyti CS, Odgaard E, Overgaard MT, Jensen JME, Praetorius HA. Slow spontaneous [Ca2+] oscillations reflect nucleotide release from renal epithelia. Pflueg Arch Eur J Physiol. 2008;455:1105–1117. doi: 10.1007/s00424-007-0366-4. [DOI] [PubMed] [Google Scholar]
- 41.Alcaraz J, Buscemi L, Grabulosa M, Trepat X, Fabry B, Farre R, Navajas D. Microrheology of human lung epithelial cells measured by atomic force microscopy. Biophys J. 2003;84:2071–2079. doi: 10.1016/S0006-3495(03)75014-0. [DOI] [PMC free article] [PubMed] [Google Scholar]
- 42.Filipovic D, Sackin H. A calcium-permeable stretch-activated cation channel in renal proximal tubule. Am J Physiol. 1991;260:F119–129. doi: 10.1152/ajprenal.1991.260.1.F119. [DOI] [PubMed] [Google Scholar]
- 43.Holtzclaw JD, Liu L, Grimm PR, Sansom SC. Shear stress-induced volume decrease in c11-mdck cells by bk-α/β4. American Journal of Physiology - Renal Physiology. 2010;299:F507–F516. doi: 10.1152/ajprenal.00222.2010. [DOI] [PMC free article] [PubMed] [Google Scholar]
- 44.Becker D, Blase C, Bereiter-Hahn J, Jendrach M. Trpv4 exhibits a functional role in cell-volume regulation. J Cell Sci. 2005;118:2435–2440. doi: 10.1242/jcs.02372. [DOI] [PubMed] [Google Scholar]
- 45.Numata T, Shimizu T, Okada Y. Trpm7 is a stretch- and swelling-activated cation channel involved in volume regulation in human epithelial cells. Am J Physiol. 2007;292:C460–467. doi: 10.1152/ajpcell.00367.2006. [DOI] [PubMed] [Google Scholar]
- 46.Tian W, Salanova M, Xu H, Lindsley JN, Oyama TT, Anderson S, Bachmann S, Cohen DM. Renal expression of osmotically responsive cation channel trpv4 is restricted to water-impermeant nephron segments. Am J Physiol Renal Physiol. 2004;287:F17–24. doi: 10.1152/ajprenal.00397.2003. [DOI] [PubMed] [Google Scholar]
- 47.Delany NS, Hurle M, Facer P, Alnadaf T, Plumpton C, Kinghorn I, See CG, Costigan M, Anand P, Woolf CJ, Crowther D, Sanseau P, Tate SN. Identification and characterization of a novel human vanilloid receptor-like protein, vrl-2. Physiol Genomics. 2001;4:165–174. doi: 10.1152/physiolgenomics.2001.4.3.165. [DOI] [PubMed] [Google Scholar]
- 48.Hua SZ, Gottlieb PA, Heo J, Sachs F. A mechanosensitive ion channel regulating cell volume. Am J Physiol. 2010;298:C1424–1430. doi: 10.1152/ajpcell.00503.2009. [DOI] [PMC free article] [PubMed] [Google Scholar]
- 49.Deng LH, Trepat X, Butler JP, Millet E, Morgan KG, Weitz DA, Fredberg JJ. Fast and slow dynamics of the cytoskeleton. Nature Materials. 2006;5:636–640. doi: 10.1038/nmat1685. [DOI] [PubMed] [Google Scholar]


