

Abstract
STUDY QUESTION
Do genetic polymorphisms which influence age at menarche in women of European ancestry also influence women of Chinese ancestry?
SUMMARY ANSWER
Many genetic variants influencing age at menarche in European populations appear to impact Chinese populations in a similar manner.
WHAT IS KNOWN AND WHAT THIS PAPER ADDS
Prior genome-wide association studies have uncovered 42 SNPs associated with age at menarche in European populations. This study is the first to demonstrate that many of the genetic determinants of age at menarche are shared between European and Chinese women.
PARTICIPANTS AND SETTING
We evaluated 37 of 42 SNPs identified as associated with age at menarche from a recent, large meta-analysis, consisting primarily of women of European ancestry, in a population of 6929 Chinese women from Shanghai, China. We also constructed weighted genetic risk scores (GRSs) combining the number of effect variants for all 37 SNPs, or only the SNPs associated with age at menarche among our study population, to evaluate their joint influence on age at menarche.
MAIN RESULTS
For 32 of the 37 evaluated variants, the direction of the allele associations were the same between women of European ancestry and women of Chinese ancestry (P = 3.71 × 10⁻⁶, binomial sign test); 9 of these were statistically significant. Subjects in the highest quintile of GRSs began menarche ∼5 months later than those in the lowest quintile.
BIAS, LIMITATIONS AND GENERALIZABILITY TO OTHER POPULATIONS
Age at menarche was obtained by self-report, which can be subject to recall errors. The current analysis was restricted to loci which met or approached GWAS significance thresholds and did not evaluate loci which may act predominantly or exclusively in the Chinese population. The smaller sample size for our meta-analysis compared with meta-analyses conducted in European populations reduced the power to detect significant results.
STUDY FUNDING/COMPETING INTERESTS
This study was supported, in part, by grants from US National Institutes of Health (grants R01CA124558, R01CA090899, R01CA070867; R01CA064277 and R01CA092585 and UL1 RR024975), Ingram professorship funds and Allen Foundation funds. There are no competing interests to declare.
Keywords: menarche, genome-wide association study, genetics, reproductive endocrinology
Background
As with other measures of growth and development, recent investigations into the genetics of age at menarche have uncovered several loci associated with its timing, including single nucleotide polymorphisms (SNPs) on chromosome 6q16.3 near the LIN28B gene (He et al., 2009; Ong et al., 2009; Perry et al., 2009; Sulem et al., 2009; ) and a locus in an intergenic region at 9q31.28 (He et al., 2009; Perry et al., 2009). A large meta-analysis of women of European ancestry by the ReproGen Consortium has recently reported 42 loci associated with age at menarche, including both the LIN28B and 9q loci (Elks et al., 2010).
Earlier onset of puberty in girls may also be related to diet and fat accumulation (Dietz, 1998). Improved economic standards and access to nutrition in Europe has corresponded with a decrease in the average age at menarche from ∼17 in 1830 to 13 in 1960 (Education and Science and Plowden, 1967). The recent rapid development of economies in East Asia has likewise lead to increased standards of living and greater access to nutrition (Shen et al., 1996; Mason et al., 2001). With these improvements, age at menarche among Asian women has decreased following a pattern similar to that seen in Europe (Parent et al., 2003; Graham et al., 1999). In 1979, the mean age at menarche in China was 13.5; among girls surveyed from 2003 to 2005, it had decreased to 12.3 (Ma et al., 2009).
Early menarche has been associated with several important clinical outcomes. Women who mature early are at increased risk later in life for breast (Kelsey et al., 1993) and endometrial (Weiderpass et al., 1999) cancer, obesity (Adair and Gordon-Larsen, 2001), type 2 diabetes (Lakshman et al., 2008) and cardiovascular disease (Okasha et al., 2001). They are also at higher risk of teenage pregnancy and a number of psychosocial problems, including depression, anxiety and substance abuse (Stice et al., 2001; Harlow et al., 2004). No genome-wide association study (GWAS) to date has evaluated age at menarche in an Asian population nor have the 42 known variants been investigated for associations in such populations.
In this study, we carried out a comprehensive evaluation of the loci previously associated with age at menarche in a European population in a large cohort of Chinese women. We evaluated the direction of the association for the index SNPs to determine the consistency of risk alleles between European-ancestry and Asian populations. We further assessed the collective effect of these variants on age at menarche by constructing genetic risk scores (GRSs).
Materials and Methods
Study participants and data collection
This analysis included a total of 6929 women from Shanghai, China who are participants of three ongoing GWAS: (i) the Shanghai Breast Cancer Genetics Study (SBCGS) (Zheng et al., 2009), (ii) the Shanghai Endometrial Cancer Genetics Study (SECGS) (Delahanty et al., 2011; Long et al., 2012) and (iii) the Shanghai Diabetes Genetics Study (SDGS) (Shu et al., 2010). The SBCGS included 2889 women with breast cancer; the SECGS included 839 women with endometrial cancer and the SDGS included 913 women with type 2 diabetes. All of these studies shared the same set of controls (n = 2318). The studies applied population-based, case–control designs and similar study protocols to collect blood or buccal cell samples and relevant exposure information. Interviews were conducted in person by trained, retired medical personnel, and anthropometrics including height, weight and circumferences of the waist and hips were measured by trained interviewers according to standard protocols. Body mass index (weight (kg)/height 2(cm) was included in current analysis. Information on weight during adolescence was not collected. Age at menarche, to the nearest year, was ascertained by participant recall during the interview. The average response rates were 86.7% for cases and 77.9% for controls (Shi et al., 2010). Of those who completed interviews, 90.6% of cases and 89.3% of controls also donated blood or buccal cells for DNA extraction (Shi et al., 2010). Written, informed consent was obtained from all participants prior to interview, and the study protocols were approved by the institutional review boards of all institutions involved in the study.
Genotyping and SNP selection
Genotyping of all participants was performed using the Affymetrix SNP Array 6.0 as previously described (Zheng et al., 2009). Quality control (QC) procedures included the removal of SNPs with minor allele frequencies (MAFs) of <5%, Hardy–Weinberg P values of <0.00001 and samples with >5% missing genotypes. Multidimensional scaling analyses based on pairwise identity-by-state showed that all subjects in the present study are clustered closely with HapMap Asians so that population stratification was not a concern. In addition, we included a number of other QC measures to verify the integrity of our genotyping, including checking the reported sex of individuals against genotype information and identifying potential duplicate individuals. Three sets of SNPs on the Affymetrix 6.0 array were previously genotyped using different platforms including 669 SNPs genotyped by the Affymetrix Targeted Genotyping System, 17 SNPs genotyped by Taqman and 56 SNPs genotyped by Sequenom. These SNP sets served as cross-platform sample verification. The mean concordance rates were 99.4% for the Affymetrix Targeted Genotyping System, 98.2% for Taqman and 98.8% for Sequenom, when compared with the Affymetrix 6.0 array. Additionally, we included one negative control (water) and three positive QC samples (NA15510, NA10851 and NA18505) purchased from the Coriell Cell Repositories (http://ccr.coriell.org/; Coriell Institute, Camden, NJ) in each of the 96-well plates genotyped to assess batch-to-batch validation. The average concordance rate between the QC samples was 99.8% (median: 100%).
Using the Han Chinese (CHB) and Japanese (JPT) data from HapMap Phase 2 (release 24) and Phase 3 (release 2) as the reference, we used MACH 1.0 software (http://www.sph.umich.edu/csg/abecasis/MaCH/) to impute variants that were not directly genotyped (Li et al., 2010). Only SNPs with an Rsq (a statistic used for studies analyzed with MACH) of >0.3 were evaluated; the average Rsq of included SNPs was 0.90 with a 95% confidence interval (CI) of 0.83–0.96.
SNPs of interest included all GWAS variants associated with age at menarche identified to date among European-ancestry women (Elks et al., 2010). Of the 42 loci previously shown to be associated with age at menarche, we were able to directly genotype or impute 41 SNPs. Four SNPs (rs1361108, rs7617480, rs16938437 and rs13187289) were excluded from our analysis, because their MAFs were <5% in our study population. A total of 37 SNPs were therefore analyzed, of which 25 were imputed and 12 were directly genotyped. We verified that loci were not in significant linkage disequilibrium (LD) with one another (r2 < 0.3) by using the SNAP server (http://www.broadinstitute.org/mpg/snap/ldsearch.php) and CHB and JPT HapMap data [Phase 2 (release 22) and Phase 3 (release 2)]. We used imputed estimates of genotype in instances where genotyping data were missing for an SNP (<1% of genotypes).
Statistical analysis
Statistical analysis was conducted using SAS, version 9.2 (SAS Institute, Inc., Cary, NC). Differences in the mean age at menarche by demographic or other group characteristics were evaluated by analysis of variance (ANOVA). Linear regression was used to derive beta coefficients and 95% CIs for associations between genotypes and age at menarche. All regression models included adjustment for birth cohort, education and disease status, all treated as categorical variables. P values reported for single SNPs are one-tailed results, since the hypothesis being tested was whether the direction of association was consistent between Asian and European samples. P values reported were not adjusted for multiple comparisons, given that this study was focused on validating SNPs identified by GWAS rather than on discovery of novel markers. Given the potential influence of over-sampling of women with menarche-age-related diseases (e.g. breast and endometrial cancer) on the study results, we also carried out sensitivity analyses restricted to samples from healthy controls.
We evaluated whether the alleles associated with an increase in age at menarche in European-ancestry populations were similarly associated with an increase in age at menarche in the Chinese population using the binomial sign test (Frayling et al., 2007). Under the null hypothesis that these loci do not contribute to age at menarche in the Chinese population, one would expect that half of the 37 bi-allelic SNPs to have the same allele associated with an increase in age at menarche in our Chinese population. We also used the same test to evaluate the probability of observing the number of significant results (P < 0.05 and same direction of association).
GRSs were derived by summing the products of numbers of menarche age-associated alleles each multiplied by their respective beta coefficient reported by the ReproGen study (Elks et al., 2010). Two sets of GRS were constructed. GRSsel included nine SNPs that were significantly associated with age at menarche (P < 0.05) in our study population, while GRSall included all 37 SNPs associated with age at menarche by previous GWAS. For imputed SNPs, dosage data were used to capture imputation probability for a given genotype. Relationships between GRS and age at menarche were evaluated by linear regression.
We also carried out a meta-analysis combining the results derived from our study with those reported by the ReproGen Consortium using the Z-statistic and P value-based approach. The resulting odds ratios (ORs) and 95% CIs were based on the fixed effect model, unless heterogeneity across studies was evident (P < 0.05 for the homogeneity test). In the latter case, ORs, 95% CIs and P values derived from the random effects model are presented. Meta-analysis P values presented are based on two-tailed tests.
To determine our power to detect previously reported effect sizes across a range of allelic frequencies, we used the program Quanto, modeling age at menarche continuously with a fixed sample size under an additive model (Gauderman and Morrison, 2006).
Results
Table I presents the mean age at menarche by age, birth year, education, income, BMI and disease status for the 6929 Chinese women included in the present study. Significant differences in age at menarche were observed across all categories, in the directions expected. Women born more recently tended to have progressively earlier ages at menarche (Ptrend < 0.001). Higher educational attainment was strongly associated with earlier age at menarche (Ptrend < 0.001). This appeared to be particularly true for those born before 1945, the cohort for which education was the best proxy of nutritional status. Similarly, higher levels of income were associated with earlier onset of menarche (Ptrend < 0.001). Higher adult BMI showed only a modest association with earlier age at menarche (Ptrend = 0.055), but this was most likely due to adult BMI being used instead of BMI at onset of menarche. There was a significant association between age at menarche and disease status (P < 0.001); this association was strongest for those who developed breast (P < 0.001) or endometrial cancer (P = 0.002), for which early age at menarche is a well-established risk factor.
Table I.
The mean age at menarche and selected characteristics of study participants.
| N | Mean | All (n = 6929) |
||
|---|---|---|---|---|
| SD | P-value | |||
| Age | ||||
| 22–45 | 1675 | 14.3 | 1.6 | <0.001 |
| 46–52 | 1809 | 14.6 | 1.6 | |
| 53–60 | 1714 | 14.7 | 1.8 | |
| 61–81 | 1731 | 14.8 | 1.9 | |
| Birth year | ||||
| 1926–1932 | 240 | 15.1 | 1.9 | <0.001 |
| 1933–1937 | 760 | 15.0 | 1.9 | |
| 1938–1941 | 651 | 14.7 | 1.8 | |
| 1942–1945 | 696 | 14.5 | 1.8 | |
| 1946–1949 | 1061 | 15.0 | 1.8 | |
| 1950–1953 | 1144 | 14.6 | 1.6 | |
| 1954–1957 | 1466 | 14.4 | 1.6 | |
| after 1958 | 911 | 14.2 | 1.6 | |
| Education | ||||
| None | 365 | 15.6 | 1.8 | <0.001 |
| Elementary | 670 | 15.2 | 1.8 | |
| Middle school | 2876 | 14.7 | 1.7 | |
| High school | 2205 | 14.3 | 1.6 | |
| College/professional | 811 | 14.1 | 1.6 | |
| Incomea | ||||
| <10 000 RMB | 1707 | 14.7 | 1.8 | <0.001 |
| 10 000–20 000 RMB | 2638 | 14.7 | 1.7 | |
| 20 000–30 000 RMB | 1414 | 14.5 | 1.7 | |
| >30 000 RMB | 1170 | 14.4 | 1.7 | |
| BMI | ||||
| <25 | 4226 | 14.7 | 1.7 | 0.055 |
| 25–29 | 2203 | 14.6 | 1.8 | |
| ≥30 | 490 | 14.5 | 1.9 | |
| Disease status | ||||
| Healthy controls | 2315 | 14.7 | 1.8 | <0.001 |
| Breast cancer | 2886 | 14.5 | 1.7 | |
| Endometrial cancer | 838 | 14.5 | 1.7 | |
| Type 2 diabetes | 953 | 14.8 | 1.8 | |
aPer family per year.
Table II presents the associations observed for the 37 variants included in our analysis and previously reported by the ReproGen Consortium. Alleles associated with younger age at menarche were used as reference alleles; a positive beta coefficient indicates consistency of direction between the European and Chinese study populations.
Table II.
Evaluation of GWAS-identified genetic variants and age at menarche in Chinese women.
| Reported by ReproGen Consortium |
Shanghai studies (n = 6929) |
|||||||||||
|---|---|---|---|---|---|---|---|---|---|---|---|---|
| rsID | Chr | Position (b36) | Nearest gene(s) | Reference/effect allele | Betaa | Reference P-valueb | EAF | Betac | P-valued | Typinge | Direction | Included in GRSself |
| rs7759938 | 6 | 105485647 | LIN28B | C/T | 6.4 | 5.40E−60 | 0.3063 | 8.3 | 3.8E−06 | I | Same | Y |
| rs2090409 | 9 | 108006909 | TMEM38B | C/A | 4.7 | 2.20E−33 | 0.4724 | 3.7 | 0.006 | I | Same | Y |
| rs12617311 | 2 | 199340810 | PLCL1 | G/A | 3.0 | 6.00E−33 | 0.6254 | 4.7 | 0.004 | I | Same | Y |
| rs6438424 | 3 | 119057512 | 3q13.32 | C/A | 2.7 | 1.30E−14 | 0.6153 | 3.7 | 0.008 | I | Same | Y |
| rs1079866 | 7 | 41436618 | INHBA | G/C | 3.9 | 5.50E−14 | 0.7729 | 2.5 | 0.079 | T | Same | |
| rs466639 | 1 | 163661506 | RXRG | C/T | 4.2 | 1.30E−13 | 0.1560 | 4.1 | 0.023 | T | Same | Y |
| rs1398217 | 18 | 43006236 | FUSSEL18 | C/G | 2.7 | 2.30E−13 | 0.4524 | −1.6 | 0.844 | I | Different | |
| rs9635759 | 17 | 46968784 | CA10 | A/G | 3.0 | 7.30E−13 | 0.4133 | 3.7 | 0.075 | I | Same | |
| rs6589964 | 11 | 122375893 | BSX | C/A | 2.7 | 1.90E−12 | 0.4325 | 1.0 | 0.255 | T | Same | |
| rs10980926 | 9 | 113333455 | ZNF483 | A/G | 2.5 | 4.20E−11 | 0.4117 | 2.6 | 0.047 | I | Same | Y |
| rs17268785 | 2 | 56445587 | CCDC85A | G/A | 3.2 | 9.70E−11 | 0.8619 | 3.4 | 0.060 | T | Same | |
| rs7642134 | 3 | 86999572 | VGLL3 | G/A | 2.4 | 3.50E−10 | 0.4515 | 2.2 | 0.073 | I | Same | |
| rs2002675 | 3 | 187112262 | TRA2B, ETV5 | G/A | 2.2 | 1.20E−09 | 0.8474 | 4.1 | 0.026 | I | Same | Y |
| rs7821178 | 8 | 78256392 | PXMP3 | C/A | 2.4 | 3.00E−09 | 0.5178 | 0.9 | 0.294 | I | Same | |
| rs1659127 | 16 | 14295806 | MKL2 | A/G | 2.4 | 4.00E−09 | 0.4387 | 2.8 | 0.049 | I | Same | Y |
| rs10423674 | 19 | 18678903 | CRTC1 | A/C | 2.3 | 5.90E−09 | 0.3751 | 1.2 | 0.223 | I | Same | |
| rs10899489 | 11 | 77773021 | GAB2 | A/C | 3.1 | 8.10E−09 | 0.6145 | 1.6 | 0.155 | T | Same | |
| rs6575793 | 14 | 100101970 | BEGAIN | C/T | 2.3 | 1.20E−08 | 0.3590 | 2.5 | 0.101 | I | Same | |
| rs4929923 | 11 | 8595776 | TRIM66 | T/C | 2.3 | 1.20E−08 | 0.6293 | 2.1 | 0.084 | T | Same | |
| rs6439371 | 3 | 134093442 | TMEM108, NPHP3 | G/A | 2.3 | 1.30E−08 | 0.7386 | 0.8 | 0.332 | I | Same | |
| rs6762477 | 3 | 50068213 | RBM6 | G/A | 2.5 | 1.60E−08 | 0.1302 | 0.9 | 0.352 | I | Same | |
| rs900145 | 11 | 13250481 | ARNTL | C/T | 2.3 | 1.60E−08 | 0.4456 | −1.0 | 0.738 | I | Different | |
| rs2947411 | 2 | 604168 | TMEM18 | A/G | 2.8 | 1.70E−08 | 0.0932 | −2.6 | 0.850 | T | Different | |
| rs1364063 | 16 | 68146073 | NFAT5 | C/T | 2.1 | 1.80E−08 | 0.0989 | 0.4 | 0.437 | I | Same | |
| rs633715 | 1 | 176119203 | SEC16B | T/C | 2.6 | 2.10E−08 | 0.2086 | −0.3 | 0.570 | I | Different | |
| rs4840086 | 6 | 100315159 | PRDM13, MCHR2 | A/G | 2.1 | 2.40E−08 | 0.3453 | 0.8 | 0.296 | I | Same | |
| rs9939609 | 16 | 52378028 | FTO | T/A | 2.1 | 3.10E−08 | 0.8832 | 2.3 | 0.156 | T | Same | |
| rs852069 | 20 | 17070593 | PCSK2 | G/A | 2.1 | 3.30E−08 | 0.8102 | 2.2 | 0.125 | T | Same | |
| rs757647 | 5 | 137735214 | KDM3B | G/A | 2.4 | 5.40E−08 | 0.5861 | 4.2 | 0.003 | T | Same | Y |
| rs9555810 | 13 | 110979438 | C13orf16, ARHGEF7 | G/C | 2.3 | 5.60E−08 | 0.8148 | 1.2 | 0.279 | I | Same | |
| rs2687729 | 3 | 129377916 | EEFSEC | G/A | 2.3 | 1.30E−07 | 0.9033 | 3.9 | 0.062 | T | Same | |
| rs12472911 | 2 | 141944979 | LRP1B | C/T | 2.5 | 1.50E−07 | 0.8261 | 1.4 | 0.239 | I | Same | |
| rs1862471 | 19 | 9861322 | OLFM2 | G/C | 2.0 | 1.50E−07 | 0.3213 | −1.4 | 0.811 | I | Different | |
| rs3914188 | 3 | 185492742 | ECE2 | C/G | 2.2 | 2.60E−07 | 0.3921 | 2.4 | 0.100 | I | Same | |
| rs2243803 | 18 | 41210670 | SLC14A2 | A/T | 2.0 | 3.40E−07 | 0.2028 | 0.2 | 0.450 | I | Same | |
| rs3743266 | 15 | 58568805 | RORA | T/C | 2.0 | 8.00E−07 | 0.1864 | 1.9 | 0.166 | T | Same | |
| rs7359257 | 15 | 65489961 | IQCH | A/C | 1.7 | 1.90E−06 | 0.1567 | 1.5 | 0.229 | I | Same | |
rsID, dbSNP ID number; Chr, chromosome; EAF, effect allele frequency; GRS, genetic risk score.
aPer allele effect on age at menarche in weeks.
bSNP P values observed by the ReproGen Consortium sorted in ascending order.
cMean difference in age at menarche per allele in weeks. Positive betas indicate BMI risk allele was the same in the ReproGen and current studies.
dP value for association with age at menarche in the study population of Chinese women. Significant results are shown in bold.
eI, Imputed; T, typed.
fOne SNP selected per locus was used in the calculation of the GRSsel (see section Materials and Methods).
Of the 37 SNPs evaluated, 32 had the same direction of association with age at menarche as found in the previous studies of European-ancestry women (Elks et al., 2010). The probability of observing 32 of 37 associations with the same direction was very low and therefore highly significant (P = 3.71 × 10−06). Per allele effect sizes ranged from 2.6 weeks for rs2947411 to 8.3 weeks for rs7759938, near LIN28B. Nine SNPs were significantly associated with age at menarche in Chinese women and had the same direction of association as observed by the ReproGen Consortium (P < 0.05, one-tailed). The probability of nine or more significant results at this level from 37 tests was itself low and therefore significant (P = 6.8 × 10−05). Additional analyses excluding women with breast or endometrial cancer showed that the direction and magnitude of the effect were not materially different from that obtained from the whole data set, although only five SNPs remained statistically significantly associated with age at menarche due to the reduced statistical power.
Of the variants which were marginally significant, as they were close to or did not meet the GWAS significance threshold of 5.0 × 10⁻⁸ used in the ReproGen Consortium study (shaded in Table III), four became significant in the meta-analysis conducted on our study results and results from the ReproGen Consortium These were rs757647 (KDM3B), rs9555810 (C13orf16, ARHGEF7), rs2687729 (EEFSEC) and rs3914188 (ECE2). Of the 28 (of 32) SNPs that reached the GWAS threshold used in the ReproGen Consortium study, 20 remained significant after the meta-analysis.
Table III.
Meta-analysis of ReproGen and Shanghai results.
| rsID | ReproGen betaa | ReproGen P-valueb | Shanghai beta | Shanghai P-valuec | Direction | Included in GRSsel | Meta-analysis beta | Meta-analysis SE | Meta-analysis P-valued |
|---|---|---|---|---|---|---|---|---|---|
| rs7759938 | 6.4 | 5.40E−60 | 8.3 | 3.80E−06 | Same | Y | 6.5 | 0.4 | 0.00E+00 |
| rs2090409 | 4.7 | 2.20E−33 | 3.7 | 0.006 | Same | Y | 4.6 | 0.4 | 0.00E+00 |
| rs12617311 | 3 | 6.00E−33 | 4.7 | 0.004 | Same | Y | 3.1 | 0.4 | 2.89E−15 |
| rs6438424 | 2.7 | 1.30E−14 | 3.7 | 0.008 | Same | Y | 2.8 | 0.4 | 9.08E−13 |
| rs1079866 | 3.9 | 5.50E−14 | 2.5 | 0.079 | Same | 3.8 | 0.5 | 3.00E−15 | |
| rs466639 | 4.2 | 1.30E−13 | 4.1 | 0.023 | Same | Y | 4.2 | 0.6 | 3.51E−13 |
| rs1398217 | 2.7 | 2.30E−13 | −1.6 | 0.844 | Different | 0.8 | 2.1 | 7.00E−01 | |
| rs9635759 | 3 | 7.30E−13 | 3.7 | 0.075 | Same | 3.0 | 0.4 | 2.30E−14 | |
| rs6589964 | 2.7 | 1.90E−12 | 1 | 0.255 | Same | 2.6 | 0.4 | 2.37E−11 | |
| rs10980926 | 2.5 | 4.20E−11 | 2.6 | 0.047 | Same | Y | 2.5 | 0.4 | 9.48E−11 |
| rs17268785 | 3.2 | 9.70E−11 | 3.4 | 0.06 | Same | 3.2 | 0.5 | 4.60E−11 | |
| rs7642134 | 2.4 | 3.50E−10 | 2.2 | 0.073 | Same | 2.4 | 0.4 | 6.87E−10 | |
| rs2002675 | 2.2 | 1.20E−09 | 4.1 | 0.026 | Same | Y | 2.3 | 0.4 | 8.13E−09 |
| rs7821178 | 2.4 | 3.00E−09 | 0.9 | 0.294 | Same | 2.3 | 0.4 | 2.86E−09 | |
| rs1659127 | 2.4 | 4.00E−09 | 2.8 | 0.049 | Same | Y | 2.4 | 0.4 | 4.92E−10 |
| rs10423674 | 2.3 | 5.90E−09 | 1.2 | 0.223 | Same | 2.2 | 0.4 | 8.38E−09 | |
| rs10899489 | 3.1 | 8.10E−09 | 1.6 | 0.155 | Same | 3.0 | 0.5 | 5.37E−10 | |
| rs6575793 | 2.3 | 1.20E−08 | 2.5 | 0.101 | Same | 2.3 | 0.4 | 3.88E−09 | |
| rs4929923 | 2.3 | 1.20E−08 | 2.1 | 0.084 | Same | 2.3 | 0.4 | 3.37E−09 | |
| rs6439371 | 2.3 | 1.30E−08 | 0.8 | 0.332 | Same | 2.2 | 0.4 | 1.13E−08 | |
| rs6762477 | 2.5 | 1.60E−08 | 0.9 | 0.352 | Same | 2.5 | 0.4 | 4.81E−10 | |
| rs900145 | 2.3 | 1.60E−08 | −1 | 0.738 | Different | 1.0 | 1.6 | 5.18E−01 | |
| rs2947411 | 2.8 | 1.70E−08 | −2.6 | 0.85 | Different | 0.6 | 2.7 | 8.29E−01 | |
| rs1364063 | 2.1 | 1.80E−08 | 0.4 | 0.437 | Same | 2.1 | 0.4 | 1.93E−07 | |
| rs633715 | 2.6 | 2.10E−08 | −0.3 | 0.57 | Different | 2.4 | 0.5 | 6.95E−07 | |
| rs4840086 | 2.1 | 2.40E−08 | 0.8 | 0.296 | Same | 2.0 | 0.4 | 1.76E−07 | |
| rs9939609 | 2.1 | 3.10E−08 | 2.3 | 0.156 | Same | 2.1 | 0.4 | 9.06E−08 | |
| rs852069 | 2.1 | 3.30E−08 | 2.2 | 0.125 | Same | 2.1 | 0.4 | 7.53E−08 | |
| rs757647 | 2.4 | 5.40E−08 | 4.2 | 0.003 | Same | Y | 2.5 | 0.4 | 7.16E−11 |
| rs9555810 | 2.3 | 5.60E−08 | 1.2 | 0.279 | Same | 2.3 | 0.4 | 8.81E−09 | |
| rs2687729 | 2.3 | 1.30E−07 | 3.9 | 0.062 | Same | 2.3 | 0.4 | 3.19E−09 | |
| rs12472911 | 2.5 | 1.50E−07 | 1.4 | 0.239 | Same | 2.4 | 0.5 | 5.01E−07 | |
| rs1862471 | 2 | 1.50E−07 | −1.4 | 0.811 | Different | 0.6 | 1.7 | 7.17E−01 | |
| rs3914188 | 2.2 | 2.60E−07 | 2.4 | 0.1 | Same | 2.2 | 0.4 | 1.59E−08 | |
| rs2243803 | 2 | 3.40E−07 | 0.2 | 0.45 | Same | 1.9 | 0.4 | 8.91E−07 | |
| rs3743266 | 2 | 8.00E−07 | 1.9 | 0.166 | Same | 2.0 | 0.4 | 3.60E−07 | |
| rs7359257 | 1.7 | 1.90E−06 | 1.5 | 0.229 | Same | 1.7 | 0.4 | 1.66E−05 |
rsID, dbSNP ID number; Chr, chromosome; EAF, effect allele frequency; GRS, genetic risk score.
aPer allele effect on age at menarche in weeks.
bSNP P values observed by the ReproGen Consortium sorted in ascending order.
cP value for association with age at menarche in the study population of Chinese women. Significant results are shown in bold.
dMeta-analysis P value using results from both ReproGen and Shanghai studies.
P values are shown in boldface, if the SNP reached genome-wide significance in the combined meta-analysis, but not in the ReproGen study.
To evaluate the collective contribution of these variants to age at menarche, GRS were assessed (Fig. 1). GRSsel included the nine SNPs with a significant association with age at menarche and the same direction of association as the ReproGen Consortium, while GRSall included all 37 SNPs in Table II. Both types of GRS were normally distributed with values ranging from 2.7 to 26.2 for GRSsel and 21.7 to 50.3 for GRSall. As expected, GRSsel was significantly associated with older age at menarche. Women in the highest quintile of GRSsel started menarche ∼22.6 weeks (nearly 5 months) later than those in the lowest quintile (P = 7.48 × 10⁻¹²). Each increase in GRSsel quintile was associated with a delay in the onset of menarche of ∼5.8 weeks (P = 3.8 × 10⁻¹⁵). GRSall was also associated with age at menarche. Women in the highest quintile of GRSall started menarche ∼23.3 weeks later than those in the lowest quintile (P = 1.8 × 10⁻¹²). Each increase in GRSall quintile corresponded to a delay in the onset of menarche of 5.6 weeks (P = 3.4 × 10⁻¹⁴).
Figure 1.
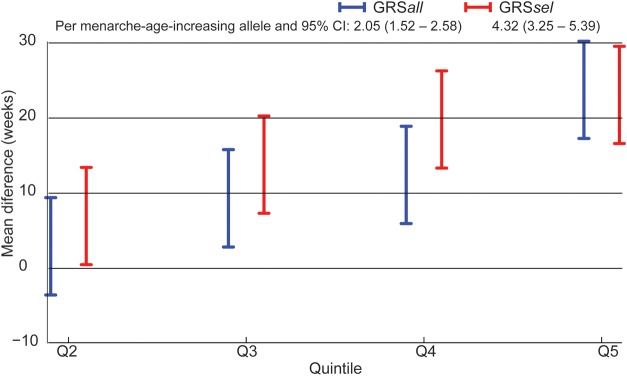
Association of genetic risk scores (GRS) with age at menarche. The mean difference in age at menarche (in weeks) between first quintile (reference) and the second to fifth quintiles of GRSall and GRSsel adjusted for birth year, education and disease status. GRSsel was calculated based on nine SNPs that were significantly associated with age at menarche in our population. GRSall was calculated based on all GWAS SNPs evaluated. The mean difference per menarche-age-increasing allele per SNPs included in each GRS is given along with 95% confidence intervals.
Discussion
In this study, we evaluated whether the loci that influence age at menarche in European populations also do so in Asian populations. We found that of the 37 genetic variants associated with age at menarche by GWAS of women with European ancestry, 32 showed the same direction of association and 9 were significantly associated (P < 0.05) with age at menarche among the 6929 Chinese women in our study. To our knowledge, this is the first study to comprehensively evaluate the transferability of age-at-menarche-associated genetic variants from European- to Asian-ancestry women. This study illustrates that genetic variants influence age at onset of menarche and that some of the genetic determinants are similar in both European and Chinese populations.
The finding that 9 of the 37 variants studied were significantly associated with age at menarche was itself significant (binomial sign test, P = 3.71 × 1006). The effect sizes found in the European population and Chinese samples for the most significant variants appear broadly comparable (Table II). Of these 37 variants, 32 showed directional consistency, suggesting that the associated SNPs and the causal alleles are in LD with each other in both European- and Asian-ancestry populations. A sensitivity analysis showed that over-sampling of women with breast or endometrial cancer did not materially alter the observed associations.
The SNPs that were most significantly associated with age at menarche in European-ancestry populations were more likely to be associated with age at menarche among Asians; five of the six most significant loci reported by the ReproGen Consortium were significantly associated with age at menarche in our study (Elks et al., 2010). The first two loci discovered to be associated with age at menarche, rs7759938 at LIN28B and rs2090409 on 9q31.2, were among the strongest associations in our study. Given that the majority of variants (35/37) under study for association with age at menarche were discovered by the ReproGen Consortium meta-analysis of up to 102 533 European-ancestry individuals (between discovery and replication stages) (Elks et al., 2010), it is not surprising that in our much smaller study, we were underpowered to detect associations for variants with small effect sizes. However, it is notable that 32 out of 37 variants had consistent directions of associations with age at menarche in women of European and Asian ancestry and nine reached nominal statistical significance (P < 0.05). In our study, the effect size of the most significant variant, rs7759938, was an 8.3-week delay in age at menarche, which is greater than the 6.4 weeks estimated for the European-ancestry population (Elks et al., 2010).
For complex traits, methods to evaluate the contribution of collected variants to a trait of interest, such as GRS, are commonly used (Morrison et al., 2007; Meigs et al., 2008; Lango et al., 2010; Yang et al., 2010; Makowsky et al., 2011). For GRSsel, which included only variants associated with age at menarche in our study, each quintile was associated with a delay in age at menarche of 5.8 weeks (Ptrend = 3.8 × 10⁻¹⁵); women in the highest quintile started menarche 22.6 weeks later than those in the lowest quintile (Fig. 1). For GRSall, this difference was 5.6 weeks per quintile and 23.3 weeks between the highest and lowest quintiles. There is a concern that GRSsel may overestimate the contribution of genetic variants on age at menarche and GRSall is likely to underestimate genetic contributions, because of differences in genetic architecture between European- and Asian-ancestry populations. However, in this study, we found that these two scores provided very similar results.
This study has some important strengths and weaknesses. First, the size of our Asian-ancestry population was significantly smaller (n = 6929) than the sample size used in the meta-analysis conducted by the ReproGen Consortium (Elks et al., 2010). Small effects require larger sample sizes to be detected; therefore, it is not surprising that 35 of the 37 variants investigated here were identified by the ReproGen Consortium meta-analysis. Our power calculations indicated that with a sample size such as ours, we would only have 80% power to detect per allele effects of >4 weeks when the MAF is >0.3, a condition describing only a few of the top variants reported by the ReproGen Consortium. For effect sizes of the order of 2 weeks, as showed in the majority of SNPs in the meta-analysis, a sample size of 70 000 would be required to ensure a statistical power of 80%. Secondly, population differences in LD and differences in allele frequencies between European- and Asian-ancestry populations also influenced our ability to detect associations. The success of detecting a significant association between populations requires that causal variants have similar effect sizes across populations and that LD between tested variants and causal variants be similar between populations (Shriner et al., 2009). Given that 9 of the 37 loci evaluated were significantly associated and 32 of the 37 variants had directions of association consistent with prior reports, we expect that many age at menarche-associated variants identified among European-ancestry populations would transfer to Asian populations as the sample size of our study increases. Thirdly, as with most epidemiological studies, information for age at menarche in the current analysis was self-reported and subject to recall error, though age at menarche tends to be recalled well (Must et al., 2002). Fourthly, because the focus of the current study was to validate the association of variants known to influence age at menarche in a new population, no effort was devoted to discovery or validation of novel SNPs that are unique to Chinese women.
A major strength of this analysis is that it was a single population-based study of genetic variants and age at menarche, and the first large study conducted among Asian-ancestry women. The study design and common protocol, as well as the high response rate and low selection bias, are also important strengths. In selecting variants, we chose to use P values unadjusted for multiple comparisons, since we were validating the association of variants known to influence age at menarche in a new population, rather than discovering new variants. Applying a correction for multiple comparisons would have left only two SNPs meeting the P value thresholds (P < 0.003) for GRSsel.
In conclusion, 9 of the 37 variants previously shown to be associated with age at menarche among European-ancestry women were associated with age at menarche in our population of Chinese women. These data indicate that the genetic architecture of age at menarche may be shared between populations of Asian and European ancestry. Future GWAS of age at menarche in Asian populations may identify additional loci that influence this trait.
Authors' roles
R.J.D. performed the data analysis and drafted the manuscript. A.B.F. and X.O.S. contributed to the writing. Q.C. supervised the genotyping of samples. J.L. supervised the QC procedures on the genotyping data. W.W. contributed to data analysis. Y.T.G., W.L., Y.B.X., Y.Z., B.T.J., W.Z. and X.O.S. contributed to the study conception, design and data collection. All authors critically reviewed and approved the final manuscript.
Funding
This study was supported, in part, by grants from US National Institutes of Health (grants R01CA124558, R01CA090899, R01CA070867; R01CA064277 and R01CA092585 and UL1 RR024975), Ingram professorship funds and Allen Foundation funds.
Conflict of interest
None declared.
Acknowledgements
The authors thank the research staff of the Shanghai Breast Cancer Genetics Study, Shanghai Endometrial Cancer Genetics Study and the Shanghai Diabetes Genetics Study, without whom the present study would not be possible. In addition, we wish to thank Jing He, Wanqing Wen, Hui Cai, Chun Li, Gong Yang and Honglan Li for their contributions to the parent studies of this project, as well as Bethanie Rammer and Jacqueline Stern for editing and preparing the manuscript.
References
- Adair LS, Gordon-Larsen P. Maturational timing and overweight prevalence in US adolescent girls. Am J Public Health. 2001;91:642. doi: 10.2105/ajph.91.4.642. doi:10.2105/AJPH.91.4.642. [DOI] [PMC free article] [PubMed] [Google Scholar]
- Delahanty RJ, Beeghly-Fadiel A, Xiang YB, Long J, Cai Q, Wen W, Xu WH, Cai H, He J, Gao YT. Association of obesity-related genetic variants with endometrial cancer risk: a report from the Shanghai Endometrial Cancer Genetics Study. Am J Epidemiol. 2011;174:1115–1126. doi: 10.1093/aje/kwr233. doi:10.1093/aje/kwr233. [DOI] [PMC free article] [PubMed] [Google Scholar]
- Dietz WH. Health consequences of obesity in youth: childhood predictors of adult disease. Pediatrics. 1998;101:518. [PubMed] [Google Scholar]
- Education and Science Do and Plowden BHP. Children and their primary schools: a report. Research and Surveys. 1967. HMSO.
- Elks CE, Perry JRB, Sulem P, Chasman DI, Franceschini N, He C, Lunetta KL, Visser JA, Byrne EM, Cousminer DL. Thirty new loci for age at menarche identified by a meta-analysis of genome-wide association studies. Nat Genet. 2010;42:1077–1085. doi: 10.1038/ng.714. doi:10.1038/ng.714. [DOI] [PMC free article] [PubMed] [Google Scholar]
- Frayling TM, Timpson NJ, Weedon MN, Zeggini E, Freathy RM, Lindgren CM, Perry JR, Elliott KS, Lango H, Rayner NW, et al. A common variant in the FTO gene is associated with body mass index and predisposes to childhood and adult obesity. Science. 2007;316:889–894. doi: 10.1126/science.1141634. [DOI] [PMC free article] [PubMed] [Google Scholar]
- Gauderman WJ, Morrison JM. QUANTO 1.1: A computer program for power and sample size calculations for genetic-epidemiology studies. 2006. http://hydra usc edu/gxe .
- Graham MJ, Larsen U, Xu X. Secular trend in age at menarche in China: a case study of two rural counties in Anhui Province. J Biosoc Sci. 1999;31:257–267. doi: 10.1017/s0021932099002576. doi:10.1017/S0021932099002576. [DOI] [PubMed] [Google Scholar]
- Harlow BL, Cohen LS, Otto MW, Spiegelman D, Cramer DW. Early life menstrual characteristics and pregnancy experiences among women with and without major depression: the Harvard study of moods and cycles. J Affect Disord. 2004;79:167–176. doi: 10.1016/S0165-0327(02)00459-7. doi:10.1016/S0165-0327(02)00459-7. [DOI] [PubMed] [Google Scholar]
- He C, Kraft P, Chen C, Buring JE, Paré G, Hankinson SE, Chanock SJ, Ridker PM, Hunter DJ, Chasman DI. Genome-wide association studies identify loci associated with age at menarche and age at natural menopause. Nat Genet. 2009;41:724–728. doi: 10.1038/ng.385. doi:10.1038/ng.385. [DOI] [PMC free article] [PubMed] [Google Scholar]
- Kelsey JL, Gammon MD, John EM. Reproductive factors and breast cancer. Epidemiol Rev. 1993;15:36. doi: 10.1093/oxfordjournals.epirev.a036115. [DOI] [PubMed] [Google Scholar]
- Lakshman R, Forouhi N, Luben R, Bingham S, Khaw K, Wareham N, Ong KK. Association between age at menarche and risk of diabetes in adults: results from the EPIC-Norfolk cohort study. Diabetologia. 2008;51:781–786. doi: 10.1007/s00125-008-0948-5. doi:10.1007/s00125-008-0948-5. [DOI] [PubMed] [Google Scholar]
- Lango AH, Estrada K, Lettre G, Berndt SI, Weedon MN, Rivadeneira F, Willer CJ, Jackson AU, Vedantam S, Raychaudhuri S, et al. Hundreds of variants clustered in genomic loci and biological pathways affect human height. Nature. 2010;467:832–838. doi: 10.1038/nature09410. [DOI] [PMC free article] [PubMed] [Google Scholar]
- Li Y, Willer CJ, Ding J, Scheet P, Abecasis GR. MaCH: using sequence and genotype data to estimate haplotypes and unobserved genotypes. Genet Epidemiol. 2010;34:816–834. doi: 10.1002/gepi.20533. doi:10.1002/gepi.20533. [DOI] [PMC free article] [PubMed] [Google Scholar]
- Long J, Zheng W, Xiang YB, Lose F, Thompson D, Tomlinson I, Yu H, Wentzensen N, Lambrechts D, Dörk T. Genome-wide association study identifies a possible susceptibility locus for endometrial cancer. Cancer Epidemiol Biomarkers Prev. 2012;21:980–987. doi: 10.1158/1055-9965.EPI-11-1160. doi:10.1158/1055-9965.EPI-11-1160. [DOI] [PMC free article] [PubMed] [Google Scholar]
- Ma HM, Du ML, Luo XP, Chen SK, Liu L, Chen RM, Zhu C, Xiong F, Li T, Wang W. Onset of breast and pubic hair development and menses in urban Chinese girls. Pediatrics. 2009;124:e269. doi: 10.1542/peds.2008-2638. doi:10.1542/peds.2008-2638. [DOI] [PubMed] [Google Scholar]
- Makowsky R, Pajewski NM, Klimentidis YC, Vazquez AI, Duarte CW, Allison DB, de los CG. Beyond missing heritability: prediction of complex traits. PLoS Genet. 2011;7:e1002051. doi: 10.1371/journal.pgen.1002051. [DOI] [PMC free article] [PubMed] [Google Scholar]
- Mason JB, Hunt J, Parker D, Jonsson U. 2001. Improving child nutrition in Asia. Tokyo: United Nations University Press. [Google Scholar]
- Meigs JB, Shrader P, Sullivan LM, McAteer JB, Fox CS, Dupuis J, Manning AK, Florez JC, Wilson PWF, D'Agostino RB., Sr Genotype score in addition to common risk factors for prediction of type 2 diabetes. N Engl J Med. 2008;359:2208. doi: 10.1056/NEJMoa0804742. doi:10.1056/NEJMoa0804742. [DOI] [PMC free article] [PubMed] [Google Scholar]
- Morrison AC, Bare LA, Chambless LE, Ellis SG, Malloy M, Kane JP, Pankow JS, Devlin JJ, Willerson JT, Boerwinkle E. Prediction of coronary heart disease risk using a genetic risk score: the Atherosclerosis Risk in Communities Study. Am J Epidemiol. 2007;166:28. doi: 10.1093/aje/kwm060. doi:10.1093/aje/kwm060. [DOI] [PubMed] [Google Scholar]
- Must A, Phillips SM, Naumova EN, Blum M, Harris S, Dawson-Hughes B, Rand WM. Recall of early menstrual history and menarcheal body size: after 30 years, how well do women remember? Am J Epidemiol. 2002;155:672–679. doi: 10.1093/aje/155.7.672. doi:10.1093/aje/155.7.672. [DOI] [PubMed] [Google Scholar]
- Okasha M, McCarron P, Smith GD, McEwen J. Age at menarche: secular trends and association with adult anthropometric measures. Ann Hum Biol. 2001;28:68–78. doi: 10.1080/03014460150201896. doi:10.1080/03014460150201896. [DOI] [PubMed] [Google Scholar]
- Ong KK, Elks CE, Li S, Zhao JH, Luan J, Andersen LB, Bingham SA, Brage S, Smith GD, Ekelund U. Genetic variation in LIN28B is associated with the timing of puberty. Nat Genet. 2009;41:729–733. doi: 10.1038/ng.382. doi:10.1038/ng.382. [DOI] [PMC free article] [PubMed] [Google Scholar]
- Parent AS, Teilmann G, Juul A, Skakkebaek NE, Toppari J, Bourguignon JP. The timing of normal puberty and the age limits of sexual precocity: variations around the world, secular trends, and changes after migration. Endocr Rev. 2003;24:668. doi: 10.1210/er.2002-0019. doi:10.1210/er.2002-0019. [DOI] [PubMed] [Google Scholar]
- Perry JRB, Stolk L, Franceschini N, Lunetta KL, Zhai G, McArdle PF, Smith AV, Aspelund T, Bandinelli S, Boerwinkle E. Meta-analysis of genome-wide association data identifies two loci influencing age at menarche. Nat Genet. 2009;41:648–650. doi: 10.1038/ng.386. doi:10.1038/ng.386. [DOI] [PMC free article] [PubMed] [Google Scholar]
- Shen T, Habicht JP, Chang Y. Effect of economic reforms on child growth in urban and rural areas of China. N Engl J Med. 1996;335:400–406. doi: 10.1056/NEJM199608083350606. doi:10.1056/NEJM199608083350606. [DOI] [PubMed] [Google Scholar]
- Shi J, Long J, Gao YT, Lu W, Cai Q, Wen W, Zheng Y, Yu K, Xiang YB, Hu FB. Evaluation of genetic susceptibility loci for obesity in Chinese women. Am J Epidemiol. 2010;172:244–254. doi: 10.1093/aje/kwq129. doi:10.1093/aje/kwq129. [DOI] [PMC free article] [PubMed] [Google Scholar]
- Shriner D, Adeyemo A, Gerry NP, Herbert A, Chen G, Doumatey A, Huang H, Zhou J, Christman MF, Rotimi CN. Transferability and fine-mapping of genome-wide associated loci for adult height across human populations. PLoS One. 2009;4:e8398. doi: 10.1371/journal.pone.0008398. doi:10.1371/journal.pone.0008398. [DOI] [PMC free article] [PubMed] [Google Scholar]
- Shu XO, Long J, Cai Q, Qi L, Xiang YB, Cho YS, Tai ES, Li X, Lin X, Chow WH. Identification of new genetic risk variants for type 2 diabetes. PLoS Genet. 2010;6:e1001127. doi: 10.1371/journal.pgen.1001127. doi:10.1371/journal.pgen.1001127. [DOI] [PMC free article] [PubMed] [Google Scholar]
- Stice E, Presnell K, Bearman SK. Relation of early menarche to depression, eating disorders, substance abuse, and comorbid psychopathology among adolescent girls. Dev Psychol. 2001;37:608. doi: 10.1037//0012-1649.37.5.608. doi:10.1037/0012-1649.37.5.608. [DOI] [PubMed] [Google Scholar]
- Sulem P, Gudbjartsson DF, Rafnar T, Holm H, Olafsdottir EJ, Olafsdottir GH, Jonsson T, Alexandersen P, Feenstra B, Boyd HA. Genome-wide association study identifies sequence variants on 6q21 associated with age at menarche. Nat Genet. 2009;41:734–738. doi: 10.1038/ng.383. doi:10.1038/ng.383. [DOI] [PubMed] [Google Scholar]
- Weiderpass E, Adami HO, Baron JA, Magnusson C, Bergström R, Lindgren A, Correia N, Persson I. Risk of endometrial cancer following estrogen replacement with and without progestins. J Natl Canc Inst. 1999;91:1131–1137. doi: 10.1093/jnci/91.13.1131. doi:10.1093/jnci/91.13.1131. [DOI] [PubMed] [Google Scholar]
- Yang J, Benyamin B, McEvoy BP, Gordon S, Henders AK, Nyholt DR, Madden PA, Heath AC, Martin NG, Montgomery GW. Common SNPs explain a large proportion of the heritability for human height. Nat Genet. 2010;42:565–569. doi: 10.1038/ng.608. doi:10.1038/ng.608. [DOI] [PMC free article] [PubMed] [Google Scholar]
- Zheng W, Long J, Gao YT, Li C, Zheng Y, Xiang YB, Wen W, Levy S, Deming SL, Haines JL. Genome-wide association study identifies a new breast cancer susceptibility locus at 6q25. 1. Nat Genet. 2009;41:324–328. doi: 10.1038/ng.318. doi:10.1038/ng.318. [DOI] [PMC free article] [PubMed] [Google Scholar]