

Abstract
A novel dual-mode contrast agent was formulated through the addition of an optical near infrared (NIR) probe to a perfluorocarbon (PFC)-based 19F magnetic resonance imaging (MRI) agent, which labels inflammatory cells in situ. A single PFC-NIR imaging agent enables both a qualitative, rapid optical monitoring of an inflammatory state and a quantitative, detailed and tissue-depth independent magnetic resonance imaging (MRI). The feasibility of in vivo optical imaging of the inflammatory response was demonstrated in a subcutaneous murine breast carcinoma model. Ex vivo optical imaging was used to quantify the PFC-NIR signal in the tumor and organs, and results correlated well with quantitative 19F NMR analyses of intact tissues. 19F MRI was employed to construct a three-dimensional image of the cellular microenvironment at the tumor site. Flow cytometry of isolated tumor cells was used to identify the cellular localization of the PFC-NIR probe within the tumor microenvironment. Contrast is achieved through the labeling of host cells involved in the immune response, but not tumor cells. The major cellular reservoir of the imaging agent were tumor-infiltrating CD11b+ F4/80low Gr-1low cells, a cell subset sharing immunophenotypic features with myeloid-derived suppressor cells (MDSCs). These cells are recruited to sites of inflammation and are implicated in immune evasion and tumor progression. This PFC-NIR contrast agent coupled to non-invasive, quantitative imaging techniques could serve as a valuable tool for evaluating novel anticancer agents.
Keywords: 19F MRI, inflammation, imaging, myeloid-derived suppressor cells, near infrared probe, tumor, tumor-infiltrating leukocytes
Introduction
It is now generally accepted that the cross-talk between tumor cells and non-transformed host cells, including tumor-infiltrating immune cells, mediates tumor persistence and growth.1,2 While the molecular and cellular details of this interaction vary with tumor type,3-7 the presence of immune cell infiltrates is a hallmark of most solid neoplasms. The interactions at the cellular level are complex, with host cells either actively promoting angiogenesis, invasion and metastasis,8-13 or mediating tumor destruction in response to appropriate activation stimuli and hence increasing patient survival14,15 The importance of a precise understanding of these interactions is underscored by several studies exploring the correlation between the extent of tumor infiltration by discrete subsets of leukocytes and prognosis,8,16,17 as well as by the potential to treat cancer by altering the balance of cells exerting pro-and anti-cancer functions.
Although the link between inflammation and cancer has been known for some time,13,18 recent advances in cancer imaging have exploited specific aspects of inflammation in the tumor microenvironment. A number of imaging modalities and technologies have been used to differentiate tumors from normal host tissues. Optical measurements using near infrared (NIR) fluorescent probes constitute one popular imaging method, due to the availability, accessibility and speed of in vivo assessments. However, image interpretation, signal quantification and the extension of the approach beyond small animals are difficult, in particular for non-surface oriented disease models, due to the poor tissue penetration of both the excitation source and the emitted signal.19 To overcome this limitation, a second reporter for tissue depth-independent imaging, typically magnetic resonance imaging (MRI), can be coupled to the probe. Optical moieties coupled with gadolinium or iron oxide nanoparticles have proven to be useful for the detection of cell infiltration in various models, including solid tumors.20 However, the usefulness of these probes is generally limited by the fact that metal-ion contrast agents only alter the MRI contrast and do not provide positive signal alone.21 Thus, pre- and post-contrast scans are generally required for image interpretation and quantification can be challenging.22 19F MRI, however, detects the signal from fluorine nuclei in the probes themselves, is specific due to the paucity of native fluorine, and is not limited by tissue depth.23,24 Several studies25-33 have recently used perfluorocarbon (PFC) nanoemulsions and 19F MRI to image inflammation in a number of disease models, indicating that these systems can provide sufficient signal for detection of immune cell infiltration. In these studies, the 19F imaging agent was correlated with,34 and found in,30 macrophages present at the inflammatory site. Also, 19F nuclear magnetic resonance (NMR) spectroscopy can be used to quantify the fluorine content in intact, excised tissues,34 allowing for straightforward biodistribution measurements that are not easily achievable with metal-ion contrast agents.
Here, we report proof-of-principle experiments based on a novel PFC-NIR dual-mode agent for the in vivo detection of inflammation-associated cells found within the tumor microenvironment. This formulation adds NIR imaging capabilities to a 19F MRI contrast agent previously found to accumulate within macrophages at sites of inflammation.30,34 To our knowledge, this is the first report of a 19F MRI/optical dual-mode agent applied to the in vivo imaging of inflammation-associated cellular response in a tumor model. In this study, tumor infiltrating cells with a phenotype consistent with myeloid-derived suppressor cells (MDSCs) represented the predominate fraction of cells labeled by the PFC-NIR agent in situ, providing a means of non-invasively imaging these cells. The results presented here confirm that the two imaging modalities contain the same, pertinent information on inflammation at the tumor site and enable both straightforward optical monitoring and sensitive NMR quantification. Overall, contrast agents of this type, either delivered separately or in the same formulation, will be important in the evaluation of changes in the tumor microenvironment upon therapy.
Results
A dual-mode PFC-NIR probe was formulated to enable the detection of inflammatory cells in vivo by MRI and optical imaging. The fluorescence excitation/emission and the correlation between optical and 19F NMR acquired signals are shown in Figure 1A and B, while Figure 1C and D display the characterization of reagent particle size and serum stability. The z-average particle size was 145 ± 5 nm (n = 5) after manufacture, with a polydispersity index (PDI) of 0.09 ± 0.01. The nanoemulsion remained dispersed for more than 6 mo, with a slight increase in average particle size (15% over 6 mo), though the size distribution remained uniform and sharply peaked (PDI < 0.1). A small increase in particle size was observed upon incubation in serum, but the emulsion remained well-dispersed and without large (> 1 μm) agglomerates investigated through visual microscopy (data not shown).

Figure 1. Characterization of the PFC-NIR nanoemulsion. (A) Normalized excitation and emission intensity as a function of wavelength for the PFC-NIR nanoemulsion. (B)19F content measured by NMR spectroscopy as compared with fluorescence intensity of the dual-mode agent. (C) Dynamic light scattering (DLS) of the contrast agent particle size measured over time for three different storage temperatures. (D) Effect of serum-containing media on the short-term stability of the emulsion as measured by DLS. Error bars represent the standard deviation of triplicate measurements.
To determine whether the PFC-NIR probe could enable visualization of the tumor site, tumor-bearing and naïve control mice were given bolus i.v. injection and then followed by in vivo optical imaging over time. Figure 2A displays a typical time-course of NIR images starting just prior to, immediately following, and up to 72 hours post-administration for healthy and tumor bearing animals. The tumors were detectable approximately six hours post-inoculation. No NIR signal was detected in the same region of control animals or on the contralateral flank of tumor-bearing mice. A NIR signal was also detected in the abdomen (liver and spleen, see below), in both healthy and 4T1-derived tumor-bearing mice by two hours post-inoculation. The analysis of the integrated signal (Fig. 2B) revealed a rapid accumulation of the probe in the liver (and spleen) and no discernible difference in early kinetics between tumor-bearing and healthy control animals, although the signal appeared to decrease more rapidly in control mice. The uptake of the probe by the tumor was slower and plateaued at a later time point than that by the liver.

Figure 2. In vivo optical imaging of tumor-associated inflammation. (A) Typical time-course of live, whole body NIR imaging just prior to and up to 72 h after, the administration of the contrast agent in a naive tumor-free control (top) and 4T1 cell-derived tumor-bearing mouse (bottom). Far-right inserts define areas used for signal analysis. (B) From left to right, signal (I) in the livers of tumor-free mice, the livers of 4T1-bearing mice and in tumors as obtained by serial measurements over time. Time zero signals (I0) were used to define background and were subtracted from data. Bold lines denote cohort average, error bars are standard deviation, and shaded lines denote individual mice.
Because tumor detection by PFC-based agents is thought to result from the accumulation of PFC in macrophages,30,34,35 we tested whether macrophages could be labeled with our PFC-NIR compound in vitro. To this aim, murine RAW 264.7 macrophages were cultured with increasing doses of the PFC-NIR probe and uptake was assessed with flow cytometry (Fig. 3A). RAW 264.7 cells showed a time-dependent uptake of the contrast agent (Fig. 3B), while minimal uptake was observed with 4T1 cells (also confirmed by 19F NMR spectroscopy, data not shown). Although other PFC agents have not been associated with toxicity to labeled cells36,37 and no adverse effects have been found upon systemic administration, the safety of the PFC-NIR probe was nonetheless evaluated in vitro. The effect of the probe on labeled cells was measured using Trypan blue exclusion and flow cytometry with calcein AM and 7-aminoactinomycin D (7-AAD). A slight decrease in the viability and a modest increase in the apoptotic rate of RAW 264.7 cells was observed with increasing doses of the contrast agent, although we detected no overt toxicity on animals during in vivo studies. These results suggest that host phagocytes, recruited to the tumor microenvironment, rather than 4T1 cancer cells, are likely to represent the cellular reservoir of PFC-NIR probe at the tumor site.

Figure 3. In vitro cellular uptake of the PFC-NIR agent. (A) Representative histogram of PFC-NIR detection in RAW 264.7 cells incubated with the PFC-NIR agent for 3 h (dashed line) or 18 h (solid line), as compared with untreated control cells (shaded histogram). (B) Label uptake by RAW 264.7 cells (closed bars) and 4T1 cells (open bars) incubated with the PFC-NIR probe over time as measured by flow cytometry. (C, D) Viability of RAW 264.7 cells after treatment with increasing amounts of the PFC-NIR agent for 18 h, as measured by Trypan blue exclusion (C) or cytofluorometric analysis of calcein AM and 7-aminoactinomycin D (7-AAD) (D). Results in (D) represent the average frequency of cells labeled with either calcein AM (live), 7-AAD (dead) or both (apoptotic), and error bars represent standard deviation of mean of duplicate samples.
To validate and further quantify in vivo NIR measurements, tumors were excised and analyzed ex vivo. The biodistribution of the probe in excised organs was analyzed by both NIR analysis and 19F NMR, to confirm the source of in vivo fluorescent signal in the abdomen (Fig. 4). A strong signal was observed in the tumor. Only the signals from the liver and spleen were higher than that from the tumor. This is not unexpected, as the PFC reagent is expected to be cleared from the blood via the reticuloendothelial system (RES).38-40 The two measurement techniques exhibited a good correlation (R = 0.86, Fig. 4C), even after 72 h in vivo, implying that the fluorescent and PFC moieties of the contrast agent remain in close proximity. There appeared to be a slight tissue-dependent effect on the optical signal emanating from the lungs and spleen. The NIR signal was somewhat higher in the lung and lower in the spleen than that predicted by the correlation to 19F NMR measurements in other tissues.

Figure 4. Ex vivo PFC-NIR measurements by NMR and fluorescence correlate and reflect in vivo imaging observations. (A) NIR images of excised tumors and other organs were obtained72 h post-administration of the PFC-NIR agent. Quantitative data of the optical signal, normalized by tissue weight, are shown for individual tissues isolated from tumor-bearing (open bars) or control animals (closed bars) (n = 3 per tissue). Error bars represent the standard deviation. (B) A representative NMR spectrum of an excised tumor analyzed in the presence of a chemically shifted reference compound is shown. The signal from the probe in the tissue is spectrally well separated from the reference compound, and the comparison of the intensities of the two signals yields the relative amount of 19F per tissue. Quantitative data of the NMR signal, normalized by tissue weight, are shown for individual tissues isolated from tumor-bearing (open bars) or control animals (closed bars) (n = 3 per tissue). Error bars represent the standard deviation. (C) Correlation of fluorescent optical and NMR signals of individual tissues (obtained from both control and tumor-bearing animals), plotted on a log scale.
To assess the ability of the PFC-NIR probe to be used with MRI, one control mouse and one tumor-bearing mouse were imaged by in vivo fluorescence and then examined by 19F MRI at 7 Tesla (Fig. 5A-C). Both imaging modalities similarly detected the probe in the liver, spleen and tumor. MRI revealed that the inflammatory signal resided in the periphery of the tumor (Fig. 5C and Video S1).

Figure 5. Correspondence of MRI and optical signal differs in the resolution obtained in the distribution of the contrast agent in the tumor. (A and B) Images obtained 72 h after the administration of the contrast agent are shown for control (A) and tumor-bearing (B) mice. In panels (A and B), optical image are provided on the left, while MRI overlays (1H/19F) are depicted on the right. 19F images collected as a coronal projection were rendered in pseudo-color (hot-iron scale), and only pixels containing the 19F signal were selected and overlaid on a 2 mm slice of a 1H anatomical pilot image. As the optical image was acquired in the opposite orientation, it was reflected along the x-axis so that the tumor can be observed on the same side of the mouse. (C) Consecutive 0.5-mm thick 19F/1H MRI composite images rendered from 3D data sets anterior to posterior coronal views, shown from top to bottom. Only the region containing the tumor is shown and the 19F signal is overlayed on the corresponding anatomical slice.
To identify the cellular reservoir for the PFC contrast agent within the tumor microenvironment, 4T1 cell-derived tumor-bearing animals were administered a commixture of PFC-NIR and VS-580H-DM Red (subsequently referred to as PFC-Red in the text), enabling confocal fluorescence microscopy and cytofluorometric analysis. Seventy-two hours later, tumors were resected and cryopreserved, and a portion of each lesion was enzymatically and mechanically digested to prepare single-cell suspensions for flow cytometry. In each case, antibodies recognizing CD11b, Gr-1 and F4/80 were employed to identify the cellular subsets that had taken up the contrast agent. As shown in Figure 6, cells with a phenotype consistent with that of myeloid-derived suppressor cells (MDSCs, CD11b+F4/80lowGr-1low) represented the main cell population labeled with the contrast agent at the tumor site.

Figure 6. PFC probe within tumor infiltrates is retained in cells with a myeloid-derived suppressor cell-like phenotype (CD11b+F480lowGr-1low). (A and B) Tumor-bearing mice were administered with the PFC-NIR agent and an equivalent dose of PFC-Red, containing a red fluorescent moiety. After 72 h and confirmatory in vivo imaging of the NIR signal, animals were sacrificed and tumors were isolated for further analysis. Single-cell suspensions obtained from tumors were labeled with antibodies specific CD11b, Gr-1 and F4/80. (A) Average frequencies of cells expressing the indicated markers in tumor extracts, error bars represent the standard deviation. (B) Average frequency of Gr-1+, F4/80+ or CD11b+ cells containing the PFC-Red label. (C) Evaluation of cell populations obtained from tumors in control animals (no contrast agent, gated on live cells by forward and side scatter) or contrast agent-treated animals (gated on live, PFC-Red+ cells) using multicolor flow cytometry. One representative tumor isolate for each group is shown. The cellular populations of contrast agent-treated animals gated on live cells only were similar to those observed in animals not receiving the contrast agent.
To confirm that the PFC probe resided within cells at the tumor site, the cryopreserved portion of each tumor was evaluated with confocal microscopy. Figure 7 displays typical images of tumor sections, revealing the localization of the PFC-Red signal within cells, rather than to the interstitial space. Our results hence indicate that the PFC probe accumulate at the tumor site within MDSC-like cells.
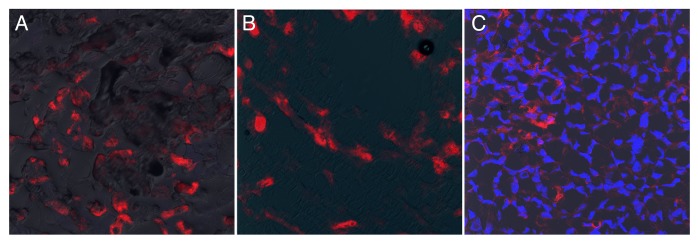
Figure 7. The PFC probe is located within cells at the tumor site. (A–C) Confocal microscopy was performed on portions of the tumors examined in Figure 6. Evaluation of samples was performed directly after cryosectioning and mounting (A) or mounting with gelvatol (B), to prevent any potential loss of the probe from tissue sections. In (C), Hoechst 33342 was added to stain nuclei and aid in the visualization of cells. Each image represents merged overlays of the PFC-Red on DiC (A and B) or Hoechst 33342 (C). All photomicrographs were taken with a 20X objective.
Discussion
This work employs a nanoemulsion probe known to accrue at sites of inflammation,30,34 loaded with two imaging moieties: a PFC moiety optimized for MRI and an NIR dye for in vivo fluorescence assessments. To the best of our knowledge, this work is the first to employ 19F MRI and optical imaging techniques to detect inflammation-associated cells in a tumor model. The main result of this work is that our reagent, which was designed for the in situ uptake by cells involved in the inflammatory response, can be used to non-invasively image the tumor microenvironment. Tumors are indeed specifically labeled via tumor-infiltrating host cells.
Fluorescence-coupled iron oxide nanoparticles, which also label phagocytic cells of the immune system, have been used to study the tumor microenvironment. A mix of microscopic (cellular resolution) and whole-animal imaging methods were used to investigate the distribution of the reagent,41,42 the route of accumulation at the tumor site,43 and examples of the complex interplay between host and tumor cells.44,45 The optical imaging of an unrelated, integrin-targeting PFC-NIR formulation has previously been used to study tumor vasculature.46 Fluorine-based MRI has also previously been used to investigate tumors, but a microscopic evaluation of the cellular distribution of the reagent was not performed.47 The magnetic relaxation of some PFCs is sensitive to the oxygen content of surrounding tissue, and several investigators have studied oxygen content within the tumor in a non-invasive fashion.48-51 Changes in the tumor vasculature have also been studied using 19F MRI.52,53 Here, through the inclusion of an optical moiety in a 19F MRI probe,25-34 information at both the cellular and systemic levels was obtained.
The MRI and optical measurements correlated very well, and the benefits of using both measurements can be discerned by the data presented here. Indeed, whole-body optical measurements, while being rapid and relatively straightforward, lack the level of detail, the precise quantitative nature and the tissue-depth independence of MRI images. While advances in optical imaging have increased the attainable level of details and have allowed for the tomographic computation of three-dimensional images, the scarce penetration of light into tissue remains a consistent limit to this approach. As determined ex vivo, with harvested tissues that were imaged directly in the light path, overall measurements obtained with 19F NMR and fluorescence correlate rather well (R = 0.86). However, some extent of tissue-dependence can still be observed. The demonstrated advantage of incorporating MRI mainly resides in the observation of a specific 19F signal localized at the margin of the tumor. We hypothesize that this may represent the invasive front of the growing tumor, where inflammatory cells are particularly active as they are involved in stromal remodeling. Indeed, in some highly invasive tumors, large numbers of Gr-1+CD11b+ cells, secreting the pro-invasive factor cathepsin B, are found at the leading edge of tumor margins.54 Alternatively, such areas of intense signal could represent regions of intense cell trafficking from the vasculature.
A weakness of this study is that 19F NMR and 19F MRI assessments were only conducted as end-point determinations, while optical imaging was performed in a kinetic fashion. However, the strong correlation observed between the two data sets at the end point suggests that data obtained by detecting the 19F portion of the probe at earlier time points would be similar to those acquired by optical detection and also lends confidence to the integrity of the reagent in vivo. Moreover, while this dual-mode agent is likely to enable the detection of other tumor types at various anatomical locations, the precise cellular reservoir of the probe in such settings should be confirmed, as multiple myeloid cell types display a robust phagocytic activity and our label is not specific for MDSCs. Future studies will include the development of a targeted reagent to label specific cell populations.55 While previous reports have demonstrated the accumulation of similar PFC contrast agents in macrophages,30,32,34 we observed a relatively low number of mature, F4/80high macrophages within the tumor microenvironment. In addition, in vitro experiments showed that tumor cells take up very little of the probe, while phagocytes are highly labeled. Attempts to analyze the uptake of the PFC-NIR agent in cell subsets by immunofluorescence was not possible, as the probe is sensitive to common reagents used in the processing of cryosections and paraffin-embedded sections (data not shown). As such, a triple-labeled probe, containing both a visible and a NIR moiety was used to investigate the distribution of the reagent at the tumor site. Fluorescent confocal microscopy revealed the localization of the probe within cells in the tumor microenvironment. The evaluation of single-cell suspensions with flow cytometry revealed that the cells in which our probe preferentially accumulate exhibit a MDSC-like phenotype. Although functional test were not conducted on labeled cells in this study, MDSCs have been previously observed in association with murine breast carcinomas including 4T1-derived lesions, as well as in human breast carcinoma patients.56-60 MDSCs can be evoked during inflammatory responses to cancer,61,62 contribute to the evasion of immunosurveillance,63 have been associated with breast cancer progression,60 and are being investigated as novel therapeutic targets.59
The existence of a method for non-invasively imaging cells involved in the host inflammatory response to tumors might facilitate the study of anti-inflammatory drugs as tumor-suppressing agents. Alternatively, this dual-mode contrast probe might be combined to therapeutic agents to specifically target MDSC-like cells in the tumor microenvironment while providing a means for monitoring the delivery of the drug and the therapeutic response.64
Conclusions
Here, we have shown a novel dual-mode imaging agent that allowed for the rapid and straightforward NIR detection as well as for the quantitative three-dimensional visualization by MRI of MDSC-like cells in the tumor microenvironment in vivo. Inflammation-associated tumor-infiltrating cells were detectable well above the noise in NIR, NMR and MRI modalities and the uptake of the reagent in non-RES organs was minimal. This dual-mode probe has great potential to serve as a surrogate marker for the presence of cellular infiltrates that are important in the interplay between tumor and host cells. Future studies may develop the use of 19F MRI and NIR spectroscopy to monitor changes in the tumor inflammatory milieu in vivo, for instance in response to therapeutic interventions that target immunoevasion.
Materials and Methods
Contrast agent characterization
The PFC-NIR agent was developed as a NIR fluorescent version of the commercially available V-Sense 580H (Celsense, Inc.), a sterile 19F MRI contrast agent. PFC-NIR incorporates an optical probe (excitation max 750 nm, emission max 780 nm) and is stored at 2–8 °C. In some studies, VS-580H-DM Red, which incorporates a red fluorescent dye (excitation max 549 nm, emission max 565 nm) was commixed with the PFC-NIR immediately prior to administration to provide a third mode of detection in the visible optical range.
The resulting PFC-NIR emulsion was further characterized as to the resulting average particle size distribution using a 1:20 dilution in 0.1 µm-filtered sterile water using dynamic light scattering on a Malvern Zetasizer. Serum stability was evaluated through comparison of particle size after incubation (in sealed glass vials at 37°C) of a 1:20 dilution in water (as above), DMEM (CellGro) and DMEM supplemented with 10% fetal bovine serum (FBS, CellGro). Particle size was followed throughout the experimental time course. Emulsion z-potential was measured using the same Zetasizer hardware and a -15.5 mV potential.
Spectral analysis of the reagent was performed on a 1:100 dilution in a Tecan fluorescence spectrophotometer. The correlation between the optical and 19F NMR signals was tested via serial dilution of reagent in water and consecutive measurement of fluorescence via the Odyssey Imager (Li-Cor) and 19F NMR (see below).
Cell lines
Cell lines purchased from the American Type Cell Culture (ATCC) for use in these studies included 4T1, a murine breast carcinoma cell line, and RAW 264.7, a murine macrophage cell line. Cells were maintained in complete media (CM) consisting of DMEM (RAW 264.7 cells) or RPMI 1640 medium (4T1), supplemented with FBS, penicillin, streptomycin and L-glutamine (Lonza). For passaging 4T1 cells, 0.05% (w/v) trypsin / 0.53 mM EDTA solution in Hank’s balanced salt solution (Mediatch, Inc.) was used to disrupt subconfluent monolayer cultures, which were subsequently washed by centrifugation prior to propagation or use in experiments.
Animals and tumor models
Six to eight week old female (virus-free certified) BALB/c mice were purchased from Charles River Laboratories International Inc. and housed in the Duquesne University Animal Care Facility. Animals were maintained on Lab Diet 5015 (Purina). All the handling of animals was in accordance to protocols approved by the Duquesne University Institutional Animal Care and Use Committee. 4T1 cells in the exponential growth phase (between passages 5 to 14) were harvested, washed and suspended in sterile saline at a concentration of 5 × 10⁶/mL. Using a 25 gauge needle, 0.5 × 10⁶ tumor cells in 0.1 mL DPBS were inoculated s.c. into the flank and mice were used when tumor size reach about 0.5 cm2 (approximately 1 week after inoculation).
In vivo fluorescent imaging
Mice were anesthetized under 3% (v/v) isoflurane for the following procedures. The hair on the ventral side was shorn to minimize interference with fluorescent imaging. Two-hundred µL of the PFC-NIR nanoemulsion was injected via the tail vein into 4T1-tumor bearing mice and non-tumor bearing controls. Animals were closely observed for any toxicity or adverse effects following the administration of the novel contrast agent. Prior to the injection of the contrast agent and at predetermined time points up to 72 hours, mice were scanned using a Pearl Impulse Imager (Li-Cor, Inc.) at a resolution of 170 µm. The fluorescent signal from NIR probe was quantified by the Li-Cor Pearl Impulse software.
Ex vivo fluorescence imaging of tissues and quantification
At the end of in vivo NIR imaging sessions, mice were sacrificed and the tumor tissue and major organs (liver, spleen, kidneys, lungs, heart, brain and lymph nodes) were excised and fixed in 10% formalin solution. The NIR signal from excised tissues was then measured with an Odyssey Imager (Li-Cor, Inc.) with an intensity of 0.5 and a focal distance of 3.5 mm. Signal intensity was quantified by the Li-Cor Odyssey software. Background levels were established by those measured in organs from mice which did not receive contrast agent. Controls included tumor-bearing mice which did not receive the contrast agent as well as tumor-free mice which did receive the contrast agent.
Ex vivo NMR of intact tissues and quantification
Following fluorescence analyses, tissues were weighed and placed intact into 10 mm NMR tubes (Wilmad Labglass) with PBS and deuterium oxide (Arcos Organics, for instrumentation locking). Tissue material was restricted to a length in the NMR tube that fit entirely into the homogeneous field region of the NMR spectrometer. A sealed, chemically shifted external reference compound (Celsense, Inc.) was added to each tube for quantification purposes. One dimensional 19F NMR spectra were obtained on a Bruker Avance 500MHz system, with a 10 mM BBO dual-nuclei tunable probe, using a delay time of 5 seconds and 256 averages. Data collection was automated using a sample changer and Topshim (Bruker Biospin) software. Lymph nodes were processed similarly, but in 5mm NMR tubes (Wilmad Labglass), and run using the appropriate probe, a delay time of 5s and 64 averages. Resulting spectra contained a peak at approximately -76 ppm for the reference and -92 ppm for the PFC contrast agent. 19F content in each tissue (or cell pellet, see below) was calculated by comparing the relative signal intensity of the two peaks and normalizing to the known fluorine content of the reference as previously described.34
MRI
MRI was performed post-mortem using a Bruker Biospec AV3 7-T/21-cm system (Bruker Biospin MRI) and a 72-mm birdcage coil with a tuning range spanning 282 to 300 MHz (19F to 1H resonance frequencies, respectively). Two mice were imaged in the same session. Mice were placed side-by-side and positioned in the magnet. Following 1H pilot scans, the RF coil was retuned and the resonance frequency was adjusted to the PFC signal. Mice were first imaged using a Rapid Acquisition with Relaxation Enhancement (RARE) sequence and a coronal geometry with a slice thickness spanning the mice (TR/TE = 2000/7 ms, RARE factor = 16, 80 × 80 mm FOV, 256 × 256 matrix and 25 mm slice thickness, NA = 32). This projection image confirmed signal intensity and location. Mice were then imaged using a 3D RARE with 0.5 mm isotropic resolution (TR/TE = 1000/6.5 ms, RARE factor = 16, 80 x 64 x 32 mm FOV, 160 x 128 x 32 matrix, NA = 32). For anatomical reference, a 1H 3D RARE with the same FOV was also collected (TR/TE = 100/7.5, RARE factor = 4, 80 × 64 × 32 mm FOV, 320 × 256 ×128 matrix, NA = 2). Since the resonance frequencies were precisely centered on the water and PFC resonances, 19F and 1H anatomical images were co-registered without additional image processing. The 19F images were rendered in color (“hot-iron” LUT, ParaVision 5.1). 19F/1H composite images were generated using Adobe Photoshop CS3 by selecting pixels containing 19F signal and overlaying them on the 1H anatomical images.
PFC-NIR uptake and viability studies
RAW 247.1 cells (passage 3–7) and 4T1 cells were seeded at approximately 104 per cm2. Following an adaptation time, the PFC-NIR agent was directly added to the culture media, and cells were incubated at 37°C, 100% relative humidity and 5% CO2. Finally, excess reagent was washed out, cells were trypsinized, washed and viability was assessed by Trypan blue exclusion and light microscopy or by flow cytometry (see below).
The uptake of the PFC-NIR agent by cells was assessed by flow cytometry (see below). For adherent 4T1 cells, PFC-NIR uptake was also assessed using quantitative NMR spectroscopy of lysed cell pellets, similar to the tissue methods described above.
Flow cytometry–Viability studies
After labeling with PFC-NIR, cells were washed in FACS buffer (BD Bioscience) then incubated with calcein AM (Invitrogen) and a 1:10 dilution of 7-AAD (BD Biosciences) for 15 min in the dark at 4°C prior to analysis by flow cytometry.
Flow cytometry–Label uptake and detection of PFC-NIR
Flow cytometry was performed using a modified BD FACSCalibur acquisition system, effectively using a long-pass filter in the fourth channel (633 nm excitation) which allowed for the specific detection of the PFC-NIR probe in channel FL4.
Flow cytometry–Tumor digestion and multicolor analysis
Seventy-two hrs after mice were administered the triple-mode contrast agent (PFC-NIR-Red) or vehicle control, tumors were mechanically separated and enzymatically digested in 10 mg/mL Type I collagen (Sigma) in HBSS for 1.5 hours at 37°C, then sieved through a 70 µm cell strainer and washed in PBS to generate single-cell suspensions. The following antibodies and secondary detectors were used (all from eBioscience): FITC-conjugated or biotinylated anti-Gr-1 (Ly6C, clone RB6–8C5), FITC-conjugated anti-F4/80 (clone BM8), biotinylated anti-CD11b (clone M1/70), FITC-conjugated rat isotype controls and streptavidin-PerCP (BD Biosciences). All incubations were performed on ice in the dark. To prevent non-specific Fc receptor binding, cells were incubated with anti-mouse CD16/CD32 antibodies (clone 93, eBioscience) for 10 min prior to the addition of other antibodies (used at 10 µg/mL), without an intervening washing step. Primary antibodies were incubated with cells for 20 min, cells were washed twice in FACS buffer, and then streptavidin-PerCP was added for additional 20 min. Cells were finally washed twice and analyzed by flow cytometry. The red fluorescence of the PFC-NIR-Red was detected in the FL2 channel, while FL1 and FL3 were used to detect the FITC and PerCP signals, respectively.
Microscopy analysis of tissue sections
Tumors were fixed in 4% paraformaldehyde, placed in OCT media, snap frozen in liquid nitrogen and stored at −80°C. Cryostat sections (5 μm) were then generated, mounted on glass coverslips and observed using a Olympus Fluoview 1000 confocal microscope (software version 1.7a). Further processing or staining lead to significant decreases in the PFC-NIR signal, confounding image interpretation (data not shown).
Statistical analysis
Student’s t-tests were used to make comparisons between groups. p values < 0.05 were considered significant. Unless otherwise specified, error bars in all figures represent the standard deviation of the mean (SEM).
Supplementary Material
Acknowledgments
We note that A.B. and Y.W. made equal contributions. NIR optical imaging was performed on Pearl® Small Animal Imaging System (Li-COR Biosciences) at Duquesne University (Supported by Pittsburgh Tissue Engineering Initiative Seed Grant). MRI was performed at Pittsburgh NMR Center for Biomedical Research funded by National Institutes of Health (P41 EB001977). J.M.J. acknowledges support from the National Institutes of Health (R41-EB009618), Commonwealth Universal Research Enhancement (C.U.R.E.) program from the Pennsylvania Department of Health and Duquesne University Faculty Development Funds. W.S.M. and J.M.J. acknowledge support from the National Institutes of Health (R15-AI081218). A.K.W. acknowledges support from National Institutes of Health (R01-CA134633). Special thanks go to Gayathri Withers and Sravan Patel for NMR measurements, performed at the NMR Facility of the Department of Chemistry, Carnegie Mellon University. We also thank Mark Ross for histological analysis (sectioning, staining and photomicrography), in the Center for Biological Imaging, University of Pittsburgh. Also thanks to Michael Patrick, of the Molecular Biosensor and Imaging Center at Carnegie-Mellon University, for help with the spectral analysis of the reagent.
Glossary
Abbreviations:
- 7-AAD
7-aminoactinomycin D
- AU
arbitrary unit
- DLS
dynamic light scattering
- FBS
fetal bovine serum
- FITC
fluorescein isothiocyanate
- MDSC
myeloid-derived suppressor cell
- MFI
mean fluorescence intensity
- MRI
magnetic resonance imaging
- NIR
near infrared
- NMR
nuclear magnetic resonance
- PDI
poly dispersity index
- PerCP
peridinin chlorophyll protein complex
- PFC
perfluorocarbon
- RES
reticuloendothelial system
- SPIO
superparamagnetic iron-oxide
Supplemental Materials
Supplemental materials may be found here: www.landesbioscience.com/journals/oncoimmunology/article/23034
Footnotes
Previously published online: www.landesbioscience.com/journals/oncoimmunology/article/23034
References
- 1.Mbeunkui F, Johann DJ., Jr. Cancer and the tumor microenvironment: a review of an essential relationship. Cancer Chemother Pharmacol. 2009;63:571–82. doi: 10.1007/s00280-008-0881-9. [DOI] [PMC free article] [PubMed] [Google Scholar]
- 2.Ben-Baruch A. Host microenvironment in breast cancer development: inflammatory cells, cytokines and chemokines in breast cancer progression: reciprocal tumor-microenvironment interactions. Breast Cancer Res. 2003;5:31–6. doi: 10.1186/bcr554. [DOI] [PMC free article] [PubMed] [Google Scholar]
- 3.Lewis CE, Pollard JW. Distinct role of macrophages in different tumor microenvironments. Cancer Res. 2006;66:605–12. doi: 10.1158/0008-5472.CAN-05-4005. [DOI] [PubMed] [Google Scholar]
- 4.Movahedi K, Laoui D, Gysemans C, Baeten M, Stangé G, Van den Bossche J, et al. Different tumor microenvironments contain functionally distinct subsets of macrophages derived from Ly6C(high) monocytes. Cancer Res. 2010;70:5728–39. doi: 10.1158/0008-5472.CAN-09-4672. [DOI] [PubMed] [Google Scholar]
- 5.Erreni M, Mantovani A, Allavena P. Tumor-associated Macrophages (TAM) and Inflammation in Colorectal Cancer. Cancer Microenviron. 2011;4:141–54. doi: 10.1007/s12307-010-0052-5. [DOI] [PMC free article] [PubMed] [Google Scholar]
- 6.Lathia JD, Heddleston JM, Venere M, Rich JN. Deadly teamwork: neural cancer stem cells and the tumor microenvironment. Cell Stem Cell. 2011;8:482–5. doi: 10.1016/j.stem.2011.04.013. [DOI] [PMC free article] [PubMed] [Google Scholar]
- 7.Augsten M, Hägglöf C, Peña C, Ostman A. A digest on the role of the tumor microenvironment in gastrointestinal cancers. Cancer Microenviron. 2010;3:167–76. doi: 10.1007/s12307-010-0040-9. [DOI] [PMC free article] [PubMed] [Google Scholar]
- 8.Leek RD, Lewis CE, Whitehouse R, Greenall M, Clarke J, Harris AL. Association of macrophage infiltration with angiogenesis and prognosis in invasive breast carcinoma. Cancer Res. 1996;56:4625–9. [PubMed] [Google Scholar]
- 9.Lewis CE, Leek R, Harris A, McGee JO. Cytokine regulation of angiogenesis in breast cancer: the role of tumor-associated macrophages. J Leukoc Biol. 1995;57:747–51. doi: 10.1002/jlb.57.5.747. [DOI] [PubMed] [Google Scholar]
- 10.Condeelis J, Pollard JW. Macrophages: obligate partners for tumor cell migration, invasion, and metastasis. Cell. 2006;124:263–6. doi: 10.1016/j.cell.2006.01.007. [DOI] [PubMed] [Google Scholar]
- 11.Pollard JW. Macrophages define the invasive microenvironment in breast cancer. J Leukoc Biol. 2008;84:623–30. doi: 10.1189/jlb.1107762. [DOI] [PMC free article] [PubMed] [Google Scholar]
- 12.Allavena P, Sica A, Solinas G, Porta C, Mantovani A. The inflammatory micro-environment in tumor progression: the role of tumor-associated macrophages. Crit Rev Oncol Hematol. 2008;66:1–9. doi: 10.1016/j.critrevonc.2007.07.004. [DOI] [PubMed] [Google Scholar]
- 13.Coussens LM, Werb Z. Inflammation and cancer. Nature. 2002;420:860–7. doi: 10.1038/nature01322. [DOI] [PMC free article] [PubMed] [Google Scholar]
- 14.Forssell J, Öberg Å, Henriksson ML, Stenling R, Jung A, Palmqvist R. High macrophage infiltration along the tumor front correlates with improved survival in colon cancer. Clin Cancer Res. 2007;13:1472–9. doi: 10.1158/1078-0432.CCR-06-2073. [DOI] [PubMed] [Google Scholar]
- 15.Fidler IJ, Barnes Z, Fogler WE, Kirsh R, Bugelski P, Poste G. Involvement of macrophages in the eradication of established metastases following intravenous injection of liposomes containing macrophage activators. Cancer Res. 1982;42:496–501. [PubMed] [Google Scholar]
- 16.Bingle L, Brown NJ, Lewis CE. The role of tumour-associated macrophages in tumour progression: implications for new anticancer therapies. J Pathol. 2002;196:254–65. doi: 10.1002/path.1027. [DOI] [PubMed] [Google Scholar]
- 17.Galon J, Costes A, Sanchez-Cabo F, Kirilovsky A, Mlecnik B, Lagorce-Pagès C, et al. Type, density, and location of immune cells within human colorectal tumors predict clinical outcome. Science. 2006;313:1960–4. doi: 10.1126/science.1129139. [DOI] [PubMed] [Google Scholar]
- 18.Allavena P, Garlanda C, Borrello MG, Sica A, Mantovani A. Pathways connecting inflammation and cancer. Curr Opin Genet Dev. 2008;18:3–10. doi: 10.1016/j.gde.2008.01.003. [DOI] [PubMed] [Google Scholar]
- 19.Hillman EM, Amoozegar CB, Wang T, McCaslin AF, Bouchard MB, Mansfield J, et al. In vivo optical imaging and dynamic contrast methods for biomedical research. Philos Transact A Math Phys Eng Sci. 2011;369:4620–43. doi: 10.1098/rsta.2011.0264. [DOI] [PMC free article] [PubMed] [Google Scholar]
- 20.Daldrup-Link H, Coussens LM. MR imaging of tumor-associated macrophages. Oncoimmunology. 2012;1:507–9. doi: 10.4161/onci.19456. [DOI] [PMC free article] [PubMed] [Google Scholar]
- 21.Arbab AS, Liu W, Frank JA. Cellular magnetic resonance imaging: current status and future prospects. Expert Rev Med Devices. 2006;3:427–39. doi: 10.1586/17434440.3.4.427. [DOI] [PubMed] [Google Scholar]
- 22.Verdijk P, Scheenen TW, Lesterhuis WJ, Gambarota G, Veltien AA, Walczak P, et al. Sensitivity of magnetic resonance imaging of dendritic cells for in vivo tracking of cellular cancer vaccines. Int J Cancer. 2007;120:978–84. doi: 10.1002/ijc.22385. [DOI] [PubMed] [Google Scholar]
- 23.Ahrens ET, Flores R, Xu H, Morel PA. In vivo imaging platform for tracking immunotherapeutic cells. Nat Biotechnol. 2005;23:983–7. doi: 10.1038/nbt1121. [DOI] [PubMed] [Google Scholar]
- 24.Janjic JM, Srinivas M, Kadayakkara DK, Ahrens ET. Self-delivering nanoemulsions for dual fluorine-19 MRI and fluorescence detection. J Am Chem Soc. 2008;130:2832–41. doi: 10.1021/ja077388j. [DOI] [PubMed] [Google Scholar]
- 25.Hitchens TK, Ye Q, Eytan DF, Janjic JM, Ahrens ET, Ho C. 19F MRI detection of acute allograft rejection with in vivo perfluorocarbon labeling of immune cells. Magn Reson Med. 2011;65:1144–53. doi: 10.1002/mrm.22702. [DOI] [PMC free article] [PubMed] [Google Scholar]
- 26.Foley LM, Hitchens TK, Melick JA, Ho C, Kochanek PM. 19F imaging assessment of labeled macrophage accumulation in a mouse brain following experimental traumatic brain injury. Proceedings of the 18th Annual Meeting of the International Society for Magnetic Resonance in Medicine; Abstract #5703. [Google Scholar]
- 27.Weise G, Basse-Luesebrink TC, Wessig C, Jakob PM, Stoll G. In vivo imaging of inflammation in the peripheral nervous system by (19)F MRI. Exp Neurol. 2011;229:494–501. doi: 10.1016/j.expneurol.2011.03.020. [DOI] [PubMed] [Google Scholar]
- 28.Weise G, Basse-Lüsebrink TC, Kleinschnitz C, Kampf T, Jakob PM, Stoll G. In vivo imaging of stepwise vessel occlusion in cerebral photothrombosis of mice by 19F MRI. PLoS One. 2011;6:e28143. doi: 10.1371/journal.pone.0028143. [DOI] [PMC free article] [PubMed] [Google Scholar]
- 29.Hertlein T, Sturm V, Kircher S, Basse-Lüsebrink T, Haddad D, Ohlsen K, et al. Visualization of abscess formation in a murine thigh infection model of Staphylococcus aureus by 19F-magnetic resonance imaging (MRI) PLoS One. 2011;6:e18246. doi: 10.1371/journal.pone.0018246. [DOI] [PMC free article] [PubMed] [Google Scholar]
- 30.Kadayakkara DK, Ranganathan S, Young W-B, Ahrens ET. Assaying macrophage activity in a murine model of inflammatory bowel disease using fluorine-19 MRI. Lab Invest. 2012;92:636–45. doi: 10.1038/labinvest.2012.7. [DOI] [PMC free article] [PubMed] [Google Scholar]
- 31.Ebner B, Behm P, Jacoby C, Burghoff S, French BA, Schrader J, et al. Early assessment of pulmonary inflammation by 19F MRI in vivo. Circ Cardiovasc Imaging. 2010;3:202–10. doi: 10.1161/CIRCIMAGING.109.902312. [DOI] [PMC free article] [PubMed] [Google Scholar]
- 32.Flögel U, Ding Z, Hardung H, Jander S, Reichmann G, Jacoby C, et al. In vivo monitoring of inflammation after cardiac and cerebral ischemia by fluorine magnetic resonance imaging. Circulation. 2008;118:140–8. doi: 10.1161/CIRCULATIONAHA.107.737890. [DOI] [PMC free article] [PubMed] [Google Scholar]
- 33.Flögel U, Su S, Kreideweiss I, Ding Z, Galbarz L, Fu J, et al. Noninvasive detection of graft rejection by in vivo (19) F MRI in the early stage. Am J Transplant. 2011;11:235–44. doi: 10.1111/j.1600-6143.2010.03372.x. [DOI] [PubMed] [Google Scholar]
- 34.Ahrens ET, Young WB, Xu H, Pusateri LK. Rapid quantification of inflammation in tissue samples using perfluorocarbon emulsion and fluorine-19 nuclear magnetic resonance. Biotechniques. 2011;50:229–34. doi: 10.2144/000113652. [DOI] [PMC free article] [PubMed] [Google Scholar]
- 35.Flögel U, Ding Z, Hardung H, Jander S, Reichmann G, Jacoby C, et al. In vivo monitoring of inflammation after cardiac and cerebral ischemia by fluorine magnetic resonance imaging. Circulation. 2008;118:140–8. doi: 10.1161/CIRCULATIONAHA.107.737890. [DOI] [PMC free article] [PubMed] [Google Scholar]
- 36.Helfer BM, Balducci A, Nelson AD, Janjic JM, Gil RR, Kalinski P, et al. Functional assessment of human dendritic cells labeled for in vivo (19)F magnetic resonance imaging cell tracking. Cytotherapy. 2010;12:238–50. doi: 10.3109/14653240903446902. [DOI] [PMC free article] [PubMed] [Google Scholar]
- 37.Helfer BM, Balducci A, Sadeghi Z, O’Hanlon C, Hijaz A, Flask CA, et al. (19)F MRI tracer preserves in vitro and in vivo properties of hematopoietic stem cells. Cell Transplant. 2012 doi: 10.3727/096368912X653174. [DOI] [PMC free article] [PubMed] [Google Scholar]
- 38.Lowe KC. Engineering blood: synthetic substitutes from fluorinated compounds. Tissue Eng. 2003;9:389–99. doi: 10.1089/107632703322066570. [DOI] [PubMed] [Google Scholar]
- 39.Srinivas M, Turner MS, Janjic JM, Morel PA, Laidlaw DH, Ahrens ET. In vivo cytometry of antigen-specific t cells using 19F MRI. Magn Reson Med. 2009;62:747–53. doi: 10.1002/mrm.22063. [DOI] [PMC free article] [PubMed] [Google Scholar]
- 40.Ahrens ET, Young W-B, Xu H, Pusateri L. High-throughput quantification of inflammation in intact tissue using perfluorocarbon emulsions and fluorine-19 nuclear magnetic resonance. Biotechniques Methods. 2011 In press. [Google Scholar]
- 41.Moore A, Marecos E, Bogdanov A, Jr., Weissleder R. Tumoral distribution of long-circulating dextran-coated iron oxide nanoparticles in a rodent model. Radiology. 2000;214:568–74. doi: 10.1148/radiology.214.2.r00fe19568. [DOI] [PubMed] [Google Scholar]
- 42.Melancon MP, Lu W, Huang Q, Thapa P, Zhou D, Ng C, et al. Targeted imaging of tumor-associated M2 macrophages using a macromolecular contrast agent PG-Gd-NIR813. Biomaterials. 2010;31:6567–73. doi: 10.1016/j.biomaterials.2010.05.001. [DOI] [PMC free article] [PubMed] [Google Scholar]
- 43.Leimgruber A, Berger C, Cortez-Retamozo V, Etzrodt M, Newton AP, Waterman P, et al. Behavior of endogenous tumor-associated macrophages assessed in vivo using a functionalized nanoparticle. Neoplasia. 2009;11:459–68. doi: 10.1593/neo.09356. [DOI] [PMC free article] [PubMed] [Google Scholar]
- 44.Kremer S, Pinel S, Védrine PO, Bressenot A, Robert P, Bracard S, et al. Ferumoxtran-10 enhancement in orthotopic xenograft models of human brain tumors: an indirect marker of tumor proliferation? J Neurooncol. 2007;83:111–9. doi: 10.1007/s11060-006-9260-8. [DOI] [PubMed] [Google Scholar]
- 45.Shih YY, Hsu YH, Duong TQ, Lin SS, Chow KP, Chang C. Longitudinal study of tumor-associated macrophages during tumor expansion using MRI. NMR Biomed. 2011;24:1353–60. doi: 10.1002/nbm.1698. [DOI] [PMC free article] [PubMed] [Google Scholar]
- 46.Akers WJ, Zhang Z, Berezin M, Ye Y, Agee A, Guo K, et al. Targeting of alpha(nu)beta(3)-integrins expressed on tumor tissue and neovasculature using fluorescent small molecules and nanoparticles. Nanomedicine (Lond) 2010;5:715–26. doi: 10.2217/nnm.10.38. [DOI] [PMC free article] [PubMed] [Google Scholar]
- 47.Diou O, Tsapis N, Giraudeau C, Valette J, Gueutin C, Bourasset F, et al. Long-circulating perfluorooctyl bromide nanocapsules for tumor imaging by 19FMRI. Biomaterials. 2012;33:5593–602. doi: 10.1016/j.biomaterials.2012.04.037. [DOI] [PubMed] [Google Scholar]
- 48.Mason RP, Antich PP, Babcock EE, Gerberich JL, Nunnally RL. Perfluorocarbon imaging in vivo: a 19F MRI study in tumor-bearing mice. Magn Reson Imaging. 1989;7:475–85. doi: 10.1016/0730-725X(89)90402-5. [DOI] [PubMed] [Google Scholar]
- 49.Zhao D, Jiang L, Hahn EW, Mason RP. Comparison of 1H blood oxygen level-dependent (BOLD) and 19F MRI to investigate tumor oxygenation. Magn Reson Med. 2009;62:357–64. doi: 10.1002/mrm.22020. [DOI] [PMC free article] [PubMed] [Google Scholar]
- 50.Fishman JE, Joseph PM, Carvlin MJ, Saadi-Elmandjra M, Mukherji B, Sloviter HA. In vivo measurements of vascular oxygen tension in tumors using MRI of a fluorinated blood substitute. Invest Radiol. 1989;24:65–71. doi: 10.1097/00004424-198901000-00014. [DOI] [PubMed] [Google Scholar]
- 51.Longmaid HE, 3rd, Adams DF, Neirinckx RD, Harrison CG, Brunner P, Seltzer SE, et al. In vivo 19F NMR imaging of liver, tumor, and abscess in rats. Preliminary results. Invest Radiol. 1985;20:141–5. doi: 10.1097/00004424-198503000-00009. [DOI] [PubMed] [Google Scholar]
- 52.Meyer KL, Joseph PM, Mukherji B, LiVolsi VA, Lin R, Phelan-Belfield M, et al. Demonstration of differences in vascular permeability in experimental tumors by use of 19F magnetic resonance imaging. Acad Radiol. 1994;1:106–13. doi: 10.1016/S1076-6332(05)80827-X. [DOI] [PubMed] [Google Scholar]
- 53.Ceckler TL, Gibson SL, Hilf R, Bryant RG. In situ assessment of tumor vascularity using fluorine NMR imaging. Magn Reson Med. 1990;13:416–33. doi: 10.1002/mrm.1910130309. [DOI] [PubMed] [Google Scholar]
- 54.Shchors K, Nozawa H, Xu J, Rostker F, Swigart-Brown L, Evan G, et al. Increased invasiveness of MMP-9-deficient tumors in two mouse models of neuroendocrine tumorigenesis. Oncogene. 2012 doi: 10.1038/onc.2012.60. [DOI] [PubMed] [Google Scholar]
- 55.Wickline SA, Neubauer AM, Winter PM, Caruthers SD, Lanza GM. Molecular imaging and therapy of atherosclerosis with targeted nanoparticles. J Magn Reson Imaging. 2007;25:667–80. doi: 10.1002/jmri.20866. [DOI] [PubMed] [Google Scholar]
- 56.Morales JK, Kmieciak M, Graham L, Feldmesser M, Bear HD, Manjili MH. Adoptive transfer of HER2/neu-specific T cells expanded with alternating gamma chain cytokines mediate tumor regression when combined with the depletion of myeloid-derived suppressor cells. Cancer Immunol Immunother. 2009;58:941–53. doi: 10.1007/s00262-008-0609-z. [DOI] [PMC free article] [PubMed] [Google Scholar]
- 57.Morales JK, Kmieciak M, Knutson KL, Bear HD, Manjili MH. GM-CSF is one of the main breast tumor-derived soluble factors involved in the differentiation of CD11b-Gr1- bone marrow progenitor cells into myeloid-derived suppressor cells. Breast Cancer Res Treat. 2010;123:39–49. doi: 10.1007/s10549-009-0622-8. [DOI] [PMC free article] [PubMed] [Google Scholar]
- 58.DuPre’ SA, Hunter KW., Jr. Murine mammary carcinoma 4T1 induces a leukemoid reaction with splenomegaly: association with tumor-derived growth factors. Exp Mol Pathol. 2007;82:12–24. doi: 10.1016/j.yexmp.2006.06.007. [DOI] [PubMed] [Google Scholar]
- 59.Ko JS, Rayman P, Ireland J, Swaidani S, Li G, Bunting KD, et al. Direct and differential suppression of myeloid-derived suppressor cell subsets by sunitinib is compartmentally constrained. Cancer Res. 2010;70:3526–36. doi: 10.1158/0008-5472.CAN-09-3278. [DOI] [PMC free article] [PubMed] [Google Scholar]
- 60.Diaz-Montero CM, Salem ML, Nishimura MI, Garrett-Mayer E, Cole DJ, Montero AJ. Increased circulating myeloid-derived suppressor cells correlate with clinical cancer stage, metastatic tumor burden, and doxorubicin-cyclophosphamide chemotherapy. Cancer Immunol Immunother. 2009;58:49–59. doi: 10.1007/s00262-008-0523-4. [DOI] [PMC free article] [PubMed] [Google Scholar]
- 61.Bunt SK, Clements VK, Hanson EM, Sinha P, Ostrand-Rosenberg S. Inflammation enhances myeloid-derived suppressor cell cross-talk by signaling through Toll-like receptor 4. J Leukoc Biol. 2009;85:996–1004. doi: 10.1189/jlb.0708446. [DOI] [PMC free article] [PubMed] [Google Scholar]
- 62.Gallina G, Dolcetti L, Serafini P, De Santo C, Marigo I, Colombo MP, et al. Tumors induce a subset of inflammatory monocytes with immunosuppressive activity on CD8+ T cells. J Clin Invest. 2006;116:2777–90. doi: 10.1172/JCI28828. [DOI] [PMC free article] [PubMed] [Google Scholar]
- 63.Gabrilovich DI, Ostrand-Rosenberg S, Bronte V. Coordinated regulation of myeloid cells by tumours. Nat Rev Immunol. 2012;12:253–68. doi: 10.1038/nri3175. [DOI] [PMC free article] [PubMed] [Google Scholar]
- 64.O’Hanlon CE, Amede KG, O’Hear MR, Janjic JM. NIR-labeled perfluoropolyether nanoemulsions for drug delivery and imaging. J Fluor Chem. 2012;137:27–33. doi: 10.1016/j.jfluchem.2012.02.004. [DOI] [PMC free article] [PubMed] [Google Scholar]
Associated Data
This section collects any data citations, data availability statements, or supplementary materials included in this article.