Abstract
An assessment of antitumor immunity versus autoimmunity as provoked by the specific depletion of Foxp3+ Tregs is now possible with the development of Foxp3-diphtheria toxin receptor-like transgenic mouse models. We have used the poorly immunogenic B16F10 melanoma model to characterize a very heterogeneous antitumor effect of the immune response induced by Treg depletion. Depletion and neutralization studies demonstrated the importance of host T cells and interferon γ (IFNγ) in mediating the antitumor response developing in Treg-depleted mice. Such a response correlated with increased proliferation of granzyme B- and IFNγ-producing T cells in the tumor. Furthermore, enhanced antitumor immunity modulated the expression of MHC Class I molecules by B16F10 melanoma cells in Treg-depleted mice. Since Foxp3+ Treg depletion induced a significantly heterogeneous antitumor response, for the first time we were able to assess antitumor immunity and autoimmunity across different groups of responding mice. Strikingly, the duration of the tumor-immune system interaction provoked in individual Treg-depleted mice positively correlated with their propensity to develop vitiligo. A rapid complete tumor rejection was not associated with the development of autoimmunity, however, a proportion of mice that suppressed, but did not effectively clear, B16F10 melanoma did develop vitiligo. The significant implication is that approaches that combine with Treg depletion to rapidly reject tumors may also diminish autoimmune toxicities.
Keywords: autoimmunity, effector, immune modulation, suppression, Treg, tumor immunity
Introduction
The histological analysis of tumor-infiltrating immune cells has demonstrated that a high ratio of effector T cells or TH1 cells relative to immunosuppressive cells constitutes a positive prognostic indicator for disease outcome.1 Therefore, the microenvironment fostered by immunosuppressive cells, including regulatory T cells (Tregs) and myeloid-derived suppressor cells (MDSCs), is now recognized as a major obstacle to cancer therapies.2 Studies have indeed demonstrated that the modulation of Tregs or MDSCs may be beneficial to enhance antitumor immunity as mediated by effector immune cells.3-8
While the presence of CD8+ T cells specific for tumor-associated antigens (TAAs) has been demonstrated to constitute a positive prognostic factor for the response to cancer therapies,9,10 TAAs are often similar or identical to self antigens, with the exception of some neo-antigens generated by genetic mutation.11 Hence, therapeutic immune responses can also induce immune system-related adverse effects, including autoimmunity. A key issue is now to understand what kind of antitumor immune response is effective but not associated with considerable degrees of autoimmunity.
Thus far, an assessment of antitumor immunity vs. autoimmunity regulated by Tregs has been limited by a lack of appropriate methods and models. For instance, previous attempts to deplete Tregs using anti-CD4, anti-CD25 or anti-FR4 antibodies did not result in complete Treg depletion and, in addition, some other immune cell populations were affected.8 Recently, the generation of transgenic mouse models expressing a diphtheria toxin receptor (DTR) under the control of the Foxp3 gene promoter (DEREG mice, Foxp3-DTR, or Foxp3.LuciDTR412-14) has allowed for the complete depletion of Foxp3+ Tregs upon the injection of diphtheria toxin A (DTA). This has given researchers an opportunity to assess the question of tumor immunity vs. autoimmunity in a detailed and temporal manner.
Interestingly, we and others have independently demonstrated that the specific depletion of Foxp3+ Tregs in DEREG and Foxp3.LuciDTR4 transgenic mice enhances antitumor responses against various ovalbumin (OVA)-expressing tumors and de novo MCA-induced fibrosarcomas, without the appearance of overt autoimmunity.3,5,7 The absence of autoimmunity in these tumor models is potentially due to the dominance of OVA-specific T cells as induced by OVA-expressing tumors (MC38-OVA, B16-OVA, EG-7) in non-OVA expressing hosts, and the heterogeneous nature of highly mutated and immunogenic de novo MCA-induced fibrosarcomas, which may display relatively strong TAAs.11 Thus, despite a preliminary assessment of a variety of tumor models using mice in which Tregs can be conditionally depleted, no model thus far has produced a spectrum of antitumor responses concomitant with the induction of overt autoimmunity. Based on the poorly immunogenic B16F10 model, we have now established conditions in which both antitumor immunity and autoimmunity can be promoted by the depletion of Tregs. In this setting, we observed a correlation between autoimmunity and prolonged interactions between the tumor and the immune system.
Results
Foxp3+ Treg depletion enhances immune cell infiltration
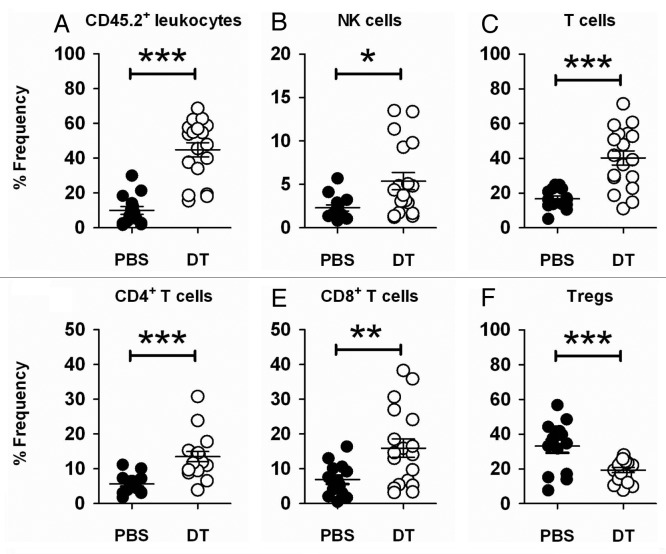
To address the question whether the specific depletion of Foxp3+ Tregs alone might suppress the growth of poorly immunogenic subcutaneous B16F10 melanoma or AT3 mammary carcinoma, we prophylactically depleted Foxp3+ Tregs in DEREG mice before the inoculation of tumor cells. Prophylactic Treg depletion provoked an effective antitumor response against the growth of B16F10 and AT3 tumors (Fig. 1A and B). A weaker, but somewhat effective immune response was also observed when Treg were therapeutically depleted in the same models (data not shown). We decided to focus on the prophylactic B16F10 model since this was the only one we had used to date in which a spectrum of tumor growth responses (rejection, partial suppression and limited efficacy) was observed in individual mice upon Treg depletion (see below). In previous models, strong foreign antigens such as OVA were expressed by tumor cells, and thus rejection responses were generally very rapid and robust.7 To first characterize the mechanisms of immunity generated by Treg depletion in the subcutaneous B16F10 model, we assessed tumor-infiltrating leukocytes (TILs). The suppression of B16F10 growth was associated with a significant increase of CD45.2+7AAD- (live) TILs (Fig. 2A and Fig. S1A), suggesting that the immunosuppressive tumor microenvironment was dismantled upon Treg depletion. We observed a marked increase of NK cells (NK1.1+TCRβ-) (Fig. 2B and Fig. S1B) and of various T-cell subsets (NK1.1-CD4+TCRβ+ or NK1.1-CD8+TCRβ+) in Treg-depleted B16F10 melanomas, (Fig. 2C–E and Fig. S1B-D). These data suggest that the increased lymphocytic infiltration in B16F10 melanomas contribute to the suppression of tumor growth.
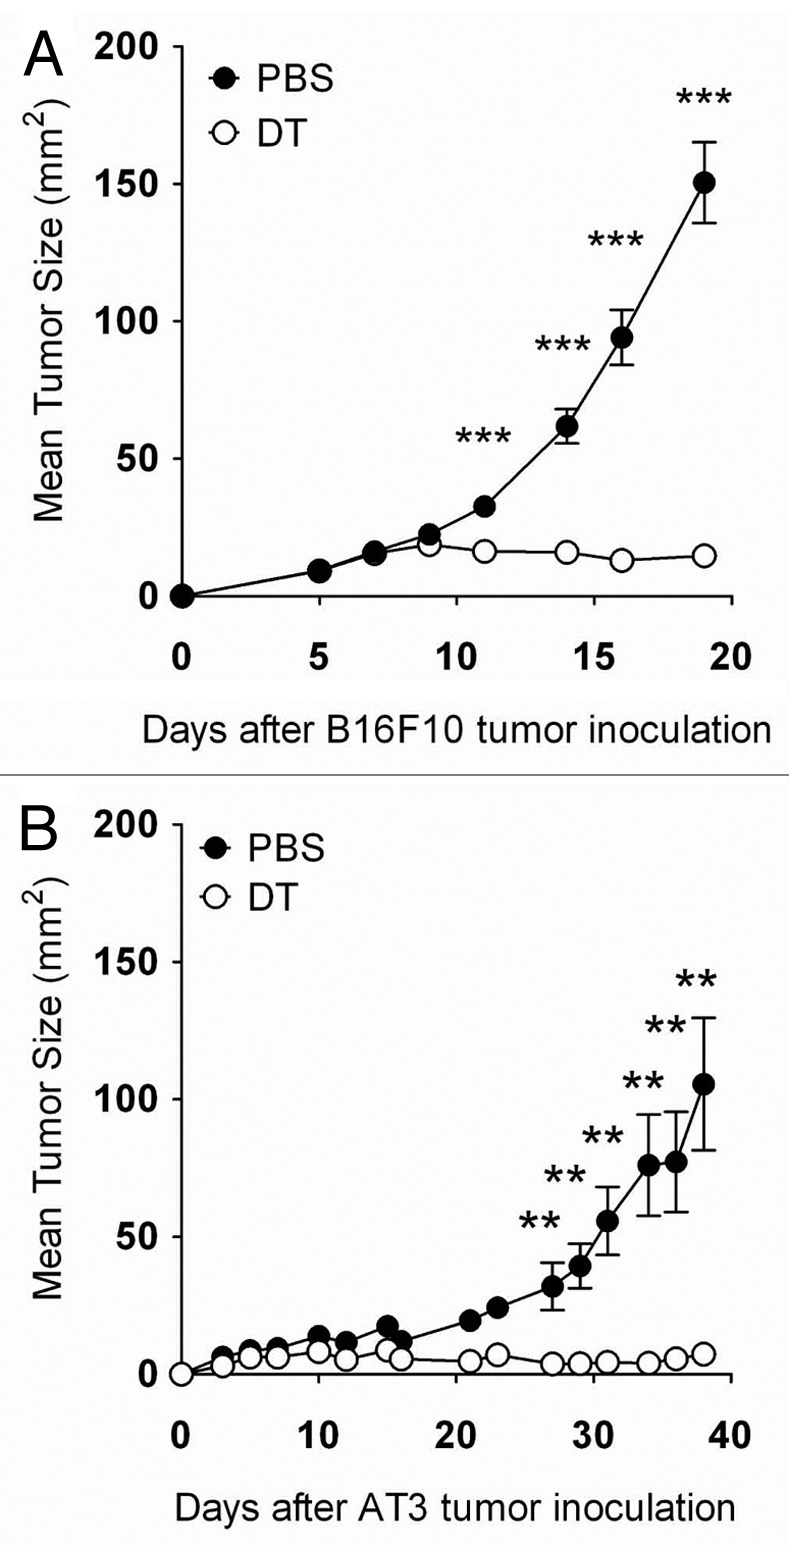
Figure 1. Foxp3+ Treg depletion suppresses tumor growth. (A and B) Groups of C57BL/6 DEREG mice (n = 4–10) were inoculated s.c. with 5 × 10⁴ B16F10 melanoma cells or 5 × 10⁵AT3 mammary tumor cells on day 0. On days -2, 5, 12 and 19, mice were injected i.p. with either 500 ng diphtheria toxin A (DTA) or PBS. Tumor sizes are shown as means ± SEM. Statistically significant differences in tumor size between mice treated with PBS or DTA were determined by Mann-Whitney tests (**p < 0.01; ***p < 0.001).
Figure 2. Foxp3+ Treg depletion enhances immune cell infiltration in B16F10 tumors. (A–F) Groups of C57BL/6 DEREG mice (n = 4–7) were inoculated s.c. with 5 × 10⁴ B16F10 melanoma cells on day 0. On days -2, 5 and 12, mice were injected i.p. with either 500 ng diphtheria toxin A (DTA) or PBS. On day 18–20, tumors were excised and tumor-infiltrating leukocytes were analyzed by flow cytometry. Frequencies of CD45.2+ (A), NK cells (B), total T (C), CD4+ T (D), CD8+ T (E) and Treg cells (F), upon gating on CD45.2+ (B–E) or CD4+ T cells (F) from PBS- or DTA-treated mice are shown. Statistical differences in the frequency of the indicated cell subsets between mice treated with PBS or DTA were determined by unpaired Student’s t-tests (*p < 0.05; **p < 0.01; ***p < 0.001). Each symbol represents a single mouse. Data shown are pooled from three independent analyses.
Host T cells and interferon γ mediate antitumor effects following Treg depletion
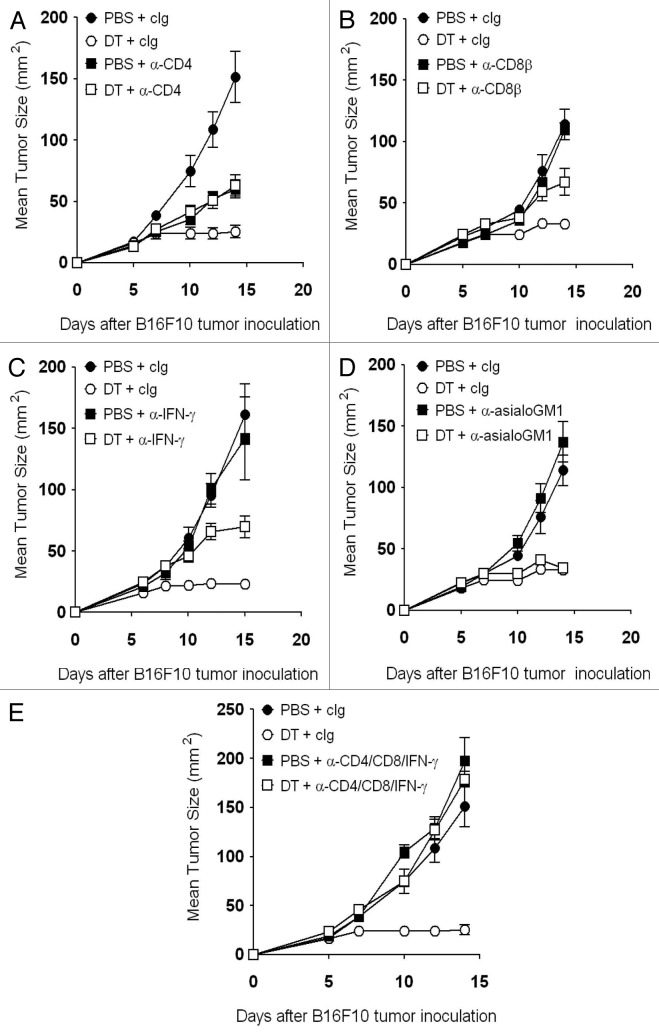
We have previously demonstrated a role for interferon γ (IFNγ) in the antitumor responses elicited by Foxp3+ Treg depletion.7 Therefore, we assessed the growth of B16F10 melanomas in Treg-depleted mice that were additionally depleted of NK cells, CD4+ T cells, CD8+ T cells, or IFNγ. Whereas CD4+ T cells, CD8+ T cells and IFNγ were all partially required to suppress B16F10 tumor growth (Fig. 3A–C), NK cells appeared to play no major roles in the antitumor response developing in Treg-depleted mice (Fig. 3D). Unequivocally, the antitumor response elicited by Treg depletion was completely abrogated in CD4+ T cell-, CD4+ T cell- and IFNγ-depleted mice (Fig. 3E). Together with the cytofluorometric analyses of TILs, these data highlight the importance of host T cells and IFNγ in sustaining an effective antitumor response against B16F10 melanomas growing in Treg-depleted mice.
Figure 3. Host T cells and interferon γ mediate antitumor effect following Treg depletion. (A–E) Groups of C57BL/6 DEREG mice (n = 5–7) were inoculated s.c. with 5 × 10⁴ B16F10 melanoma cells on day 0. On days -2, 5 and 12, mice were injected i.p. with either 500 ng diphtheria toxin A (DTA) or PBS. Some mice additionally received 250 μg anti-CD4 (A), (E) and/or 100 μg anti-CD8β (B and E) anti-CD8β monoclonal antibodies on days -1, 0, 4 and 7. Some mice additionally received anti-IFNγ monoclonal antibodies on days -1 (750 μg) and 7 (250 μg) (C and E), or 100 μg anti-asialo-GM1 monoclonal antibodies on days -1, 0, 4 and 7 (D). Tumor sizes are reported as means ± SEM. Data are representative of two independent experiments.
Foxp3+ Treg depletion enhances immune effector cell activation
TCRβ levels were downregulated on both CD8+ and CD4+ tumor-infiltrating T cells, indicating activation (Fig. 4A and Fig. S2A–B) and a significant increase of effector memory (CD44+CD62L-) CD8+ (PBS 67.57 ± 3.79% vs. DTA 86.79 ± 1.32%) and CD4+ T cells (PBS 54.05 ± 5.89% vs. DTA 88.73 ± 0.98%) (Fig. 4B and Fig. S2C and D) was observed. We subsequently assessed the level of intracellular IFNγ, granzyme B and Ki67 (a cell proliferation marker) in tumor-infiltrating CD8+ and CD4+ T cells. Notably, IFNγ, granzyme B and Ki67 levels were significantly increased in CD8+ and CD4+ T cells (Fig. 4C–E and Fig. S2E–J) directly assessed ex vivo. Similarly, increased levels of IFNγ and granzyme B was observed in ex vivo tumor-infiltrating T cells subsequently stimulated (Fig. S3). These data suggest that tumor-infiltrating T cells are activated following Treg depletion.
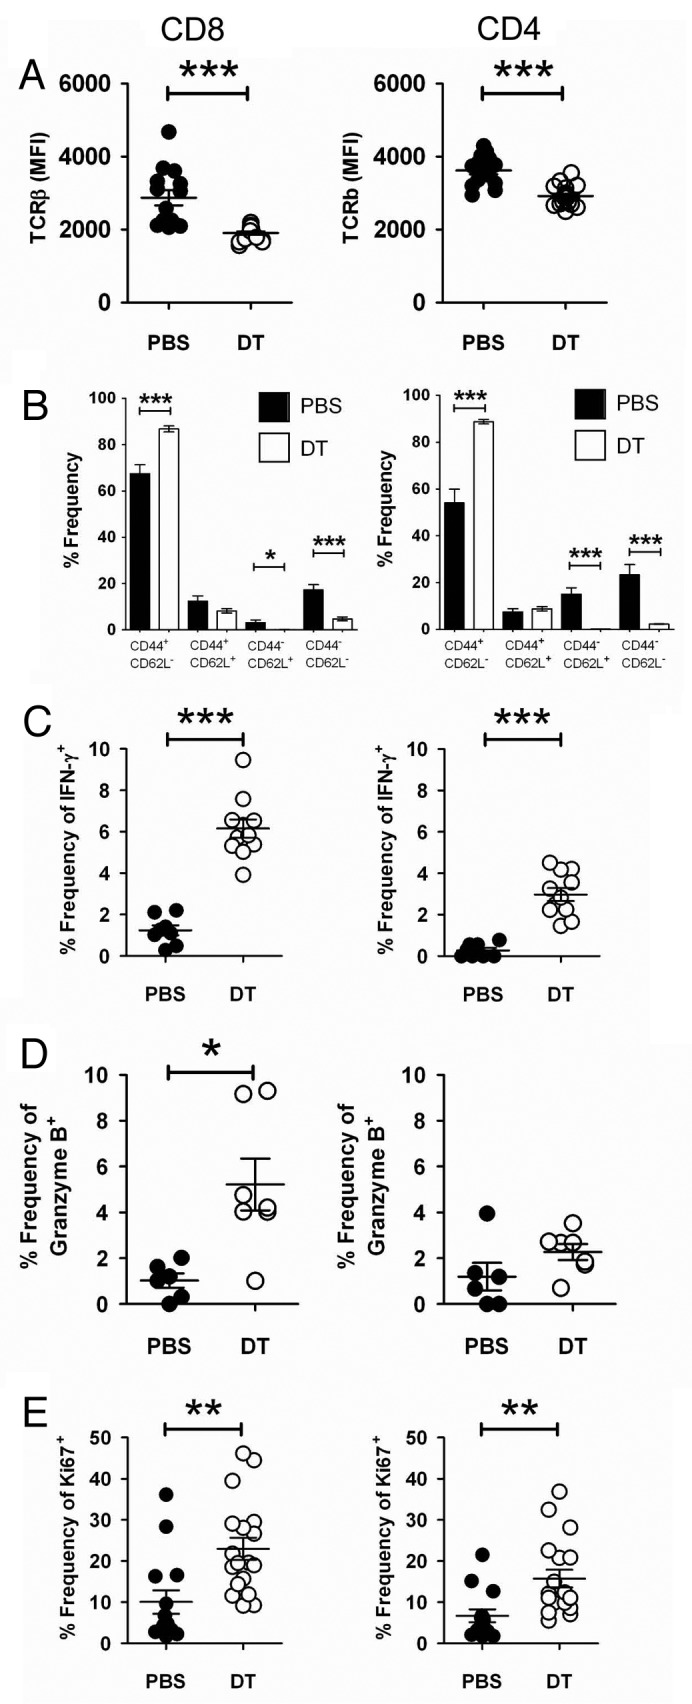
Figure 4. Foxp3+ Treg depletion enhances immune effector cell activation. (A–D) Groups of C57BL/6 DEREG mice (n = 4–11) were inoculated s.c. with 5 × 10⁴ B16F10 melanoma cells on day 0. On days -2, 5 and 12, mice were injected i.p. with either 500 ng diphtheria toxin A (DTA) or PBS. On day 18–20, tumors were excised and tumor-infiltrating leukocytes (TILs) were analyzed bv flow cytometry. Mean fluorescence intensity (MFI) of TCRβ gated on CD8+ [(A), left panel)] or CD4+ [(A), right panel)] B16F10 TILs from PBS- or DTA-treated mice. Each symbol represents a single mouse. Data shown are pooled from three independent analyses. Statistical differences between PBS- and DTA-treated mice were determined by unpaired Student’s t-tests (***p < 0.001). The frequency of the CD44+ and CD62L+ subsets of CD8+ [(B), left panel)] or CD4+ [(B), right panel)] B16F10 TILs from PBS- or DTA-treated mice is shown. Statistical differences between PBS and DTA-treated mice were determined by unpaired Student’s t-tests (*p < 0 0.05; ***p < 0.001). Frequencies of IFNγ+(C), granzyme B+(D) or Ki67+(E) cells, upon gating on CD8+ (left panel) or CD4+ (right panel) B16F10 TILs from PBS- or DTA-treated mice are shown. Each symbol represents an individual mouse. Data shown in (C) and (D) are from one independent analysis. Data shown in (E) are pooled from two independent analyses. Statistical differences between PBS- and DTA-treated mice were determined by an unpaired Student’s t-tests (*p < 0.05; **p < 0.01; ***p < 0.001).
Modulation of tumor-cell expression of MHC Class I molecules by interferon γ
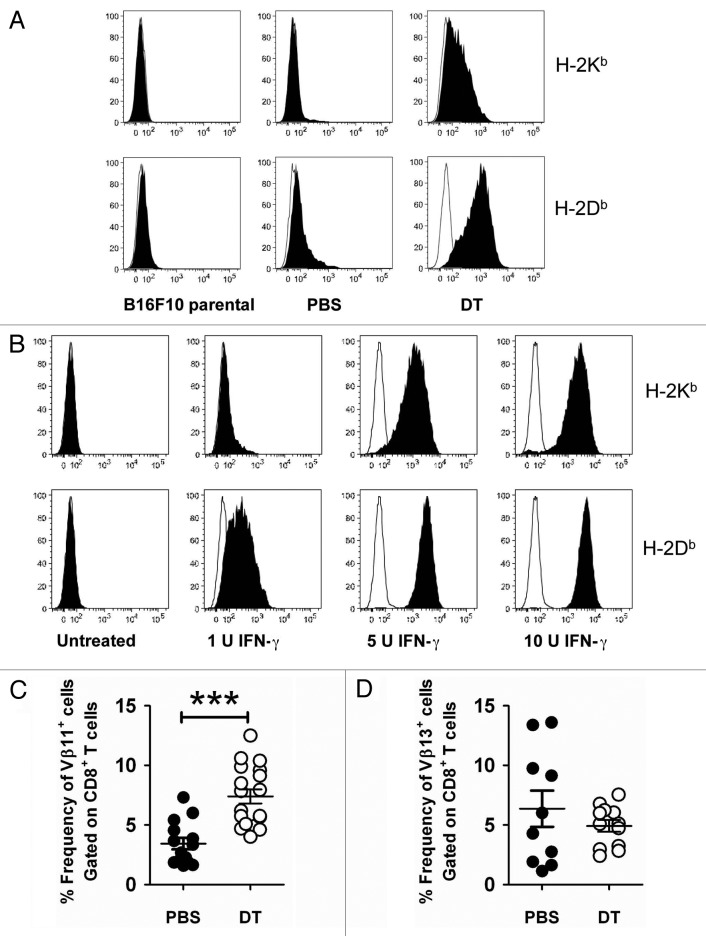
Given that the IFNγ production by intratumoral T cells was significantly increased in Treg-depleted mice and that IFNγ impacts on the immunogenicity of B16F10 tumor cells,15 we next assessed the immunogenicity of B16F10 tumor cell lines derived from Treg-intact (PBS) and Treg-depleted (DTA) mice (Fig. 5A and Fig. S4). Of note, DTA itself did not affect B16F10 tumor growth or tumor MHC class I expression (Fig. S5). Among the immunogenic markers screened, we observed a modest upregulation of H-2Db on PBS cell lines as compared with B16F10 parental cells (Fig. 5A). Consistent with an increase of IFNγ-producing cells in the tumors of Treg-depleted mice, H-2Db expression was further enhanced on DTA cell lines (Fig. 5A). Interestingly, H-2Kb was significantly increased on DTA cell lines, as compared with both parental B16F10 cells and cells derived from PBS-treated mice (Fig. 4A). To test whether MHC class I (H-2Db and H-2Kb) expression correlated with extracellular IFNγ levels, we assessed MHC class I molecules on B16F10 parental cells treated with increasing levels of IFNγ. Similar to the MHC class I expression pattern on B16F10 tumor cell lines passaged in vivo, we observed that the expression of H-2Db was more upregulated than that of H-2Kb when B16F10 tumor cells were exposed to IFNγ in vitro (Fig. 5B). We also demonstrated that the expression levels of H-2Db and H-2Kb on B16F10 tumor cells positively correlated with the exposure to increasing levels of IFNγ in vitro (Fig. 5B). Thus, our data suggested that an increased IFNγ production by intratumoral immune cells contributed to the modulation of MHC class I expression by B16F10 tumor cells.
Figure 5. Modulation of surface immunogenicity of tumor cells by interferon γ. (A) Groups of C57BL/6 DEREG mice were inoculated s.c. with 5 × 10⁴ B16F10 melanoma cells on day 0. On days -2, 5, 12 and 19, mice were injected i.p. with either 500 ng diphtheria toxin A (DTA) or PBS. Tumors from each group were excised when tumor size exceeded 120 mm2, cell lines were generated and then stained for the expression of H-2Kb and H-2Db. Representative histograms are shown (PBS, n = 5 cell lines; DTA, n = 10 cell lines). (B) Parental B16F10 tumor cells were incubated with increasing doses of interferon γ (IFNγ) for 48 h in triplicate wells and then analyzed by flow cytometry for the expression of H-2Kb and H-2Db. Representative histogram plots are shown. (C and D) Groups of C57BL/6 DEREG mice (n = 4–7) were inoculated s.c. with 5 × 10⁴ B16F10 melanoma cells on day 0. On days -2, 5 and 12, mice were injected i.p. with either 500 ng diphtheria toxin A (DTA) or PBS. On day 18–20, tumors were excised and tumor-infiltrating leukocytes (TILs) were analyzed by flow cytometry. The frequency of Vβ11+(C) or Vβ13+(D) CD8+ B16F10 TILs from PBS- or DTA-treated mice is shown. Statistical differences between PBS- and DTA-treated mice were determined by unpaired Student’s t-tests (***p < 0.001). Each symbol represents an individual mouse. Data are pooled from three (C) or two (D) independent analyses.
We next speculated that higher levels of tumor antigens might be presented by B16F10 cells as they exhibit increased levels of H-2Db and H-2Kb molecules. As a first measure to assess tumor antigen-specific T cells in B16F10 tumors, we utilized antibodies specific for the Vβ11 and Vβ13 TCR, which have previously been reported to preferentially recognize the (H-2Kb-associated) TRP-216 and (H-2Db-associated) gp100,17 respectively. In line with our prediction, we observed an increased frequency of CD8+ T cells expressing the Vβ11 TCR in Treg-depleted tumors (Fig. 5C and Fig. S1F). However, no significant changes in the frequency of tumor-infiltrating Vβ13+CD8+ T cells were observed between Treg-intact and Treg-depleted mice (Fig. 5D and Fig. S1G). Therefore, Treg depletion modulates MHC Class I expression on B16F10 tumors and enhances the number of tumor-infiltrating antigen-specific T cells.
The depletion of Foxp3+ Tregs generates heterogeneous antitumor responses
Having characterized the mechanisms underpinning antitumor responses that develop in Treg-depleted mice, we then evaluated the responses of individual mice. Here, for the first time using an experimental tumor cell line, we observed a very heterogeneous B16F10 tumor growth profile. All mice could indeed be categorized into either Group A (22/22 mice exhibiting tumors ≥ 50 mm2 at day 30), including PBS-treated Treg-intact mice and Groups B, C, or D, depending upon the level of tumor suppression, including DTA-treated, Treg-depleted mice (Fig. 6A). The majority (76.1%) of Treg-depleted mice could be classified in Group B (25/67 mice exhibiting tumors ≥ 50 mm2 at day 30) (Fig. 6A), demonstrating significant tumor suppression but, as tumors never completely regressed, eventually developing lethal lesions within 60 d post-transplantation. A comparatively smaller percentage (11.4%) of Treg-depleted B16F10-bearing mice were categorized into Group C (0/10 mice exhibiting tumors ≥ 50 mm2 at day 30) (Fig. 6A), in which complete tumor rejection was observed. A similar proportion of mice were assigned to Group D (12.5%), in which tumor suppression persisted for more than 60 d post-transplantation, before an eventual tumor escape and outgrowth (Fig. 6A).
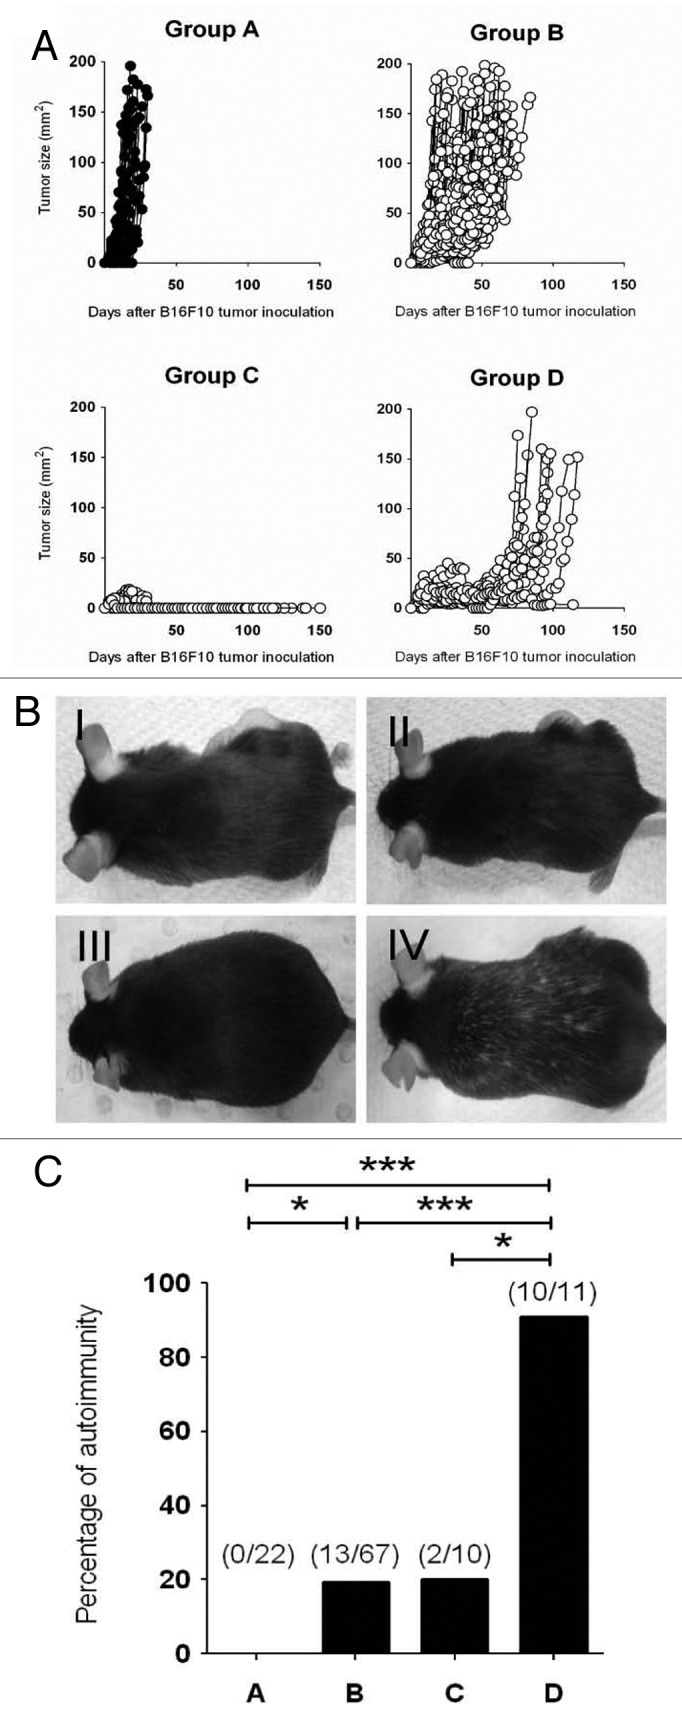
Figure 6. Depletion of Foxp3+ Treg provokes heterogeneous antitumor responses that correlate with development of vitiligo. (A–C) Groups of C57BL/6 DEREG mice (n = 4–25) were inoculated s.c. with 5 × 10⁴ B16F10 melanoma cells on day 0. On days -2, 5, 12 and 19, mice were injected i.p. with either 500 ng diphtheria toxin A (DTA) or PBS. Mice were then monitored and tumor growth was measured over 150 d. Tumor-bearing mice were categorized into 4 groups based on tumor growth pattern: Group A (PBS treated), Group B (DTA-treated, tumor outgrowth by 60 days post-inoculation), Group C (DTA-treated, tumor eliminated) and Group D (DTA-treated, tumor outgrowth 60 days post-inoculation). Tumor size (mm2) for each individual mouse was plotted and results were pooled from seven independent experiments (A). Representative pictures of mice from each group are shown in (B). The incidence of vitiligo in B16F10-bearing mice belonging to the indicated group is shown in (C). Statistical differences between mice groups were determined by Fisher’s exact tests (*p < 0.05; **p < 0.01; ***p < 0.001).
Length of tumor suppression correlates with the development of vitiligo
The occurrence of autoimmunity has been demonstrated to be a positive prognostic indicator for effective antitumor immune responses,18 but this study did not attempt to separate mice into partial responders and cured groups. Therefore, we not required monitored for and documented the incidence of vitiligo in mice belonging to Group A, B, C and D. Not surprisingly, in PBS-treated mice, in which B16F10 tumors grew unimpeded by the host immune system, mice failed to develop autoimmune reactions (Fig. 6B and C). Autoimmunity (manifesting as vitiligo) was detected at a low incidence in Treg-depleted mice that rapidly rejected tumors (Group C, 2/10 mice) or in mice that exhibited moderate antitumor responses (Group B, 13/67 animals) (Fig. 6B and C). Strikingly, a far higher incidence of vitiligo was detected in mice developing stronger antitumor responses that eventually failed to clear tumors (Group D, 10/11 animals). Consistent with these data and our previous observations based on the B16-OVA model,3 we failed to see overt autoimmunity in the large proportion of mice that effectively rejected AT3 tumors (Fig. 1, data not shown). These data indicate that prolonged tumor-immune systems interaction result in an increased incidence of vitiligo, while ineffective or promptly effective tumor rejection reduces the propensity of mice to develop autoimmune reactions.
Discussion
Tregs represent one of the most important immunosuppressive cell type present in the tumor microenvironment.2,19 The ablation of Tregs using cyclophosphamide or denileukin diftitox (Ontak®) has been explored in pre-clinical tumor models as well as in clinical trials,19 aiming to release and promote antitumor immunity, thus augmenting the efficacy of anticancer therapeutics. However, the depletion of Tregs using these approaches is incomplete and non-specific.19 A major issue in tumor immunotherapy is whether Treg functions or number can be reduced in a manner that maximizes the therapeutic index (i.e., greater antitumor immunity over autoimmunity ratio). Here, for the first time, the heterogeneous growth of non-immunogenic B16F10 melanoma in Treg-depleted DEREG transgenic mice has allowed us to perform an assessment of the correlation between antitumor immunity and autoimmunity.
Importantly, we have demonstrated the occurrence of vitiligo in B16F10 melanoma-bearing mice following the specific depletion of Foxp3+ Tregs. Previous studies have shown that the incidence of vitiligo positively correlates with the responsiveness of B16 melanoma-bearing mice to a tumor vaccine (Gvax) in combination with anti-CTLA-4 monoclonal antibodies.18,20 We have also observed vitiligo in mice mounting an antitumor immune response post-Treg depletion, but—distinctively—we have shown that the best (Group C) and poorest (Group B) responders actually develop vitiligo less frequently than animals in which the antitumor effect was strong, but ultimately failed (Group D, i.e., mice undergoing immunoselection and tumor escape). Zhang et al. have reported that the therapeutic depletion of Tregs using anti-CD4 monoclonal antibodies in mice bearing established B16F10 tumors did not result in any survival benefit, nor did it promotes the development of vitiligo.21 In this study, vitiligo was only observed when mice that had previously been subjected to therapeutic Treg depletion and surgical removal of the primary tumor were re-challenged with B16F10 cells. Our data suggest that partially effective and prolonged tumor-immune system interactions results in an increased incidence of vitiligo, while rapid tumor rejection as well as ineffective antitumor immune responses are associated with a low propensity for autoimmunity. In metastatic melanoma patients, the administration of anti-CTLA-4 monoclonal antibodies plus a peptide vaccination has been reported to cause durable objective responses that correlated with the induction of autoimmunity, although this was not specifically linked to the duration of the response.22 Future studies will need to specifically assess whether patients exhibiting rapid antitumor responses are less likely to develop autoimmunity.
Interestingly, despite the use of a single transplanted B16F10 population, we observed a great heterogeneity in tumor outgrowth in individual Treg-depleted mice. Due to this heterogeneity, a continuous assessment of the changes in immune infiltrates and their correlation with tumor escape was technically challenging. We were practically unable to generate enough mice in Group C at one time to re-challenge them with B16F10 cells and evaluate secondary antitumor and autoimmune responses. Although our studies have demonstrated a consistent modulation of immune effector cells during the Treg-depletion period, the level of MHC class I (H-2Db and H-2Kb) expression in Group B and D tumor cell lines did not correlate with the duration of tumor suppression (data not shown). It is therefore possible that the length of tumor suppression is affected by both tumor-intrinsic and tumor-extrinsic factors.
Similar to previously published data,3,5,7 the suppression of B16F10 tumor growth was associated with a massive increase in TILs, notably CD8+ and CD4+ T cells. Consistent with the role of Tregs in suppressing multiple immune effectors,23 the neutralization or depletion of IFNγ, CD8+ or CD4+ T cells alone only partially abrogated tumor suppression in Treg-depleted mice, whereas a complete abrogation was achieved in absence of both CD8+ or CD4+ T cells and IFNγ. Although we also observed an increase in tumor-infiltrating NK cells in Treg-depleted mice, the absence of NK cells did not affect antitumor responses developing in these animals. It has been previously debated whether the depletion of Tregs using anti-CD4 monoclonal antibodies would mask elicited antitumor response, due to the co-depletion of CD4+ immune effector cells.8 Based on our in vivo immune effector cell-depletion experiments, tumor suppression elicited by total CD4+ cell depletion was inferior to that obtained by means of the specific Fopx3+ Treg depletion in DEREG mice. Thus, our data provide new evidence to demonstrate the importance of effector CD4+ cells in the immune response that develop upon the specific depletion of Foxp3+ Tregs. Strikingly, effector memory T cells were greatly activated and displayed increased levels of IFNγ, granzyme B and Ki67. The increase in IFNγ-producing cells in Treg-depleted mice was concurrent with the modulation of MHC class I expression on tumor cells in vitro and in vivo, and an increase in Vβ11+ (H-2Kb-associated) CD8+ T cells infiltrating the Treg-depleted tumor was also observed. Although the proportion of Vβ13+ (H-2Db-associated) tumor-infiltrating CD8+ T cells was comparable between tumors developing in Treg-intact and Treg-depleted mice, this could be due to the dominance of CD8+ T cells in recognizing H-2Kb-associated antigens over H-2Db-associated antigens. In this respect, the phenotyping of CD8+ (and CD4+) T-cell α and β TCR chains could potentially identify αβ-specific T cells for the recognition and suppression of melanoma.
With advances in cancer therapies, our data potentially shed light on the need for therapies that induces a rapid and effective antitumor response so as to reduce the potential development of autoimmunity in the host. Notably, our B16F10-DEREG mouse model may be potentially used as a platform for the assessment of antitumor immunity vs. autoimmunity as triggered by different cancer immunotherapies (e.g., vaccination, T-cell checkpoint blockade) in combination with Treg depletion. Current experiments combining Treg depletion with tumor vaccines or antibodies that either agonize T-cell co-stimulation or inhibit T-cell checkpoints are in progress.
Materials and Methods
In vitro tumor models
B16F10 melanoma and AT3 mammary tumor cells were maintained, injected and monitored as previously described.24,25 B16F10 derivative cell lines generated from DEREG mice were maintained in complete DMEM. Tumor cell lines were expanded and frozen at the first or second passage. All cell lines were tested for mycoplasma contamination and were confirmed to be negative. Analysis of B16F10 derivative cell lines for surface immunogenicity markers were performed on third to fifth passage cells.
In vivo tumor models
Groups of C57BL/6 DEREG mice were treated with PBS alone or DTA (500 ng/mouse) (Sigma Aldrich, Catalog No. D0564) on days -2, 5, 12 and 19 relative to tumor-cell inoculation, unless otherwise indicated. The concentration of DTA used has previously been shown to achieve complete Foxp3+ cells depletion in the peripheral blood and lymphoid organs (spleen, lymph nodes).7 Some mice additionally received anti-CD8β (53.5.8; 100 μg i.p.) and anti-CD4 (GK1.5; 250 μg i.p.) monoclonal antibodies on days -1, 0, 4 and 7 to deplete CD8+ and CD4+ cells, respectively. Some mice additionally received anti-asialo-GM1 (Wako Pure Chemical, Catalog No. 986–10001; 100 μg i.p.) monoclonal antibodies on days -1, 0, 4 and 7, to deplete NK cells. IFNγ-neutralizing antibodies (H22) were administered i.p. on day -1 (750 μg) and day 7 (250 μg).
Flow cytometry
Established B16F10 tumors were excised from DEREG mice on the days indicated. Tumors were then digested and used for flow cytometry analysis as previously described.24 For surface staining, TILs were incubated with anti-mouse CD45.2 (104), TCRβ (H57–597), NK1.1 (PK136), CD4 (RM4–5), CD8α (53–6.7), Vβ11 (RR3–15), Vβ13 (MR12–3), CD62L (MEL-14), CD44 (IM7) and respective isotype antibodies (eBioscience and BD PharMingen) as controls, in the presence of 2.4G2 (anti-CD16/32, to block Fc-receptors) on ice. For the intracellular detection of Foxp3, TILs were fixed and permeabilized using the Foxp3 staining buffer kit (eBioscience) according to the manufacturer’s protocol, and then stained with anti-mouse Foxp3 (FJK-16s) (eBioscience). For the intracellular detection of Ki67, surface-stained TILs were fixed and permeabilized using BD Cytofix/CytopermTM (BD Biosciences) according to the manufacturer’s protocol, and then stained with anti-mouse Ki67 (B56). For the intracellular detection of IFNγ and granzyme B, TILs were incubated in the presence of Golgi Plug (BD Biosciences) for 4 h, and then subjected to surface staining as aforementioned. Surface-stained TILs were then fixed and permeabilized using BD Cytofix/CytopermTM (BD Biosciences) according to the manufacturer’s protocol, and then stained with anti-mouse IFN-γ (XMG1.2), granzyme B (GB11), and respective isotype antibodies. Alternatively, tumor cell lines were stained with anti-mouse H-2Kb (AF6–88.5) and H-2Db (28–14–8) (BD PharMingen) on ice. In both settings (TILs and tumor cells), 7-AAD (BD PharMingen) was added immediately before flow cytometry analysis, to identify live cells. Flow cytometry was performed on a BD FACScanto II (BD Biosciences) and analysis was performed using FlowJo (Tree Star).
Statistical analyses
Statistical analyses were performed using the Graph Pad Prism software. Significant differences in tumor growth were determined by Mann-Whitney tests. Significant differences in cell subsets were determined by unpaired Student’s t-tests. Significant differences in the proportion of autoimmune reactions between different DEREG mouse responders were determined by Fisher’s exact tests. p values < 0.05 were considered significant.
Supplementary Material
Acknowledgments
The authors wish to thank Sally Richards, Jessica May and Ben Venville for the maintenance of mice in this study. We also wish to thank Nicole Haynes and Joshy George for their helpful discussions. This work was supported by the National Health and Medical Research Council of Australia (NH&MRC) Program Grant (454569), the Victorian Cancer Agency and the Cancer Council of Victoria. MWLT was supported by a NH&MRC Career Development I Fellowship. MJS received support from a NH&MRC Australia Fellowship. SFN was supported by a Cancer Research Institute PhD scholarship. AM was supported by a National Breast Cancer Foundation (Australia) fellowship. The authors declare no competing financial interests.
Glossary
Abbreviations:
- DTA
diphtheria toxin A
- WT
wild type
Disclosure of Potential Conflicts of Interest
The authors of this manuscript have no conflict of interest to declare.
Supplemental Materials
Supplemental materials may be found here: www.landesbioscience.com/journals/oncoimmunology/article/23036
Footnotes
Previously published online: www.landesbioscience.com/journals/oncoimmunology/article/23036
References
- 1.Fridman WH, Pagès F, Sautès-Fridman C, Galon J. The immune contexture in human tumours: impact on clinical outcome. Nat Rev Cancer. 2012;12:298–306. doi: 10.1038/nrc3245. [DOI] [PubMed] [Google Scholar]
- 2.Rabinovich GA, Gabrilovich D, Sotomayor EM. Immunosuppressive strategies that are mediated by tumor cells. Annu Rev Immunol. 2007;25:267–96. doi: 10.1146/annurev.immunol.25.022106.141609. [DOI] [PMC free article] [PubMed] [Google Scholar]
- 3.Klages K, Mayer CT, Lahl K, Loddenkemper C, Teng MW, Ngiow SF, et al. Selective depletion of Foxp3+ regulatory T cells improves effective therapeutic vaccination against established melanoma. Cancer Res. 2010;70:7788–99. doi: 10.1158/0008-5472.CAN-10-1736. [DOI] [PubMed] [Google Scholar]
- 4.Lesokhin AM, Hohl TM, Kitano S, Cortez C, Hirschhorn-Cymerman D, Avogadri F, et al. Monocytic CCR2(+) myeloid-derived suppressor cells promote immune escape by limiting activated CD8 T-cell infiltration into the tumor microenvironment. Cancer Res. 2012;72:876–86. doi: 10.1158/0008-5472.CAN-11-1792. [DOI] [PMC free article] [PubMed] [Google Scholar]
- 5.Li X, Kostareli E, Suffner J, Garbi N, Hämmerling GJ. Efficient Treg depletion induces T-cell infiltration and rejection of large tumors. Eur J Immunol. 2010;40:3325–35. doi: 10.1002/eji.201041093. [DOI] [PubMed] [Google Scholar]
- 6.Smyth MJ, Teng MW, Swann J, Kyparissoudis K, Godfrey DI, Hayakawa Y. CD4+CD25+ T regulatory cells suppress NK cell-mediated immunotherapy of cancer. J Immunol. 2006;176:1582–7. doi: 10.4049/jimmunol.176.3.1582. [DOI] [PubMed] [Google Scholar]
- 7.Teng MW, Ngiow SF, von Scheidt B, McLaughlin N, Sparwasser T, Smyth MJ. Conditional regulatory T-cell depletion releases adaptive immunity preventing carcinogenesis and suppressing established tumor growth. Cancer Res. 2010;70:7800–9. doi: 10.1158/0008-5472.CAN-10-1681. [DOI] [PubMed] [Google Scholar]
- 8.Teng MW, Swann JB, von Scheidt B, Sharkey J, Zerafa N, McLaughlin N, et al. Multiple antitumor mechanisms downstream of prophylactic regulatory T-cell depletion. Cancer Res. 2010;70:2665–74. doi: 10.1158/0008-5472.CAN-09-1574. [DOI] [PubMed] [Google Scholar]
- 9.Yuan J, Adamow M, Ginsberg BA, Rasalan TS, Ritter E, Gallardo HF, et al. Integrated NY-ESO-1 antibody and CD8+ T-cell responses correlate with clinical benefit in advanced melanoma patients treated with ipilimumab. Proc Natl Acad Sci U S A. 2011;108:16723–8. doi: 10.1073/pnas.1110814108. [DOI] [PMC free article] [PubMed] [Google Scholar]
- 10.Yuan J, Ginsberg B, Page D, Li Y, Rasalan T, Gallardo HF, et al. CTLA-4 blockade increases antigen-specific CD8(+) T cells in prevaccinated patients with melanoma: three cases. Cancer Immunol Immunother. 2011;60:1137–46. doi: 10.1007/s00262-011-1011-9. [DOI] [PMC free article] [PubMed] [Google Scholar]
- 11.Matsushita H, Vesely MD, Koboldt DC, Rickert CG, Uppaluri R, Magrini VJ, et al. Cancer exome analysis reveals a T-cell-dependent mechanism of cancer immunoediting. Nature. 2012;482:400–4. doi: 10.1038/nature10755. [DOI] [PMC free article] [PubMed] [Google Scholar]
- 12.Kim JM, Rasmussen JP, Rudensky AY. Regulatory T cells prevent catastrophic autoimmunity throughout the lifespan of mice. Nat Immunol. 2007;8:191–7. doi: 10.1038/ni1428. [DOI] [PubMed] [Google Scholar]
- 13.Lahl K, Loddenkemper C, Drouin C, Freyer J, Arnason J, Eberl G, et al. Selective depletion of Foxp3+ regulatory T cells induces a scurfy-like disease. J Exp Med. 2007;204:57–63. doi: 10.1084/jem.20061852. [DOI] [PMC free article] [PubMed] [Google Scholar]
- 14.Suffner J, Hochweller K, Kühnle MC, Li X, Kroczek RA, Garbi N, et al. Dendritic cells support homeostatic expansion of Foxp3+ regulatory T cells in Foxp3.LuciDTR mice. J Immunol. 2010;184:1810–20. doi: 10.4049/jimmunol.0902420. [DOI] [PubMed] [Google Scholar]
- 15.Riond J, Rodriguez S, Nicolau ML, al Saati T, Gairin JE. In vivo major histocompatibility complex class I (MHCI) expression on MHCIlow tumor cells is regulated by gammadelta T and NK cells during the early steps of tumor growth. Cancer Immun. 2009;9:10. [PMC free article] [PubMed] [Google Scholar]
- 16.Singh V, Ji Q, Feigenbaum L, Leighty RM, Hurwitz AA. Melanoma progression despite infiltration by in vivo-primed TRP-2-specific T cells. J Immunother. 2009;32:129–39. doi: 10.1097/CJI.0b013e31819144d7. [DOI] [PMC free article] [PubMed] [Google Scholar]
- 17.Overwijk WW, Theoret MR, Finkelstein SE, Surman DR, de Jong LA, Vyth-Dreese FA, et al. Tumor regression and autoimmunity after reversal of a functionally tolerant state of self-reactive CD8+ T cells. J Exp Med. 2003;198:569–80. doi: 10.1084/jem.20030590. [DOI] [PMC free article] [PubMed] [Google Scholar]
- 18.van Elsas A, Hurwitz AA, Allison JP. Combination immunotherapy of B16 melanoma using anti-cytotoxic T lymphocyte-associated antigen 4 (CTLA-4) and granulocyte/macrophage colony-stimulating factor (GM-CSF)-producing vaccines induces rejection of subcutaneous and metastatic tumors accompanied by autoimmune depigmentation. J Exp Med. 1999;190:355–66. doi: 10.1084/jem.190.3.355. [DOI] [PMC free article] [PubMed] [Google Scholar]
- 19.Teng MW, Ritchie DS, Neeson P, Smyth MJ. Biology and clinical observations of regulatory T cells in cancer immunology. Curr Top Microbiol Immunol. 2011;344:61–95. doi: 10.1007/82_2010_50. [DOI] [PubMed] [Google Scholar]
- 20.van Elsas A, Sutmuller RP, Hurwitz AA, Ziskin J, Villasenor J, Medema JP, et al. Elucidating the autoimmune and antitumor effector mechanisms of a treatment based on cytotoxic T lymphocyte antigen-4 blockade in combination with a B16 melanoma vaccine: comparison of prophylaxis and therapy. J Exp Med. 2001;194:481–9. doi: 10.1084/jem.194.4.481. [DOI] [PMC free article] [PubMed] [Google Scholar]
- 21.Zhang P, Côté AL, de Vries VC, Usherwood EJ, Turk MJ. Induction of postsurgical tumor immunity and T-cell memory by a poorly immunogenic tumor. Cancer Res. 2007;67:6468–76. doi: 10.1158/0008-5472.CAN-07-1264. [DOI] [PMC free article] [PubMed] [Google Scholar]
- 22.Attia P, Phan GQ, Maker AV, Robinson MR, Quezado MM, Yang JC, et al. Autoimmunity correlates with tumor regression in patients with metastatic melanoma treated with anti-cytotoxic T-lymphocyte antigen-4. J Clin Oncol. 2005;23:6043–53. doi: 10.1200/JCO.2005.06.205. [DOI] [PMC free article] [PubMed] [Google Scholar]
- 23.Shevach EM. Mechanisms of foxp3+ T regulatory cell-mediated suppression. Immunity. 2009;30:636–45. doi: 10.1016/j.immuni.2009.04.010. [DOI] [PubMed] [Google Scholar]
- 24.Ngiow SF, von Scheidt B, Akiba H, Yagita H, Teng MW, Smyth MJ. Anti-TIM3 antibody promotes T cell IFN-γ-mediated antitumor immunity and suppresses established tumors. Cancer Res. 2011;71:3540–51. doi: 10.1158/0008-5472.CAN-11-0096. [DOI] [PubMed] [Google Scholar]
- 25.Mattarollo SR, Loi S, Duret H, Ma Y, Zitvogel L, Smyth MJ. Pivotal role of innate and adaptive immunity in anthracycline chemotherapy of established tumors. Cancer Res. 2011;71:4809–20. doi: 10.1158/0008-5472.CAN-11-0753. [DOI] [PubMed] [Google Scholar]
Associated Data
This section collects any data citations, data availability statements, or supplementary materials included in this article.


