

Abstract
In the inflammatory mucosal microenvironment of head and neck SCC (HNSCC), DC express CD16 and are usually in direct contact with tumor cells. Mucosal and inflammation-associated DC develop from monocytes, and monocyte-derived DC are used in HNSCC immunotherapy. However, beyond apoptotic tumor cell uptake and presentation of tumor antigens by DC, HNSCC cell interactions with DC are poorly understood. Using co-cultures of monocyte-derived DC and two established HNSCC cell lines that represent well- and poorly-differentiated SCC, respectively, we found that carcinoma cells induced significant increases in CD16 expression on DC while promoting a CD1a+CD86dim immature phenotype, similar to that observed in HNSCC specimens. Moreover, HNSCC cells affected steady-state and CCL21-induced migration of DC, and these effects were donor-dependent. The CCL21-induced migration directly correlated with HNSCC-mediated effects on CCR7 and CD38 expression on DC-SIGN-high DC. The dominant pattern seen in six out of nine donors was the increase in steady-state and CCL21-induced DC migration in co-cultures with HNSCC, while the reverse pattern, i.e., decreased DC migration in co-cultures with SCC, was identified in two donors. A split in migratory DC behavior, i.e. increase with one HNSCC cell line and a decrease with the second cell line, was observed in one donor. Remarkably, the numbers of live detached HNSCC cells were orders of magnitude higher in DC-HNSCC co-cultures than in parallel HNSCC cell cultures without DC. This study provides novel insights into the effects of DC-HNSCC interactions relevant to the tumor microenvironment.
Electronic supplementary material
The online version of this article (doi:10.1007/s12307-011-0077-4) contains supplementary material, which is available to authorized users.
Keywords: CD16, Dendritic cells, Head and neck squamous cell carcinoma, Tumor microenvironment
Introduction
Squamous cell carcinoma (SCC) is by far the most common type of cancer in the head and neck (HN) area, representing ~85% of malignancies in this location [1–3]. The mechanisms that regulate HNSCC pathogenesis, particularly those pertaining to the tumor microenvironment are poorly defined. The microenvironment of HNSCC is characterized by dense infiltrates of immune system cells, including monocyte lineage cells [4–6], such as CD68+ [4, 6] monocytes, macrophages and dendritic cells (DC). High numbers of CD68+ cells in HNSCC were shown to correlate with lymph node metastasis and advanced stage of disease [6]. Although an inflammatory microenvironment is known to play a role in tumor cell survival, proliferation, and migration [7, 8], the mechanisms are still under investigation.
Monocytes are precursors of immature DC in the dermis and the mucosa [9, 10], as well as DC produced during inflammation [11–13]. Microbial products and certain cytokines induce DC to mature and up-regulate activation/maturation markers CD80, CD86 and CD83, chemokine receptors CCR7, CXCR4 and the chemokine co-receptor CD38 that is required for CCR7 function [14–16]. However, uptake of apoptotic tumor cells by DC induces CCR7 expression, but not maturation [17]. Chemokines CCL19 and CCL21 guide CCR7+ DC to the lymph nodes [18–20]. While mature DC activate T cells [21–23], immature DC induce T cell tolerance [24, 25] and thus can contribute to the progression of cancer. In vitro, peripheral blood monocytes differentiate into DC in the presence of GM-CSF and IL-4 and this approach is widely used to generate DC for experimental and clinical purposes [26–28], such as in vaccines for cancer immunotherapy. However, immunotherapy for HNSCC remains largely ineffective [29, 30], and various aspects of DC-tumor cell interactions are still unknown.
It is very interesting that in the HNSCC microenvironment, monocyte lineage cells, including DC, express the low-affinity FcγRIII (CD16) [5], which can activate cells upon binding antigen-IgG antibody complexes [31, 32]. We showed that HNSCC cells and their products can directly promote CD16 expression on monocytes in vitro [5]. CD16+ monocytes are known for their association with inflammatory states and preferentially differentiate into migratory DC [31, 33]. Recent evidence from a K14-HPV16 transgenic mouse model of skin SCC revealed that the activation of FcγRIII and other Fc receptors on immune system cells present in the tumor microenvironment promoted pro-tumor and angiogenic activities [34]. As HNSCC patients with large tumor burdens have high levels of antigen-antibody immune complexes [35], CD16 crosslinking on monocytes and DC may contribute significant pro-tumor activities to the pathogenesis of HNSCC. Further, the intimate association of carcinoma cells with CD16+ monocytes and DC raises additional questions regarding the effects of such interactions on the tumor environment.
The purpose of the current study was to investigate how direct interactions between DC and HNSCC cells affect their phenotypes and function. We compared two monocyte-derived DC subsets (DC-SIGN-high and DC-SIGN-low, respectively) co-cultured with established human HNSCC cell lines representing well differentiated and poorly differentiated carcinomas or primary oral keratinocytes. We show that both DC subsets caused striking 8–22-fold increases in the number of live HNSCC cells detached from solid support. On the other hand, carcinoma cell influence on DC consistently promoted an immature, pro-inflammatory CD1a+CD16+CD83−CD86dim phenotype, which was similar to the DC phenotype found in HNSCC specimens. Depending upon the donor of DC precursors, carcinoma cells induced either an increase or a decrease in DC migration, including steady-state and CCL21-induced. CCL21-induced migration in general directly correlated with the respective changes in surface CCR7 and CD38 expression on the DC-SIGN-high DC subset. The patterns of DC migration were further investigated in four young donors of monocytes (25–35 years) and five middle-age donors (50–65 years). HNSCC-induced increase in DC migration was the dominant pattern seen in 80% (four out of five) of older donors and 50% (two out of four) of younger donors. The reverse pattern (reduced migration in co-cultures with HNSCC cells) was observed in 50% of the young donors, while in the older age group, one donor showed both patterns, an increase in DC migration in the presence of one carcinoma cell line, but a decrease with another cell line. We discuss the potential implications of these results. We believe that our novel observations contribute important insights into the regulation of cell phenotypes and migration within the HNSCC microenvironment.
Materials and Methods
The study protocol involving normal donors of blood was approved by the NYU University Committee on Activities Involving Human Subjects. Studies of archival biopsy specimens were performed previously at the University of Iowa with approval from the University of Iowa IRB.
Specimens
Formalin-fixed paraffin-embedded specimens of oral SCC were retrieved from the University of Iowa Oral and Maxillofacial Pathology Laboratory.
Cells
HNSCC Cells, Keratinocytes
Two established HNSCC cell-lines Cal27 (tongue; ATCC, Rockville, MD) and 1483 (tongue; gift from Dr. P. Sacks, NYU, NY) were grown in DMEM/F12 (Invitrogen-GIBCO, Grand Island, NY) with 10% heat-inactivated FBS (Hyclone, Logan, UT). Primary tonsillar keratinocytes HTE1163 passages four-seven (gift from Dr. A. Klingelhutz, U. Iowa, Iowa City) were grown in KSFM with 0.2 ng/ml EGF and 30 μg/ml BPE (Invitrogen-GIBCO). All culture materials and reagents were certified endotoxin low/free. All cell lines were negative for human papillomavirus (HPV) and for mycoplasma.
Monocytes, Dendritic Cells (DC)
Monocytes were prepared as described [4, 5]. Monocytes were used as controls or differentiated into DC over 6 days with 1000 U/ml each GM-CSF and IL-4 (R&D Systems, Minneapolis, MN) in X-VIVO-15 at 37°C/7% CO2, with complete replacement of media and cytokines on alternate days. This differentiation produced DC-SIGN-low and DC-SIGN-high DC subsets.
Experimental Set-up
The outline of the experimental set-up is shown in Fig. 1c. The attached (DC-SIGN-low) and detached (DC-SIGN-high) subsets of DC harvested after monocyte differentiation were each cultured alone or at 1:1 ratios with HNSCC lines (Cal27 or 1483) or with primary keratinocytes HTE1163 in X-VIVO-15 for 3 days at 37°C, 7% CO2, parallel to HNSCC and keratinocytes cultured alone. The 3-day protocol reliably produced measurable effects, the cells did not overcrowd the cultures, and did not require feeding. All experimental conditions produced floating and adherent populations, which were analyzed separately for phenotype and migration. In this study we focused on the floating populations. For each donor 1, 2 and 3, monocytes were purified at least on four separate occasions to test both DC subsets with each SCC cell line in duplicate.
Fig. 1.

a Well (WD) or moderately differentiated (MD), oral SCC contain CD16+ cells with dendritic morphology. Sections of oral SCC specimens stained by IHC with HRP-DAB detection show brown CD16+ cells. b Cell lines selected for the study. Primary keratinocytes HTE1163, well-differentiated HNSCC 1483, and poorly differentiated HNSCC Cal27 cells were grown in Permanox slide-mounted chambers, formalin-fixed and stained by IHC for cell cycle/proliferation marker Ki67. c Detailed schematic of experimental set-up. d Phenotypes of Donor 1 DC. Monocytes differentiated with GM-CSF+IL-4 produced the attached (DC-SIGN-low) and detached (DC-SIGN-high) subsets, evaluated by flow cytometry. Numbers represent the mean fluorescence intensity (MFI) of antibody binding. NOTE: Surface phenotypes of DC from Donors 1, 2 and 3 are compared in Table 1
Flow Cytometry
Primary
Antibodies: Anti-CD11c-PECy5 clone 3.9, anti-CD38-PE clone HIT2 (BioLegend, San Diego, CA), anti-DC-SIGN-PE clone 120507 (R&D Systems), anti-CD1a-PE clone HI149, anti-CCR7-FITC clone 3D12, anti-CD36-FITC clone NL07, anti-CD163-biotin clone GHI/61 (eBioscience, San Diego, CA), anti-CD16-PE clone 3G8, anti-CD86-PE clone HA5.2B7 (Immunotech, Marseille, France). Secondary reagents: Strepavidin-PE (Southern Biotech Associates, Inc., Birmingham AL). Control antibodies: isotype and fluorochrome-matched Igs (Southern Biotech; BD Pharmingen, San Jose, CA). Annexin V staining was performed using the Annexin V-FITC Apoptosis Detection Kit (eBioscience).
Flow Cytometry was performed as described previously [5]. Data were collected on FACScan flow cytometer using CellQuest software and analyzed using FlowJo software (TreeStar, Ashland, OR). 30,000–50,000 events were collected per sample. Cells were gated on the basis of expression of DC-specific marker CD11c, to separate the DC and SCC/keratinocyte populations in co-culture experiments.
Migration Assay
Migration was assayed in 24-well Companion Plates using inserts with 8-μm pore membranes (BD Falcon). Cells collected from DC+/−HNSCC cultures were plated into inserts in duplicate, triplicate or quadruplicate. Bottom chambers contained medium with or without 20–40 ng/ml CCL21 (Peprotech, Rocky Hill, NJ). After 18 h at 37°C/7% CO2, contents of the lower chambers were centrifuged onto slides, dried and fixed in 1% formalin. To easily distinguish DC derived from co-cultures, slides were stained by IHC for pan-cytokeratin, counterstained with hematoxylin and cover-slipped. Photographs using 10X objective were used to count all DC. DC counts were normalized to an input of 10,000 DC per chamber based upon flow cytometry data of the input CD11c+ DC and CD11c− HNSCC cells.
Immunohistochemistry (IHC)
Antibodies
Pancytokeratin, clones AE1/AE3 (LabVision), anti-CD16 (Serotec), anti-Ki67 (Labvision), MIgG (negative control). Antibodies to pancytokeratin and to Ki67 were diluted to 2.5 mg/ml in permeabilization buffer, containing 1% saponin, 5% FBS, 0.01% sodium azide in PBS. Anti-CD16 was diluted to 5 mg/ml in FACS buffer. Negative control preparations were matched to primary antibodies for isotype, concentration and buffer. IHC was performed using LabVision kits, LP Value HRP-DAB or One-Step HRP-DAB as described previously [4, 5].
ELISA
ELISA for TNF-alpha (Duoset, R&D Systems) was performed according to the manufacturer instructions. Briefly, Nunc MaxiSorp™ 96-well plates were coated with cytokine-specific antibodies, blocked, and incubated sequentially with standards or sample supernatants (in triplicate), followed by biotinylated cytokine-specific antibodies, avidin-conjugated HRP and tetramethyl benzidine (TMB) substrate (BioFX Laboratories, Inc., Owings Mills, MD). Optical density at 450–650 nm or 450–540 nm, as recommended by the manufacturers (Powerwave X, Bio-Tek Instruments, Inc., Winooski, VT) was converted into concentration using corresponding standard curves.
Statistical Analysis
Analysis of the DC Phenotype
First, MFI of negative controls were subtracted from the CD16, CD1a and CD86 MFIs. The levels of CD16, CD1a and CD86 on DC subsets in the presence of HNSCC cells were compared to those in the absence of HNSCC cells using the two-tailed Student’s t test.
Analysis of Migration Assays
Statistical significance of differences between groups was assessed by one-way ANOVA, including Tukey-Kramer post-tests for multiple comparisons.
All analyses were performed using the Prism software (GraphPad, San Diego, CA). Probability values (P) of ≤0.05 were considered indicative of significant differences between data sets.
Results
CD16+ Monocyte Lineage Cells are Prevalent in Moderately Differentiated and Well Differentiated HNSCC
SCC of the upper aerodigestive tract vary in differentiation, yet are consistently associated with CD68+ monocyte lineage cells and other inflammatory components. Figure 1a shows that both well- and moderately differentiated SCC of the oral cavity contain numerous CD16+ mononuclear cells, in the epithelial islands and in the supporting connective tissue. We reported previously that CD16+ cells in SCC matched the morphology and distribution of CD1a+ DC, while others matched the morphology and distribution of CD68+ monocytes and macrophages [5]. On the other hand, CD56+ NK cells that are also mononuclear and express CD16 were exceptionally rare, and never seen in the epithelial nests (not shown).
Accordingly, HNSCC cell lines selected for in vitro experiments were of different levels of differentiation (Fig. 1b). The control primary keratinocytes HTE1163 formed nests of small undifferentiated and large differentiated cells, and the cycling Ki67+ cells were located at the nest periphery, consistent with normal epithelial architecture. HNSCC 1483 was relatively well-differentiated, forming nests with small undifferentiated and large differentiated cells, and with few cycling Ki67+ cells. The poorly-differentiated HNSCC line Cal27 formed nests that coalesced into rapidly expanding sheets of uniformly sized cells with numerous Ki67+ cells throughout.
DC Derived from Monocytes In Vitro Segregate into Attached and Detached Subsets
The standard method for making monocyte-derived DC in vitro is to culture peripheral blood monocytes with GM-CSF and IL-4 over 6–7 days, producing attached and detached subsets. The detached cells are used for experimentation and immunotherapy applications as fully differentiated monocyte-derived DC. Both subsets represent a continuum of monocyte-lineage cells, but the characteristics of the attached subset are somewhat obscure. We found that the two subsets were similar, but had several distinct phenotypic and functional features.
The diagram in Fig. 1c shows how the two monocyte-derived DC subsets, the DC-SIGN-high and DC-SIGN-low cells were generated and used in the co-culture experiments. The patterns of receptor expression on DC from different donors were similar (Table 1). In our study, both the attached and detached DC subsets derived from monocyte differentiation were 98–99% CD11c+ CD14-negative (Fig. 1d and Table 1). Consistent with immature DC, both subsets expressed DC-SIGN, CD1a, CD36 and intermediate to low levels of CD86, but had little if any CD163, CD16 or CCR7 (Fig. 1d), high levels of MHC class II and no CD83 (not shown). In distinction, detached cells consistently expressed 2–3-fold more DC-SIGN than did the attached cells, so the two populations are referred to as the DC-SIGN-high and DC-SIGN-low subsets, respectively. In addition, CD36 and CD1a expression were higher, but CD86 levels were usually lower on the detached, DC-SIGN-high cells.
Table 1.
Cell surface phenotypes of attached (DC-SIGN-low) and detached (DC-SIGN-high) DC subsetsa
| Donor 1 | Donor 2 | Donor 3 | ||||
|---|---|---|---|---|---|---|
| DC-SIGN-low | DC-SIGN-high | DC-SIGN-low | DC-SIGN-high | DC-SIGN-low | DC-SIGN-high | |
| DC-SIGN | 520.4 | 1065 | 210.7 | 597.3 | 695 | 1174.4 |
| CCR7 | 0.8 | 2.7 | 0.1 | 0.2 | 1.5 | 2.4 |
| CD1a | 16.4 | 40 | 6.7 | 10.3 | 14 | 26.4 |
| CD11c | 152.6 | 170.7 | 77 | 124.4 | 218.9 | 211 |
| CD16 | 0.2 | 1 | 2.1 | 1.9 | 0.8 | 2.7 |
| CD36 | 26.2 | 58.7 | 29.1 | 32 | 39.2 | 56.2 |
| CD86 | 76.4 | 39 | 191.7 | 102.3 | 43 | 33.4 |
| CD163 | 3.4 | 3 | 6.7 | 3.3 | 4.8 | 2.7 |
aDC-SIGN-low and detached DC-SIGN-high DC subsets were derived from Donor 1, 2 and 3 monocytes after 6 days of differentiation in the presence of GM-CSF and IL-4. Cells were prepared as described in Fig. 1c. Numbers represent MFI values after subtracting the negative control MFI
Both DC Subsets Greatly Facilitate Detachment of Live HNSCC Cells
To address the direct impact of DC and carcinoma cells on each other, each of the monocyte derived subsets, i.e. DC-SIGN-high and DC-SIGN-low DC, were combined with each of the two carcinoma cell lines at 1:1 ratios and cultured for 3 days. In all cultures, each of the DC and carcinoma cell types produced typical adherent populations as well as floating populations. Particularly remarkable was the progressive accumulation of floating mixed cell rafts in both DC-SIGN-high+HNSCC cell cultures and DC-SIGN-low+HNSCC cell cultures. The viable fractions of floating HNSCC cells were quantified using Annexin V, propidium iodide (PI) and CD11c. A representative experiment with Donor 1 DC is shown in Fig. 2. The vast majority of floaters in the Cal27 and 1483 cultures without DC were dead or dying Annexin V+ (Fig. 2, a and c, left panels) and/or PI+ (Supplementary Figure 1). Also, as anticipated, the PI+ HNSCC cells non-specifically stained with the anti-CD11c antibody (Supplementary Figure 1). In co-cultures with Cal27 cells, the DC-SIGN-low and DC-SIGN-high subsets (CD11c+Annexin V-negative cells) represented 24.9% and 29.1%, respectively, of all floaters in these co-cultures. In the DC-1483 co-cultures, DC-SIGN-low DC represented 35.7% of all floaters, while DC-SIGN-high constituted 26.8%. Remarkably, the proportion of live tumor cells increased dramatically in the presence of both DC subsets from any of the three donors. In contrast to 14.9% viable floaters in Cal27 cultures without DC (Fig. 2a, left panel), live Cal27 cells represented 29.2–31.1% of the DC+Cal27 floaters (middle and right panels). Only 6.53% of 1483 floaters were live in the absence of DC, but in co-cultures with DC-SIGN-low cells, 26.5% of all floaters were viable1483 cells, while a striking 51% of the mixed DC-SIGN-high DC+1483 floaters were viable tumor cells (Fig. 2c). Similar results were obtained with DC from Donor 2 and Donor 3 (summarized in Fig. 2b and d).
Fig. 2.

Dendritic cells affect viability of detached HNSCC cells. HNSCC cells were plated alone or combined at 1:1 ratios with DC-SIGN-low or DC-SIGN-high DC and cultured for 3 days. Floating cell populations were stained with anti-CD11c–PECy5, Annexin V-FITC (AnnV-FITC) and propidium iodide (PI) and analyzed by flow cytometry. Dot plots from Donor 1 DC subsets with Cal27 (a) and with 1483 (c) are shown. CD11c was used to distinguish between live DC and SCC populations. Only the PI-positive SCC cells non-specifically stained with the DC-specific anti-CD11c antibody. (Supplementary Figure 1). Fold enrichment of total viable floating HNSCC cells (Cal27 and 1483, respectively) in the presence of each DC subset for all donors (mean ± SEM from two independent experiments for each donor/HNSCC cell line combination) relative to HNSCC cells cultured alone (b and d)
Further analysis revealed that under the influence of DC, the actual numbers of live floating Cal27 increased 8–14-fold (Fig. 2b), and live floating 1483 cells increased 12–22-fold (Fig. 2d). With or without DC, the total live tumor cell numbers recovered were similar, but many more tumor cells were floating in the presence of DC, suggesting that DC facilitated the detachment of HNSCC cells. Interestingly, neither DC subset increased the viable fraction of floating normal keratinocytes (Supplementary Figure 2). Moreover, peripheral blood monocytes did not change the viable fraction of floating tumor cells (Supplementary Figure 3). Therefore, monocyte differentiation appeared necessary, and DC-SIGN-high DC of all three donors, as a group, were much more effective than DC-SIGN-low cells (p < 0.006 in Cal27 co-cultures and p < 0.007 in 1483 co-cultures).
HNSCC Cells Promote a CD1a+CD16+CD86dim DC Phenotype
The striking effects of DC on HNSCC cells prompted analysis of the associated DC. As oral SCC specimens contained an abundance of CD16+ cells matching CD1a+ DC [5], and monocytes were found to upregulate CD16 expression in the presence of HNSCC cells, we tested the ability of HNSCC cells to promote CD16 expression on DC in 3-day co-cultures.
Donor 1 DC subsets incubated alone expressed low levels of CD16 (Fig. 3). Both Cal27 (Fig. 3a) and 1483 (Fig. 3b) induced significant increases in CD16 expression, which was remarkably similar to Donor 2 and 3 DC (summarized in Table 2). Besides CD16, Cal27 and 1483 cells promoted the expression of CD1a. Depending upon the donor, DC cultured with Cal27 or 1483 expressed more CD1a than DC alone (1.6–16-fold and 2–9-fold, respectively, Fig. 3 and Table 2). However, CD86 was usually lower or similar to that on DC cultured alone (Fig. 3), and this was true of both DC subsets from all donors (Table 2). In control experiments with keratinocytes, CD16 and CD1a expression increased on both DC-SIGN-low and DC-SIGN-high Donor 1 subsets, while CD86 expression decreased (Supplementary Table 1).
Fig. 3.

HNSCC cells affect DC phenotype. Donor 1 DC-SIGN-low and DC-SIGN-high DC subsets were cultured for 3-days alone or with HNSCC cell lines Cal27 (a) or 1483 (b). Resulting plastic-attached and floating populations were analyzed by flow cytometry. The floating populations gated on the CD11c+ DC and MFI of antibody binding are shown. Data are representative of at least two independent experiments. NOTE: Statistical analysis for Donors 1, 2 and 3 is shown in Table 2. c) Donor 1 DC were cultured alone or in co-cultures, as indicated, with or without 200 ng/ml LPS for 3 days. Supernatants were stored frozen at −80°C followed by ELISA. “None”—control, no HNSCC cells (only DC+/− LPS). Results are representative of at least three independent experiments
Table 2.
HNSCC cells significantly affect DC phenotypea
| Cal27+DC-SIGN-low Vs. DC-SIGN-low | Cal27+DC-SIGN-high Vs. DC-SIGN-high | 1483+DC-SIGN-low Vs. DC-SIGN-low | 1483+DC-SIGN-high Vs. DC-SIGN-high | |||||
|---|---|---|---|---|---|---|---|---|
| Fold increase | p value | Fold increase | p value | Fold increase | p value | Fold increase | p value | |
| CD16 | 6.5–45 | 0.002 | 3.3–69 | 0.015 | 2–5.9 | 0.002 | 2.5–7.5 | 0.02 |
| CD1a | 1.4–16 | 0.04 | 1.3–2.7 | 0.05 | 2.2–8.9 | 0.003 | 2.1–8.1 | 0.0005 |
| CD86 | 0.53–1 | 0.5 | 0.6–1 | 0.4 | 0.4–1.06 | 0.3 | 0.7–1.4 | 0.8 |
aThe relative changes in expression of CD1a, CD16 and CD86 on DC subsets in the presence of HNSCC cells for all three donors and duplicate experiments (n = 6) were analyzed by two-tailed Student’s t test
As CD16 expression on monocytes and DC suggests a pro-inflammatory phenotype, we evaluated the production of cytokines in co-cultures with HNSCC cells. We used toll-like receptor 4-specific agonist lipopolysaccharide (LPS) to activate Donor 1 DC in the presence and absence of HNSCC cells (Fig. 3c). LPS induced the production of a inflammatory cytokine TNF-alpha in DC, which increased significantly in the presence of HNSCC cells Cal27 and 1483.
Overall, these results indicate that both well-differentiated and poorly-differentiated HNSCC cells and keratinocytes can promote an immature pro-inflammatory CD1abrightCD16+CD86dim DC phenotype, which is consistent with the phenotype seen in HNSCC specimens.
HNSCC Cells Influence Steady-state and CCL21-induced Migration of DC and their Expression of CCR7
We tested the possibility that the floating CD16+ DC in our co-cultures could be more migratory. DC are known to migrate to lymph nodes under the influence of CCR7-CCL21/19, but the impact of HNSCC cells on the expression or function of CCR7 in DC has not been demonstrated.
We assessed migration of floating DC, including the steady-state and CCR7-regulated migration, as well as the expression of CCR7 and a co-receptor CD38 which is required for CCR7 function (Figs. 4 and 5). Interestingly, there was a divergence of DC responses from different donors. Cal27 potentiated the expression of CCR7 (and to some extent, CD38) on both subsets of Donor 1 and Donor 2 DC, but not on Donor 3 DC (Fig. 4a, c, e). Donor 3 DC-SIGN-high cells actually dropped CCR7 expression when cultured with Cal27 (Fig. 4e). On the other hand, 1483 caused increases in CCR7 expression on all DC-SIGN-high (1.5–2-fold) and DC-SIGN-low (2–3-fold) subsets, with a concurrent increase in CD38 (Fig. 5a, c, e). In control experiments, keratinocytes marginally influenced Donor 1 DC subsets (1.2–1.5 fold increases in CCR7 and CD38) (Supplementary Figure 4a).
Fig. 4.

Cal27 cells affect DC migration and the expression of CCR7 and CD38 on DC. DC-SIGN-low and DC-SIGN-high subsets from Donors 1, 2, and 3 were each co-cultured for 3-days with HNSCC cell line Cal27. Floating populations from the co-cultures were analyzed for CCR7 and CD38 expression by flow cytometry (a, c, e), as well as tested in migration assays (b, d, f) to examine steady-state migration (Media) and CCL21-induced migration. a, c, e The MFI of antibody binding is in the upper right corner of each panel, where the top number is MFI on DC cultured alone and the lower bold number is the MFI on DC from the co-cultures with HNSCC cells. b, d, f Error bars = standard error for DC alone; and standard deviation for DC-Cal27 co-cultures. The data are representative of two independent experiments for each donor. NOTE: Statistical analysis of DC migration for Donors 1, 2 and 3 are shown in Table 3
Fig. 5.

1483 cells affect DC migration and the expression of CCR7 and CD38 on DC. All procedures with 1483 cells were the same as with Cal27 cells (please see legend to Fig. 4). The data are representative of two independent experiments for each donor. NOTE: Statistical analysis of DC migration for Donors 1, 2 and 3 are shown in Table 3
The migration assays revealed another divergence of DC behavior which was donor and subset-dependent. For Donor 1, steady-state migration of DC-SIGN-high DC cultured alone (“media”) was slightly better than in DC-SIGN-low cells, but Cal27 strongly stimulated steady-state migration of DC-SIGN-high cells (Fig. 4b, Table 3). 1483 cells produced similar, but smaller effects on both Donor 1 subsets (Fig. 5b, Table 3). DC-SIGN-high cells were also more responsive to CCL21 than DC-SIGN-low DC, particularly in the presence of HNSCC cells, and more so with Cal27 (Table 4).
Table 3.
Statistical analysis of DC migration. Steady-state migration of DC-SIGN-high vs DC-SIGN low subsetsa
| Donor | DC alone | DC+Cal27 | DC+1483 | DC+keratinocytes |
|---|---|---|---|---|
| 1 | p < 0.001 | p < 0.001 | p < 0.05 | p < 0.001 |
| 2 | p < 0.001 | p < 0.001 | p < 0.001 | ND |
| 3 | p < 0.001 | p = 0.5 | p < 0.001 | ND |
aFor each donor DC, the steady-state migration of DC-SIGN-high vs. DC-SIGN-low subsets in the absence or presence of HNSCC cells or keratinocytes was assessed by one-way ANOVA, including Tukey-Kramer post-tests for multiple comparisons. P ≤ 0.05 indicates that the steady-state migration of the DC-SIGN-high DC was significantly greater than that of the DC-SIGN-low subset (bold)
Table 4.
Statistical analysis of DC migration. DC subset response to CCL21a
| Donor | DC-SIGN-low | DC-SIGN-high | Cal27+DC-SIGN-low | Cal27+DC-SIGN-high | 1483+DC-SIGN-low | 1483+DC-SIGN-high | Keratinocytes+DC-SIGN-low | Keratinocytes+DC-SIGN-high |
|---|---|---|---|---|---|---|---|---|
| 1 | p = 0.2 | p = 0.08 | p = 0.4 | p < 0.001 | p = 0.09 | p < 0.01 | p = 0.3 | p = 0.4 |
| 2 | p = 0.08 | p = 0.07 | p = 0.2 | p < 0.05 | p = 0.1 | p < 0.05 | ND | ND |
| 3 | p < 0.01 | p < 0.01 | p = 0.3 | p = 0.4 | p = 0.4 | p = 0.08 | ND | ND |
Table combines data from the duplicate experiments for each donor
aMigration of DC subsets in response to CCL21 in each indicated condition was assessed by one-way ANOVA, including Tukey-Kramer post-tests for multiple comparisons. P ≤ 0.05 indicates that the response to CCL21 was statistically significant (bold)
Donor 2 DC-SIGN-high DC showed more steady-state migration than DC-SIGN-low cells, and while Cal27 cells stimulated steady-state migration in both subsets, 1483 did so only in the DC-SIGN-high subset (Figs. 4d and 5d, Table 3). Cal27 and 1483 both stimulated CCL21-induced migration in Donor 2 DC-SIGN-high cells (Table 4).
Donor 3 DC migratory responses were quite different (Figs. 4f and 5f). First, steady-state migration of both DC subsets cultured alone was very high, and both subsets were somewhat responsive to CCL21 (Table 4). In direct contrast to Donors 1 and 2, both Cal27 and 1483 strongly suppressed all migratory behavior of both DC subsets, though 1483 was less effective than Cal27 with DC-SIGN-high cells (Figs. 4f and 5f).
The control primary keratinocytes did not influence Donor 1 DC migration, correlating with negligible impact on CCR7 and CD38 expression (Supplementary Figure 4a and b).
To summarize steady-state migration (Table 3), in the absence of HNSCC cells, the DC-SIGN-high DC were typically more migratory than DC-SIGN-low cells. In two donors, both HNSCC lines significantly stimulated migratory behavior of DC-SIGN-high DC. In distinction, both DC subsets from the third donor showed the reverse pattern, i.e. they were more active when cultured alone, and were negatively affected by HNSCC cells.
To summarize the effects of HNSCC cells on CCR7 expression and function (Table 4), DC-SIGN-high cells from Donors 1 and 2 responded to CCL21 significantly better in the presence of HNSCC cells (0.001 < p < 0.05), which directly correlated with CCR7 and CD38 up-regulation. Interestingly, although the DC-SIGN-low subsets from Donors 1 and 2 experienced increases in CCR7 and CD38 expression comparable to DC-SIGN-high DC, this did not translate into increased migration towards CCL21 (0.09 < p < 0.4). In contrast, HNSCC cells significantly impaired CCL21-induced migration of both DC subsets from Donor 3 (p < 0.001), which correlated with low CCR7 expression.
DC Migration Patterns in Response to HNSCC were Reproducible with DC Derived from Multiple Unrelated Donors
Given the two major patterns of DC migration in response to HNSCC cells observed with Donors 1, 2 and 3, i.e. HNSCC-induced increase in DC migration or HNSCC-induced decrease in migration, we tested additional donors of DC precursors. Similar to the first three donors, none of the Donors 4–9 had history of cancer. The additional donors were matched with the first three by age, because Donors 1 and 2 were middle-age (>50) and shared similar patterns, i.e. increased migration in the presence of HNSCC cells, while Donor 3 with the reverse pattern was young (under 35 years).
As the most pronounced effects were seen in the DC-SIGN-high subsets from Donors 1, 2 and 3, the new migration experiments were performed with DC-SIGN-high DC subset. The results are shown in Fig. 6. Similar to Donors 1 and 2, DC from two out of the three new middle-age donors (50–65 years, Donors 5 and 6) showed increased migratory behavior in response to HNSCC cells. DC from the third middle-age donor (Donor 4) showed both patterns: decreased migration in response to Cal27 and increased migration in response to 1483 cells. In the young age group (25–35 years) one out of three new donors (Donor 7) produced the same pattern as Donor 3, i.e. decreased DC migration upon co-culture with HNSCC cells. DC from the other two young donors (Donors 8 and 9) showed the same patterns as most of the older group, i.e. increased migration in response to either HNSCC cell line.
Fig. 6.

Persistence of the two identified migration patterns in SCC co-cultures with DC from multiple donors. DC-SIGN-high subsets from Donors 4–9 were each co-cultured for 3-days with HNSCC cell line Cal27 or 1483 respectively. Floating populations from the co-cultures were tested in migration assays with and without CCL21. Error bars represent standard deviations of triplicate ELISA measurements. Donors 4-6 were between 50 and 65 years of age; Donors 7-9 were between 25 and 35 years of age
Together, the dominant pattern irrespective of age or sex for all nine donors tested (80% of older donors and 50% of younger donors) was an increase in DC migration upon co-culture with HNSCC cells. Less common was the reverse pattern, seen mainly in the young age group (50% of young donors). Only one out of nine donors (older group) showed a combination of the two patterns, splitting the responses to the two different HNSCC cell lines.
Discussion
Outcomes of patient treatments for SCC of the upper aerodigestive tract have improved very little in the last five decades, and 5-year survival, regardless of tumor grade (i.e. level of tumor cell differentiation), remains under 60% [3, 24, 36]. This is partly due to the focus of standard treatments only on the tumor cells, and the lack of knowledge of the kinds of support tumor cells receive from their microenvironment that may protect them from treatment-induced elimination. More recently, there has been increased interest in the mechanisms that regulate tumor cell-stroma relationships. It is now obvious that some aspects of inflammation in the tumor microenvironment are involved in the carcinogenesis and the progression of HNSCC, while the tumor cells in turn influence their surrounding microenvironment. Our focus is on the innate immune system monocyte lineage cells that are prominently featured in the tumor microenvironment.
We have systematically validated our approach by evaluating human SCC specimens and correlating with other clinical studies, to ensure that our in vitro system was producing results consistent with evidence obtained in vivo. In this study, we used in vitro monocyte-derived DC, because mucosal and inflammatory DC develop from monocytes [9, 11, 13], and because monocyte-derived DC are central to cancer immunotherapy [26–28]. This approach was selected to examine more directly how normal DC and SCC cells influence each other in the absence of numerous other variables present in vivo, including the global effects of advanced cancer. The DC-SIGN-high DC subset obtained by this approach is routinely used for in vitro studies and for cancer immunotherapy. The other subset, DC-SIGN-low cells, had received little attention to date and in this study revealed some differences from the DC-SIGN-high cells. In contrast to DC-SIGN-low cells, DC-SIGN-high DC were no longer attached to the plastic by the end of GM-CSF+IL-4-induced differentiation, and expressed more CD1a along with somewhat less CD86, a marker of activation and maturation. Both DC subsets were essentially CD16-negative at the beginning of the co-culture experiments. With the experimental 3-day incubation, CD16 levels increased on both DC subsets, and control keratinocytes as well as HNSCC cells significantly enhanced the up-regulation of this Fc-gamma RIII in each subset of each donor tested. Previously, we showed that HNSCC cells also promoted CD16 expression on normal peripheral blood monocytes, although that effect was relatively mild [5]. In addition, we found that soluble factors released by HNSCC cells may be sufficient to induce CD16 expression on monocytes [5]. These data are consistent with the identification of numerous CD16+ monocyte-lineage cells in clinical specimens of HNSCC (ref. [5] and Fig. 1). Given that most peripheral blood monocytes are CD16-negative, express CCR2 and migrate into inflamed areas and into the HNSCC microenvironment in response to CCL2 [4, 6], these monocytes and the monocyte-derived DC could then gain CD16 expression through interactions with HNSCC cells or their products, and possibly by interacting with other mucosal cells.
An important reason CD16+ monocytes and monocyte-derived DC are of special interest is that they are associated with chronic inflammatory states [33, 37], and chronic inflammation is consistently present in the microenvironment of HNSCC. Here we found that the DC exposed to HNSCC cells not only increased CD16 expression, but also produced more pro-inflammatory cytokine TNF-alpha in response to LPS. Other studies showed that DC derived from CD16+ monocytes were highly migratory and able to reverse transmigrate endothelial layers in vitro [33]. In our study, the steady-state migration of floating DC from most donors increased 1.5–7-fold under the influence of HNSCC cells. Remarkably, migratory patterns of floating DC from two donors were just the opposite: while highly migratory on their own, incubation with either HNSCC cell line caused major reductions in their steady state migration. Moreover, CCR7 expression and CCL21-induced migration were similarly influenced by HNSCC cells, both changing parallel to the steady-state migration patterns. The strong HNSCC cell influence on DC migration contrasted with the lack of keratinocyte influence, which indicates the divergence of the mechanisms that regulate DC phenotype from those regulating DC migration.
HNSCC cells also supported increases in CD1a expression and some suppression of CD86 levels, consistent with a tolerogenic DC phenotype described previously [17, 24, 25]. Early studies showed a positive correlation between high density of tumor infiltrating CD1a+ DC with a better prognosis [38, 39], although those studies did not test the samples for human papillomavirus (HPV). This is important, because relative to HPV-negative HNSCC, HPV+ carcinomas associate with better prognosis [40, 41], and we found that CD1a+ DC infiltrate HPV+ HNSCC in large numbers (manuscript in preparation). More recent studies revealed that tumor infiltrating DC contribute to immune escape due to their immature phenotype and low density of co-stimulatory molecules CD80 and CD86 [42, 43]. Phagocytosis of tumor cells is known to contribute to a CCR7+ immature DC phenotype, and in our study, migrating DC showed evidence of phagocytosis of cytokeratin-positive cells (data not shown). An important point to make is that, according to our data, specific HNSCC cell effects on DC may depend on the host. On one hand, as illustrated with most donors, CCR7/CCL21-dependent migration of CD1abrightCD86dim DC to lymph nodes could result in T cell tolerance, as described with CCR7+ immature or semimature DC [17, 44]. On the other hand, in a Donor 3 and Donor 7-like setting, HNSCC-associated DC may be prevented from reaching the lymph node, potentially resulting in a failure of T cell-dependent responses to the tumor cells, and perhaps even to the colonizing microorganisms identified in HNSCC [45]. Therefore, the HNSCC cells themselves could be protected from a T cell response in either case. Such an outcome would be consistent with the well-known tumor cell escape from T cell-mediated immune responses.
In general, high expression of DC-SIGN positively correlated with more migratory behavior. Notably, these migratory patterns were representative of floaters only, while the adherent DC-HNSCC and DC alone populations recovered at the end of the 3-day co-culture experiments were consistently sedentary (data not shown). These observations offer additional clues to the characteristics required for a migratory phenotype and suggest that HNSCC cells may affect the DC cytoskeleton and G-protein-coupled receptors.
Together, the results discussed above suggest that the consistent stimulatory effect of HNSCC cells on CD16 expression in monocyte-derived DC is likely to be regulated by a mechanism distinct from one that controls steady-state migration of DC. Potentially relevant is the age of the donors. The profile of peripheral blood DC and monocytes changes with age [46], and CD16+ monocytes [46], as well as chronic inflammatory conditions and malignancies (especially carcinomas) become much more common in the 6th–7th decades. Although the donor population we investigated was small, there were interesting trends in the frequency of the two migratory patterns in the two age groups selected. The dominant pattern of DC migration, i.e. increased migration in the presence of HNSCC cells, was characteristic of the older age group (4 out of 5, male:female 2:2), while the fifth donor (male) showed a combination of two patterns. The reverse pattern was seen in 50% of the young group (1 male and 1 female). However, the donor population was representative of many nationalities and different races, so it is not clear, whether the distinct patterns are related mainly to donor age, or to their ethnic background. Further studies will be directed towards understanding the significance of the migratory patterns, and at the underlying reasons for the observed distinctions. Whether migratory behavior of DC and/or DC responses to malignant cells are somehow affected by aging, by ethnic background, or by pathologic conditions related to aging or ethnic background, remains to be established.
A particularly striking effect of monocyte-derived DC was the dramatic, one to two orders of magnitude increase in detached live HNSCC cells, which contrasted with the lack of such effect on primary keratinocytes. The DC-SIGN-high DC were significantly more effective than DC-SIGN-low cells, while the undifferentiated precursors, i.e. monocytes, made no significant impact. This HNSCC cell detachment is likely related to the marked increase in the expression of matrix metalloproteinases we observed in the co-cultures (data not shown). The detached HNSCC cells showed good capacity for survival upon transfer to new cultures, although additional studies are needed to characterize these cells and quantify the effects of DC on HNSCC cell survival. To our knowledge, this is the first demonstration that the DC can profoundly influence the detachment of HNSCC cells.
We believe that allogeneity had no impact in this study. The monocyte-DC preparations were performed using a 2-step approach, which is significantly better than the standard adherence preps, and resulted in ~97–99% purity, i.e. almost no lymphocytes. Further, the co-cultures were only 3 days long, with an additional 18 h for migration. Therefore, contributions of the important MHC class I specific receptors on T cells, B cells or NK cells (TCR, BCR and KIR) to the functions we identified are very unlikely. Although monocytes and DC express leukocyte Ig-like receptors (LILRs, also known as ILT, LIR, or CD85) some of which can interact with MHC, these receptors are not known to regulate DC migration or phenotype because of binding to MHC molecules [47, 48]. Moreover, DC from all donors similarly promoted the detachment of carcinoma cells, and only two significant patterns of DC migration were identified in nine donors.
The pronounced effect of DC on the detachment of HNSCC cells could facilitate the processes of invasion and metastasis [49]. When combined with the acquisition by DC of more migratory behavior, including responses to lymph node homing signals via CCR7, this leads to a potential model that HNSCC might migrate from their primary site to the draining lymph nodes in clusters with DC. This model is partly supported by our observations that CD1a+ DC are scattered throughout HNSCC nests in lymph nodes and in tumor nodules identified within lymphatic channels (manuscript in preparation). Our results also suggest that the outcomes of HNSCC cell interactions with DC may depend on the host, which further underscores a major role for non-tumor cells and the tumor microenvironment in cancer pathogenesis.
Electronic supplementary material
Primary keratinocytes affect the expression of CD16, CD1a and CD86 on DC-SIGN-high and on DC-SIGN-low subsets of Donor 1 monocyte-derived DC.1 (DOC 31 kb)
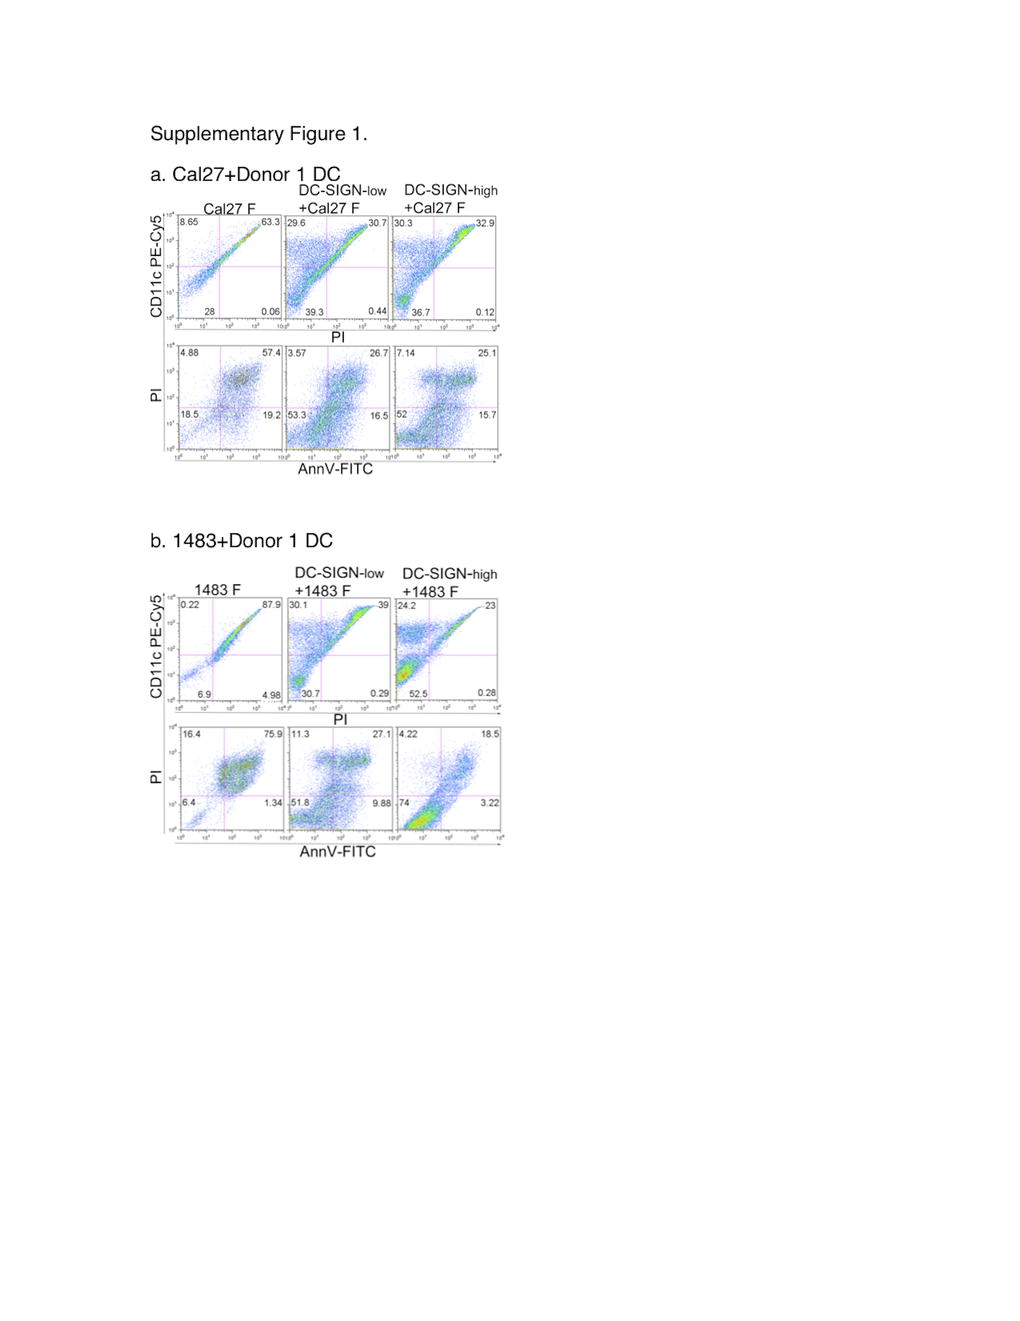
DC affect the numbers of floating live HNSCC cells. HNSCC cells were plated alone or combined at 1:1 ratios with DC-SIGN-low or DC-SIGN-high DC and cultured for 3 days. Floating cell populations were stained with anti-CD11c–PECy5, Annexin V-FITC and propidium Iodide (PI) and analyzed by flow cytometry. Dot plots (AnnV-FITC vs PI and CD11c-PECy5 vs PI) from Donor 1 DC subsets with Cal27 (a) and with 1483 (b) are shown. Only the dead/dying SCC cells non-specifically stained with the DC-specific anti-CD11c antibody. (JPEG 63 kb)
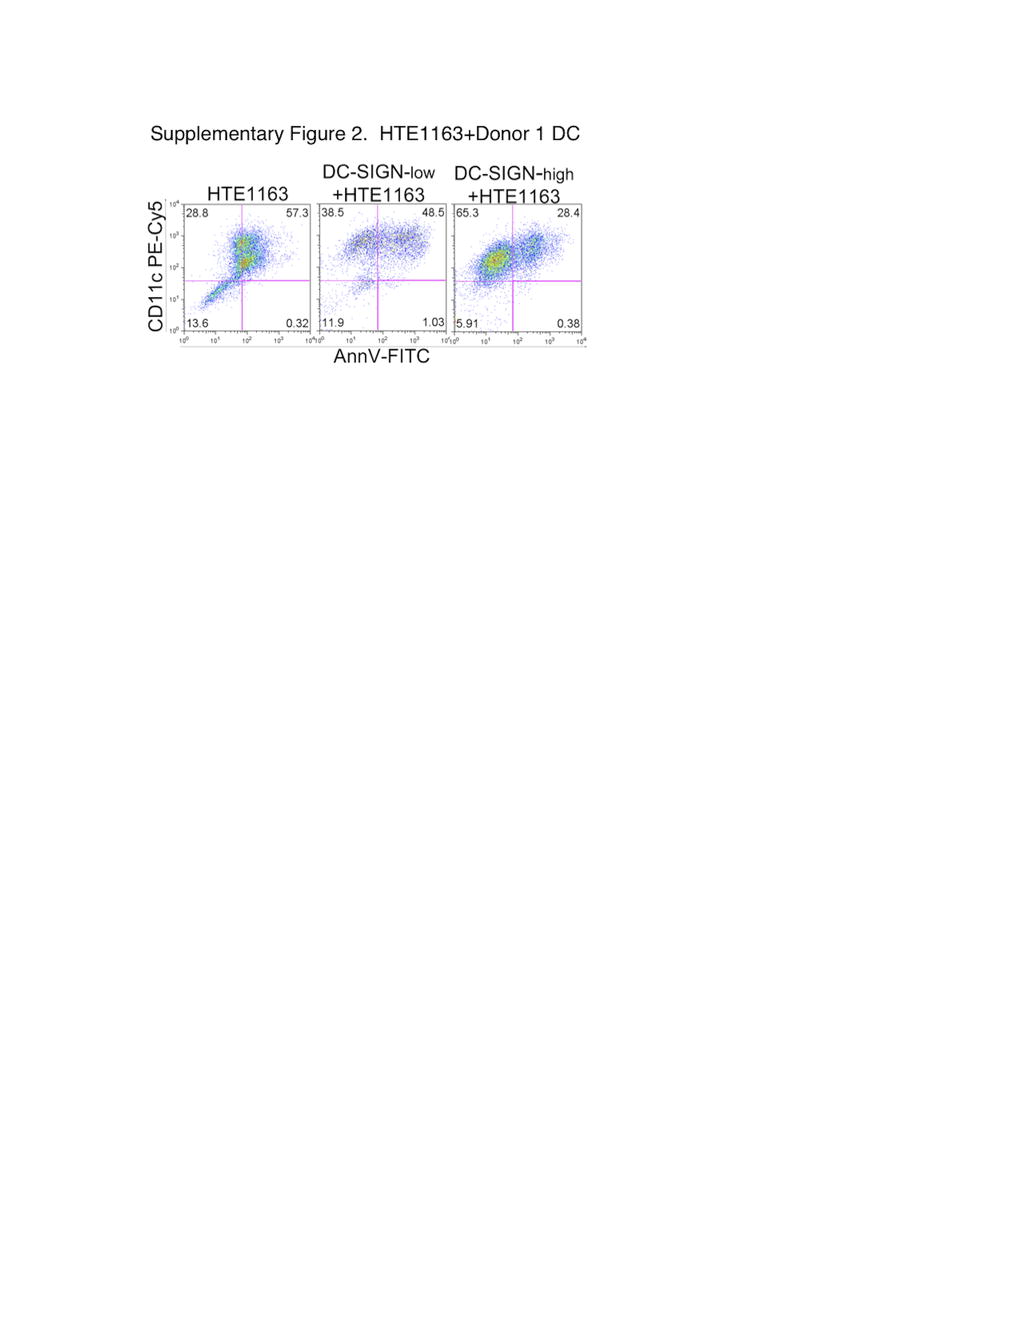
Lack of DC effects on the numbers of viable floating keratinocytes. Primary keratinocytes HTE1163 were cultured for 3 days alone or in combination with DC-SIGN-low or DC-SIGN-high subsets from Donor 1 at 1:1 ratios. Floating populations were collected and stained with anti-CD11c–PE-Cy5, Annexin V-FITC and propidium Iodide (PI) and analyzed by flow cytometry. (JPEG 37 kb)
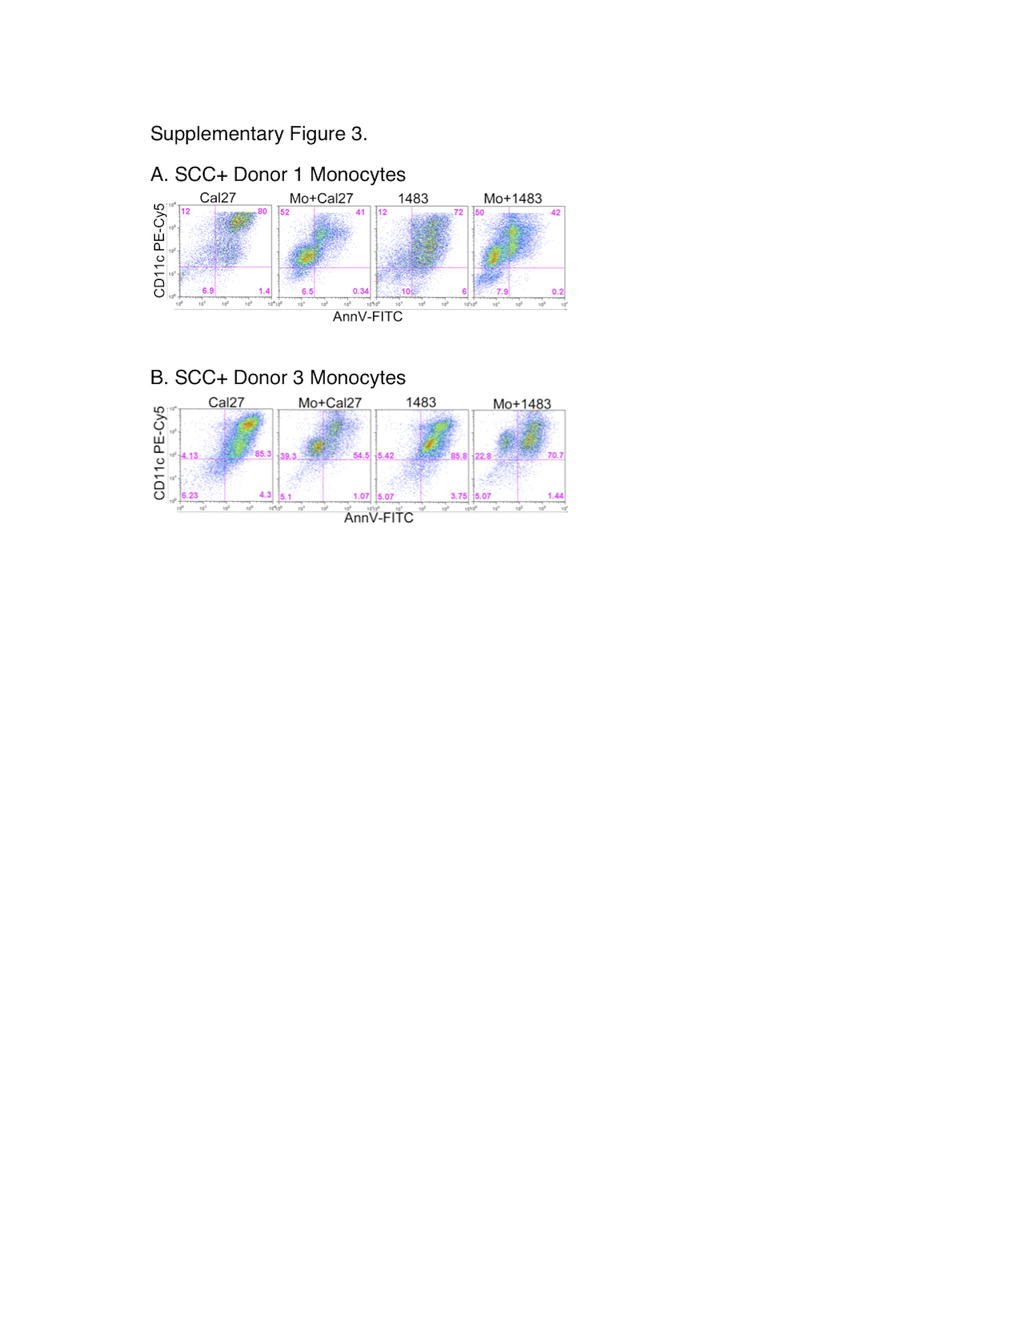
Lack of monocyte effects on the numbers of viable floating SCC cells. SCC cells were cultured for 3 days alone or in combination with Donor 1 or Donor 3 monocytes (Mo) at 1:1 ratios. Floating populations stained with anti-CD11c–PECy5, Annexin V-FITC and PI were analyzed by flow cytometry. Panels show dot plots for Donor 1 (a) and Donor 3 (b). (JPEG 46 kb)
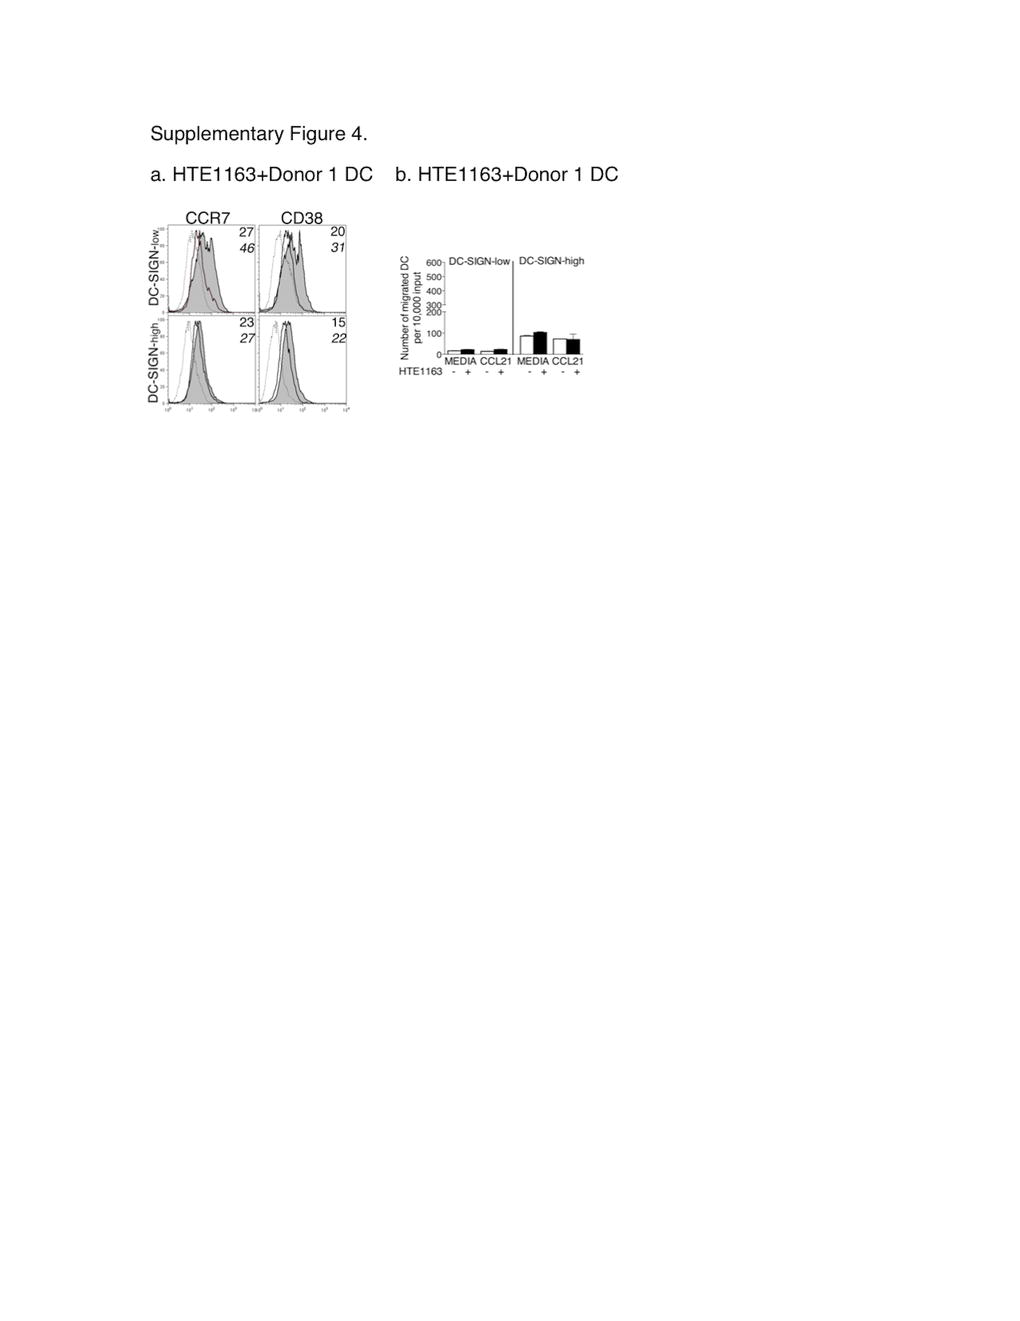
Donor 1 DC migration and expression of CCR7 and CD38 after co-culture with primary keratinocytes HTE1163. DC subsets derived from Donor 1 monocytes were cultured alone or with keratinocytes for 3 days, and the floating cells were stained and analyzed by flow cytometry or used in migration assays. (a) CCR7 and CD38 expression on gated CD11c+ cells (DC). MFI of antibody binding is shown in the upper right corner of each panel, top number is MFI of DC cultured alone and the lower bold number is the MFI on DC from the co-cultures with keratinocytes. The data are representative of two independent experiments. (b) Migration assays were performed as described in Methods. Error bars = standard error for DC alone; and standard deviation for DC-Cal27 co-cultures. The data are representative of two independent experiments. (JPEG 31 kb)
Acknowledgements
The study was supported by the NYU College of Dentistry.
We thank Dr. Annette Schlueter (University of Iowa), Dr. David N. Levy and Dr. Daniel Malamud (NYU College of Dentistry) for the critical review of the manuscript.
Footnotes
DC subsets were cultured for 3 days alone or with primary oral keratinocytes HTE1163. Numbers represent MFI values after subtracting the negative control.
References
- 1.Forastiere A, Koch W, Trotti A, Sidransky D. Head and neck cancer. N Engl J Med. 2001;345(26):1890–1900. doi: 10.1056/NEJMra001375. [DOI] [PubMed] [Google Scholar]
- 2.Jemal A, Siegel R, Ward E, Murray T, Xu J, Smigal C, Thun MJ. Cancer statistics, 2006. CA Cancer J Clin. 2006;56(2):106–130. doi: 10.3322/canjclin.56.2.106. [DOI] [PubMed] [Google Scholar]
- 3.McMahon S, Chen AY. Head and neck cancer. Cancer Metastasis Rev. 2003;22(1):21–24. doi: 10.1023/A:1022203816340. [DOI] [PubMed] [Google Scholar]
- 4.Kurago ZB, Lam-Ubol A, Stetsenko A, De La Mater C, Chen Y, Dawson DV. Lipopolysaccharide-squamous cell carcinoma-monocyte interactions induce cancer-supporting factors leading to rapid STAT3 activation. Head Neck Pathol. 2008;2(1):1–12. doi: 10.1007/s12105-007-0038-x. [DOI] [PMC free article] [PubMed] [Google Scholar]
- 5.Lam-Ubol A, Hopkin D, Letuchy EM, Kurago ZB (2010) Squamous carcinoma cells influence monocyte phenotype and suppress lipopolysaccharide-induced TNF-alpha in monocytes. Inflammation. doi:10.1007/s10753-009-9175-6 [DOI] [PMC free article] [PubMed]
- 6.Marcus B, Arenberg D, Lee J, Kleer C, Chepeha DB, Schmalbach CE, Islam M, Paul S, Pan Q, Hanash S, Kuick R, Merajver SD, Teknos TN. Prognostic factors in oral cavity and oropharyngeal squamous cell carcinoma. Cancer. 2004;101(12):2779–2787. doi: 10.1002/cncr.20701. [DOI] [PubMed] [Google Scholar]
- 7.Balkwill F, Mantovani A. Inflammation and cancer: back to Virchow? Lancet. 2001;357(9255):539–545. doi: 10.1016/S0140-6736(00)04046-0. [DOI] [PubMed] [Google Scholar]
- 8.Coussens LM, Werb Z. Inflammation and cancer. Nature. 2002;420(6917):860–867. doi: 10.1038/nature01322. [DOI] [PMC free article] [PubMed] [Google Scholar]
- 9.Varol C, Landsman L, Fogg DK, Greenshtein L, Gildor B, Margalit R, Kalchenko V, Geissmann F, Jung S. Monocytes give rise to mucosal, but not splenic, conventional dendritic cells. J Exp Med. 2007;204(1):171–180. doi: 10.1084/jem.20061011. [DOI] [PMC free article] [PubMed] [Google Scholar]
- 10.Landsman L, Varol C, Jung S. Distinct differentiation potential of blood monocyte subsets in the lung. J Immunol. 2007;178(4):2000–2007. doi: 10.4049/jimmunol.178.4.2000. [DOI] [PubMed] [Google Scholar]
- 11.Randolph GJ, Inaba K, Robbiani DF, Steinman RM, Muller WA. Differentiation of phagocytic monocytes into lymph node dendritic cells in vivo. Immunity. 1999;11(6):753–761. doi: 10.1016/S1074-7613(00)80149-1. [DOI] [PubMed] [Google Scholar]
- 12.Randolph GJ, Jakubzick C, Qu C. Antigen presentation by monocytes and monocyte-derived cells. Curr Opin Immunol. 2008;20(1):52–60. doi: 10.1016/j.coi.2007.10.010. [DOI] [PMC free article] [PubMed] [Google Scholar]
- 13.Leon B, Lopez-Bravo M, Ardavin C. Monocyte-derived dendritic cells. Semin Immunol. 2005;17(4):313–318. doi: 10.1016/j.smim.2005.05.013. [DOI] [PubMed] [Google Scholar]
- 14.Partida-Sanchez S, Goodrich S, Kusser K, Oppenheimer N, Randall TD, Lund FE. Regulation of dendritic cell trafficking by the ADP-ribosyl cyclase CD38: impact on the development of humoral immunity. Immunity. 2004;20(3):279–291. doi: 10.1016/S1074-7613(04)00048-2. [DOI] [PubMed] [Google Scholar]
- 15.Sallusto F, Lanzavecchia A. Mobilizing dendritic cells for tolerance, priming, and chronic inflammation. J Exp Med. 1999;189(4):611–614. doi: 10.1084/jem.189.4.611. [DOI] [PMC free article] [PubMed] [Google Scholar]
- 16.Sallusto F, Palermo B, Lenig D, Miettinen M, Matikainen S, Julkunen I, Forster R, Burgstahler R, Lipp M, Lanzavecchia A. Distinct patterns and kinetics of chemokine production regulate dendritic cell function. Eur J Immunol. 1999;29(5):1617–1625. doi: 10.1002/(SICI)1521-4141(199905)29:05<1617::AID-IMMU1617>3.0.CO;2-3. [DOI] [PubMed] [Google Scholar]
- 17.Verbovetski I, Bychkov H, Trahtemberg U, Shapira I, Hareuveni M, Ben-Tal O, Kutikov I, Gill O, Mevorach D. Opsonization of apoptotic cells by autologous iC3b facilitates clearance by immature dendritic cells, down-regulates DR and CD86, and up-regulates CC chemokine receptor 7. J Exp Med. 2002;196(12):1553–1561. doi: 10.1084/jem.20020263. [DOI] [PMC free article] [PubMed] [Google Scholar]
- 18.Forster R, Schubel A, Breitfeld D, Kremmer E, Renner-Muller I, Wolf E, Lipp M. CCR7 coordinates the primary immune response by establishing functional microenvironments in secondary lymphoid organs. Cell. 1999;99(1):23–33. doi: 10.1016/S0092-8674(00)80059-8. [DOI] [PubMed] [Google Scholar]
- 19.Randolph GJ, Sanchez-Schmitz G, Angeli V. Factors and signals that govern the migration of dendritic cells via lymphatics: recent advances. Springer Semin Immunopathol. 2005;26(3):273–287. doi: 10.1007/s00281-004-0168-0. [DOI] [PubMed] [Google Scholar]
- 20.Yanagihara S, Komura E, Nagafune J, Watarai H, Yamaguchi Y. EBI1/CCR7 is a new member of dendritic cell chemokine receptor that is up-regulated upon maturation. J Immunol. 1998;161(6):3096–3102. [PubMed] [Google Scholar]
- 21.Banchereau J, Steinman RM. Dendritic cells and the control of immunity. Nature. 1998;392(6673):245–252. doi: 10.1038/32588. [DOI] [PubMed] [Google Scholar]
- 22.Leon B, Ardavin C. Monocyte-derived dendritic cells in innate and adaptive immunity. Immunol Cell Biol. 2008;86(4):320–324. doi: 10.1038/icb.2008.14. [DOI] [PubMed] [Google Scholar]
- 23.Leon B, Ardavin C. Monocyte migration to inflamed skin and lymph nodes is differentially controlled by L-selectin and PSGL-1. Blood. 2008;111(6):3126–3130. doi: 10.1182/blood-2007-07-100610. [DOI] [PubMed] [Google Scholar]
- 24.Enk AH, Jonuleit H, Saloga J, Knop J. Dendritic cells as mediators of tumor-induced tolerance in metastatic melanoma. Int J Cancer. 1997;73(3):309–316. doi: 10.1002/(SICI)1097-0215(19971104)73:3<309::AID-IJC1>3.0.CO;2-3. [DOI] [PubMed] [Google Scholar]
- 25.Lutz MB, Schuler G. Immature, semi-mature and fully mature dendritic cells: which signals induce tolerance or immunity? Trends Immunol. 2002;23(9):445–449. doi: 10.1016/S1471-4906(02)02281-0. [DOI] [PubMed] [Google Scholar]
- 26.Banchereau J, Schuler-Thurner B, Palucka AK, Schuler G. Dendritic cells as vectors for therapy. Cell. 2001;106(3):271–274. doi: 10.1016/S0092-8674(01)00448-2. [DOI] [PubMed] [Google Scholar]
- 27.Nestle FO, Banchereau J, Hart D. Dendritic cells: on the move from bench to bedside. Nat Med. 2001;7(7):761–765. doi: 10.1038/89863. [DOI] [PubMed] [Google Scholar]
- 28.Schuler G, Schuler-Thurner B, Steinman RM. The use of dendritic cells in cancer immunotherapy. Curr Opin Immunol. 2003;15(2):138–147. doi: 10.1016/S0952-7915(03)00015-3. [DOI] [PubMed] [Google Scholar]
- 29.Whiteside TL. Anti-tumor vaccines in head and neck cancer: targeting immune responses to the tumor. Curr Cancer Drug Targets. 2007;7(7):633–642. doi: 10.2174/156800907782418310. [DOI] [PubMed] [Google Scholar]
- 30.Young MR. Trials and tribulations of immunotherapy as a treatment option for patients with squamous cell carcinoma of the head and neck. Cancer Immunol Immunother. 2004;53(5):375–382. doi: 10.1007/s00262-003-0456-x. [DOI] [PMC free article] [PubMed] [Google Scholar]
- 31.Ziegler-Heitbrock L. The CD14+ CD16+ blood monocytes: their role in infection and inflammation. J Leukoc Biol. 2007;81(3):584–592. doi: 10.1189/jlb.0806510. [DOI] [PubMed] [Google Scholar]
- 32.Grage-Griebenow E, Zawatzky R, Kahlert H, Brade L, Flad H, Ernst M. Identification of a novel dendritic cell-like subset of CD64(+) / CD16(+) blood monocytes. Eur J Immunol. 2001;31(1):48–56. doi: 10.1002/1521-4141(200101)31:1<48::AID-IMMU48>3.0.CO;2-5. [DOI] [PubMed] [Google Scholar]
- 33.Randolph GJ, Sanchez-Schmitz G, Liebman RM, Schakel K. The CD16(+) (FcgammaRIII(+)) subset of human monocytes preferentially becomes migratory dendritic cells in a model tissue setting. J Exp Med. 2002;196(4):517–527. doi: 10.1084/jem.20011608. [DOI] [PMC free article] [PubMed] [Google Scholar]
- 34.Andreu P, Johansson M, Affara NI, Pucci F, Tan T, Junankar S, Korets L, Lam J, Tawfik D, DeNardo DG, Naldini L, de Visser KE, De Palma M, Coussens LM. FcRgamma activation regulates inflammation-associated squamous carcinogenesis. Cancer Cell. 2010;17(2):121–134. doi: 10.1016/j.ccr.2009.12.019. [DOI] [PMC free article] [PubMed] [Google Scholar]
- 35.Tan TT, Coussens LM. Humoral immunity, inflammation and cancer. Curr Opin Immunol. 2007;19(2):209–216. doi: 10.1016/j.coi.2007.01.001. [DOI] [PubMed] [Google Scholar]
- 36.Ziober AF, Falls EM, Ziober BL. The extracellular matrix in oral squamous cell carcinoma: friend or foe? Head Neck. 2006;28(8):740–749. doi: 10.1002/hed.20382. [DOI] [PubMed] [Google Scholar]
- 37.Saleh MN, Goldman SJ, LoBuglio AF, Beall AC, Sabio H, McCord MC, Minasian L, Alpaugh RK, Weiner LM, Munn DH. CD16+ monocytes in patients with cancer: spontaneous elevation and pharmacologic induction by recombinant human macrophage colony-stimulating factor. Blood. 1995;85(10):2910–2917. [PubMed] [Google Scholar]
- 38.Ambe K, Mori M, Enjoji M. S-100 protein-positive dendritic cells in colorectal adenocarcinomas. Distribution and relation to the clinical prognosis. Cancer. 1989;63(3):496–503. doi: 10.1002/1097-0142(19890201)63:3<496::AID-CNCR2820630318>3.0.CO;2-K. [DOI] [PubMed] [Google Scholar]
- 39.Matsuda H, Mori M, Tsujitani S, Ohno S, Kuwano H, Sugimachi K. Immunohistochemical evaluation of squamous cell carcinoma antigen and S-100 protein-positive cells in human malignant esophageal tissues. Cancer. 1990;65(10):2261–2265. doi: 10.1002/1097-0142(19900515)65:10<2261::AID-CNCR2820651017>3.0.CO;2-8. [DOI] [PubMed] [Google Scholar]
- 40.Chung CH, Gillison ML. Human papillomavirus in head and neck cancer: its role in pathogenesis and clinical implications. Clin Cancer Res. 2009;15(22):6758–6762. doi: 10.1158/1078-0432.CCR-09-0784. [DOI] [PubMed] [Google Scholar]
- 41.Gillison ML. HPV and prognosis for patients with oropharynx cancer. Eur J Cancer. 2009;45(Suppl 1):383–385. doi: 10.1016/S0959-8049(09)70058-9. [DOI] [PubMed] [Google Scholar]
- 42.Gabrilovich D. Mechanisms and functional significance of tumour-induced dendritic-cell defects. Nat Rev Immunol. 2004;4(12):941–952. doi: 10.1038/nri1498. [DOI] [PubMed] [Google Scholar]
- 43.Perrot I, Blanchard D, Freymond N, Isaac S, Guibert B, Pacheco Y, Lebecque S. Dendritic cells infiltrating human non-small cell lung cancer are blocked at immature stage. J Immunol. 2007;178(5):2763–2769. doi: 10.4049/jimmunol.178.5.2763. [DOI] [PubMed] [Google Scholar]
- 44.Ohl L, Mohaupt M, Czeloth N, Hintzen G, Kiafard Z, Zwirner J, Blankenstein T, Henning G, Forster R. CCR7 governs skin dendritic cell migration under inflammatory and steady-state conditions. Immunity. 2004;21(2):279–288. doi: 10.1016/j.immuni.2004.06.014. [DOI] [PubMed] [Google Scholar]
- 45.Hooper SJ, Wilson MJ, Crean SJ. Exploring the link between microorganisms and oral cancer: a systematic review of the literature. Head Neck. 2009;31(9):1228–1239. doi: 10.1002/hed.21140. [DOI] [PubMed] [Google Scholar]
- 46.Seidler S, Zimmermann HW, Bartneck M, Trautwein C, Tacke F. Age-dependent alterations of monocyte subsets and monocyte-related chemokine pathways in healthy adults. BMC Immunol. 2010;11:30. doi: 10.1186/1471-2172-11-30. [DOI] [PMC free article] [PubMed] [Google Scholar]
- 47.Lanier L. NK cell recognition. Annu Rev Immunol. 2005;23:225–274. doi: 10.1146/annurev.immunol.23.021704.115526. [DOI] [PubMed] [Google Scholar]
- 48.Young N, Waller ECP, Patel R, Roghanian A, Austyn JM, Trowsdale J. The inhibitory receptor LILRB1 modulates the differentiation and regulatory potential of human dendritic cells. Blood. 2008;111:3090–3096. doi: 10.1182/blood-2007-05-089771. [DOI] [PubMed] [Google Scholar]
- 49.Miyazaki T, Kato H, Nakajima M, Sohda M, Fukai Y, Masuda N, Manda R, Fukuchi M, Tsukada K, Kuwano H. FAK overexpression is correlated with tumour invasiveness and lymph node metastasis in oesophageal squamous cell carcinoma. Br J Cancer. 2003;89(1):140–145. doi: 10.1038/sj.bjc.6601050. [DOI] [PMC free article] [PubMed] [Google Scholar]
Associated Data
This section collects any data citations, data availability statements, or supplementary materials included in this article.
Supplementary Materials
Primary keratinocytes affect the expression of CD16, CD1a and CD86 on DC-SIGN-high and on DC-SIGN-low subsets of Donor 1 monocyte-derived DC.1 (DOC 31 kb)
DC affect the numbers of floating live HNSCC cells. HNSCC cells were plated alone or combined at 1:1 ratios with DC-SIGN-low or DC-SIGN-high DC and cultured for 3 days. Floating cell populations were stained with anti-CD11c–PECy5, Annexin V-FITC and propidium Iodide (PI) and analyzed by flow cytometry. Dot plots (AnnV-FITC vs PI and CD11c-PECy5 vs PI) from Donor 1 DC subsets with Cal27 (a) and with 1483 (b) are shown. Only the dead/dying SCC cells non-specifically stained with the DC-specific anti-CD11c antibody. (JPEG 63 kb)
Lack of DC effects on the numbers of viable floating keratinocytes. Primary keratinocytes HTE1163 were cultured for 3 days alone or in combination with DC-SIGN-low or DC-SIGN-high subsets from Donor 1 at 1:1 ratios. Floating populations were collected and stained with anti-CD11c–PE-Cy5, Annexin V-FITC and propidium Iodide (PI) and analyzed by flow cytometry. (JPEG 37 kb)
Lack of monocyte effects on the numbers of viable floating SCC cells. SCC cells were cultured for 3 days alone or in combination with Donor 1 or Donor 3 monocytes (Mo) at 1:1 ratios. Floating populations stained with anti-CD11c–PECy5, Annexin V-FITC and PI were analyzed by flow cytometry. Panels show dot plots for Donor 1 (a) and Donor 3 (b). (JPEG 46 kb)
Donor 1 DC migration and expression of CCR7 and CD38 after co-culture with primary keratinocytes HTE1163. DC subsets derived from Donor 1 monocytes were cultured alone or with keratinocytes for 3 days, and the floating cells were stained and analyzed by flow cytometry or used in migration assays. (a) CCR7 and CD38 expression on gated CD11c+ cells (DC). MFI of antibody binding is shown in the upper right corner of each panel, top number is MFI of DC cultured alone and the lower bold number is the MFI on DC from the co-cultures with keratinocytes. The data are representative of two independent experiments. (b) Migration assays were performed as described in Methods. Error bars = standard error for DC alone; and standard deviation for DC-Cal27 co-cultures. The data are representative of two independent experiments. (JPEG 31 kb)