

Abstract
In recent years, new recording technologies have advanced such that, at high temporal and spatial resolutions, high-frequency oscillations (HFO) can be recorded in human partial epilepsy. However, because of the deluge of multichannel data generated by these experiments, achieving the full potential of parallel neuronal recordings depends on the development of new data mining techniques to extract meaningful information relating to time, frequency and space. Here, we aim to bridge this gap by focusing on up-to-date recording techniques for measurement of HFO and new analysis tools for their quantitative assessment. In particular, we emphasize how these methods can be applied, what property might be inferred from neuronal signals, and potentially productive future directions.
Keywords: Human partial epilepsy, Microelectrodes, Intracranial electrodes, Wide bandwidth acquisition, Quantitative analysis
1. Introduction
Collective neuronal oscillations of functional networks in human brain occur over a wide range of spatial and temporal scales. Neocortical networks that perform critical physiological functions are organized across spatial scales from sub-millimeter cortical columns to centimeter scale lobar structures. Extracellular microwire electrodes (~10 to 50 μm) are widely used to record the neural activity spanning single neuron action potentials to collective oscillations of large neuronal assemblies (Buzsaki, 2004). On millisecond time scales the extracellular currents associated with single neuron action potentials are detected within a radius of ~150 μm surrounding a micro-electrode (Buzsaki, 2004). On slower time scales (<600 Hz) the linear superposition of potentials associated with extracellular current fluctuations generate a more spatially extended local field potential (LFP). The frequency of these LFP oscillations (~DC −600 Hz) extends far beyond the traditional electroencephalogram (EEG) (Neidermeyer and Lopes da Silva, 2011; Vanhatalo et al., 2005). Mechanisms generating the extracellular currents responsible for the LFP are varied, but primarily reflect synaptic activity (Buzsaki et al., 2003), and it is difficult to directly associate LFP characteristics (e.g. frequency, amplitude, spectrum, waveform morphology, etc.) with mechanisms, physiology, or pathology. The spatial extent of the LFP is determined by the extracellular matrix and complex geometry of extracellular current flow (Mitzdorf, 1985). The LFP can be highly localized, reflecting neuronal activity within approximately 250 μm of the recording electrode (Katzner et al., 2009) to more spatially extended (1–10 mm) activity (Kajikawa and Schroeder, 2011).
Clinical macro-electrodes placed within or on the surface of the brain record a spatial average of locally generated LFP and volume conducted activity (Kajikawa and Schroeder, 2011; Whitmer et al., 2010). Because of their relatively large surface area macro-electrodes, typically ~1 to 10 mm2, do not record single neuron action potentials or multi-unit activity. Similar to micro-electrodes, LFP oscillations detected with clinical macro-electrodes span a wide range of frequencies (~DC −600 Hz). These clinical recordings are variably referred to as electroencephalography (EEG), intracranial electroencephalogram (iEEG), or electrocorticography (ECoG). In this review we use the term LFP to describe the wide bandwidth electrical activity and oscillations (<600 Hz) recorded directly from brain using either intracranial micro- or macroelectrodes. In keeping with current clinical terminology, we also use iEEG to describe recordings obtained with intracranial electrodes. For decades researchers largely focused on activity in the Berger bands (1–25 Hz) (Gloor, 1969, 1975). More recent studies, however, implicate gamma frequency oscillations (gamma: 25–80 Hz) and synchrony as a fundamental mechanism of percept binding and playing a critical role in brain function (Singer, 1999; von der Malsburg, 1999) and disease (Uhlhaas and Singer, 2006). Beyond the gamma frequency range, hippocampal ripple frequency oscillations (ripple: 80–200 Hz) are believed play an important role in memory function (Buzsaki et al., 1992; Buzsaki and Draguhn, 2004; Lisman and Idiart, 1995), and somatosensory neocortex ultra-fast oscillations (>400 Hz) in sensory coding (Baker et al., 2003; Telenczuk et al., 2011).
In addition to physiological LFP it was recognized early on that human epileptic brain generates pathological interictal transients, i.e. epileptiform spikes and sharp waves, that are clearly distinct from seizures and occur without clinical symptoms (Gibbs et al., 1936; Swartz and Goldensohn, 1998; Gloor, 1969). In addition to interictal epileptiform spikes and sharp waves, wide bandwidth recordings from humans and animals with epilepsy have revealed high frequency oscillations (HFO) as a possible electrophysiologi-cal signature of epileptic brain. The initial studies of recordings from human hippocampus supported the hypothesis that HFO above 250 Hz, named fast ripple (FR) oscillations (Bragin et al., 1999a,b), were a unique pathological oscillation associated with epileptic brain. However, recent studies reporting physiological somatosensory evoked HFO in nonhuman primates, likely reflecting multiunit cortical neuronal responses (Telenczuk et al., 2011), makes the specific association of activity in the FR with pathology problematic. In addition, multiple studies have now shown that HFO in the range of physiological gamma and ripple oscillations are also increased in human epileptogenic hippocampus (Worrell et al., 2008; Crépon et al., 2010; Jacobs et al., 2010), and neocortex (Worrell et al., 2004; Jacobs et al., 2010; Blanco et al., 2011; Schevon et al., 2009).
Interictal spikes and sharp waves recorded from scalp EEG are a highly specific marker of epilepsy. For example, only 69 (0.5%) of 13,658 healthy candidates for aircrew training without a history of seizures had interictal spikes or sharp waves on a routine scalp EEG (Gregory et al., 1993). Epileptiform spikes and sharp waves are identified in scalp EEG recordings as transient waveforms produced by an abrupt change in voltage polarity occurring over a duration of less than 70 ms or 70–200 ms, respectively. While this definition is simple it is well recognized by electroencephalographers that visual detection of these is events is highly subjective. Furthermore, unlike scalp EEG were recordings from normal controls provide clear information about the specificity of interictal events, iEEG recordings are essentially limited to patients with partial epilepsy. Thus, the specificity of intracranial recorded spikes, sharp waves, and HFO as biomarkers of epileptogenic brain remains challenging.
Whether HFO recorded in epileptic brain are generated by unique pathological mechanisms, or represent aberrations of normal physiological oscillations is not clear (Le Van Quyen et al., 2006). There are currently no established criteria for distinguishing physiological from pathological HFO (Engel et al., 2009; Le Van Quyen et al., 2006). These important questions are currently active areas of research. Here we review state-of-art for electrodes, acquisition, analysis, and data mining of HFO in human partial epilepsy.
2. Spatial and temporal scale of HFO
To adequately sample the temporal dynamics of HFO a reasonable approach is digital sampling at 5 times the oscillation frequency of interest (Neidermeyer and Lopes da Silva, 2011). The spatial resolution that best characterizes HFO, however, is a much more challenging question. Initially, ripple and FR oscillations were reported in intracranial recordings utilizing microwires (Bragin et al., 1999a,b, 2002a,b). Contrary to gamma oscillations, ripple and FR HFO were not until recently reported using non-invasive EEG and MEG methods. This was consistent with the wealth of data from intracranial studies using microelectrodes that showed HFO are transient (ripple: 19–360 ms and FR: 25–214 ms) LFP oscillations (ripple: 120–1050 μV and FR: 566–1250 μV) (Bragin et al., 2002a,b), and FR oscillations were localized to small tissue volumes (<1 mm). Because these initial reports came from microwires it was not clear that interictal HFO were even detectable on the spatial scale of clinical intracranial macroelectrodes (surface area: 1–10 mm2). Subsequently, multiple groups have demonstrated interictal ripple and FR can be detected using clinical macroelectrodes (>1 mm2) (Urrestarazu et al., 2007; Worrell et al., 2008; Crépon et al., 2010).
However, the question of the clinically optimal spatial scale remains unanswered. Early investigations using single neuron recordings in humans were focused on the “epileptic neuron” hypothesis, proposing that specific pathological neurons served as pacemakers that recruited surrounding non-pathological neurons into seizures (Wyler et al., 1982). This line of investigation was largely unsuccessful in defining the dynamics of seizure generation, and the concept of an epileptic network involving distributed assemblies of neurons is the focus of current investigations (Bragin et al., 2000; Stead et al., 2010). The cortical column has been proposed as a possible anatomic substrate for the initiation of epileptic activity (Goldensohn, 1975; Gabor et al., 1979; Reichenthal and Hocherman, 1977, 1979), but currently there is no direct experimental evidence (Chesi and Stone, 1998; Schwartz, 2003; Schwindt et al., 1997). While the role of sub-millimeter scale neuronal assemblies in the generation of seizures is not known, the fact that FR oscillations (250–1000 Hz) are often localized to sub-millimeter volumes (<1 mm3) in human hippocampus (Bragin et al., 1999a,b, 2002a,b; Worrell et al., 2008; Staba et al., 2002a,b) and recent observations of microdomain electrographic seizures (Stead et al., 2010) and periodic complexes (Schevon et al., 2008) supports the hypothesis that the pathological organization of epileptic brain extends to sub-millimeter scales.
A related question is whether there is a minimum volume of tissue (or number of neurons) required for an epileptiform discharge. There is experimental evidence supporting the concept of a “critical volume” from both in vitro slice and in vivo animal studies, i.e. below a critical volume a sustained epileptiform discharge does not occur. Using restricted perfusion of penicillin and subpial transcortical cuts to interrupt the lateral connectivity Reichenthal and Hocherman (1977, 1979) demonstrated a minimum area of ~0.5 mm2 (radius of ~400 μm) in rat and 0.7 mm2 (470 μm) in cat cortex was required for sustained epileptic discharge. Similar results have been found using other chemo-convulsants and transcortical cuts (Bashir and Holmes, 1993; Holmes, 1994; Schwindt et al., 1997). These studies suggest that the “critical volume” is independent of the experimental model (~ 200 to 470 μm radius), and is an intrinsic property of cortical tissue. The in vitro slice data from rodent neocortex (Chesi and Stone, 1998) and hippocampus (Miles et al., 1984) report the minimal volume of cortex and neurons needed to sustain epileptiform activity is considerably smaller than that reported from in vivo studies. Using small wedges of hippocampal slice from rat, Miles et al. (1984) reported that, in the CA3 field, synchronized after-discharges in the presence of picrotoxin do not occur in microslices containing less than ~1000 pyramidal cells. Similarly, Chesi and Stone (1998) reported that cortical sections of supragranular or infragranular layers of mouse cortex required ~2000 neurons to sustain epileptiform bursting.
The optimal spatial scale for localization of human epileptic brain and epilepsy surgery remains an open question. Recording on the scale of single neurons and cortical columns makes possible the direct investigation of the cellular components and their interactions during epileptiform LFP oscillations and spikes, and may ultimately prove useful for clinical practice. This approach makes possible investigations into the modulation of neuronal firing during physiological and pathological LFP activity and provides a window into the complex cortical dynamics across multiple spatial and temporal scales. More recently, and discussed below, there reports of HFO recorded from scalp electrodes have appeared (Andrade-Valenca et al., 2011). This is an unexpected, and surprising result given that previous work utilizing concurrent iEEG and scalp EEG report that approximately 7 cm2 was required to generate a LFP spike detectable on the scalp (Tao et al., 2005; Fig. 1).
Fig. 1.
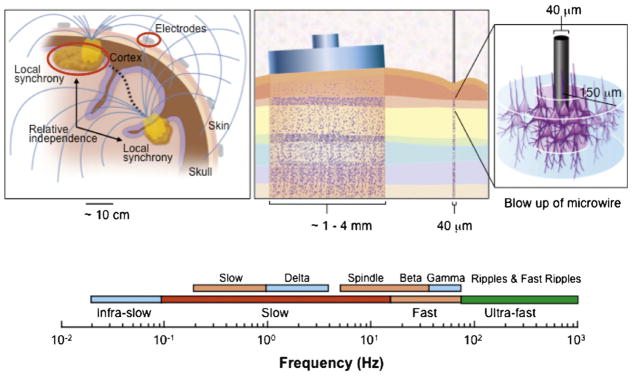
The spatial and temporal scales of human brain electrophysiology. Left: Figure indicating the ~7 cm2 patch of synchronous cortical activity required to generate a scalp detected EEG oscillation. Synchrony between distant regions of the brain are thought to support binding neuronal activity. Middle: The relative scale recorded from clinical macroelectrodes and subpial microwires. Right: Blow-up of penetrating microelectrode sampling activity from neurons within a radius of ~150 μm. Bottom: The wide range of spectral activity recorded from human brain from infra-slow oscillations to ultra-fast.
2.1. Human intracranial electrodes
Electrode cross sectional area determines the scale of spatial sampling. Multiple research groups are now actively exploring electrode sizes, spatial density, and configurations in human and animal studies. iEEG is associated with risk to patients (Hamer et al., 2002; Luders and Comair, 2001; Van Gompel et al., 2008a,b). Therefore, iEEG is only obtained in clinical situations were direct recording from the brain is required, as is commonly required for epilepsy surgery. The level of invasiveness of experimental intracranial electrodes varies considerably. Studies investigating HFO in human epileptic brain have primarily utilized standard clinical subdural or depth macroelectrodes (Fisher et al., 1992; Jacobs et al., 2008; Jirsch et al., 2006; Traub et al., 2001; Urrestarazu et al., 2006; Worrell et al., 2004; Crépon et al., 2010), or hybrid electrode systems (Bragin et al., 2002a,b; Worrell et al., 2008; Blanco et al., 2011) that combine clinical macroelectrodes with additional experimental microelectrodes (Fig. 2) (Van Gompel et al., 2008a,b). The data support that hybrid electrodes do not increase the risk of hemorrhage, infection or other complications (Van Gompel et al., 2008a,b). Hybrid subdural electrodes are modifications of standard clinical subdural electrodes with additional microwire arrays incorporated into the silastic substrate of the grid (Fig. 2). All the electrodes are subdural, epipial contacts. Clinical depth electrodes with microwires exiting the tip have been used extensively by the UCLA group with excellent safety (Fig. 3). Using a similar depth electrode design with additional microwires embedded in the electrode shaft have been studied and show excellent safety (Van Gompel et al., 2008a,b).
Fig. 2.
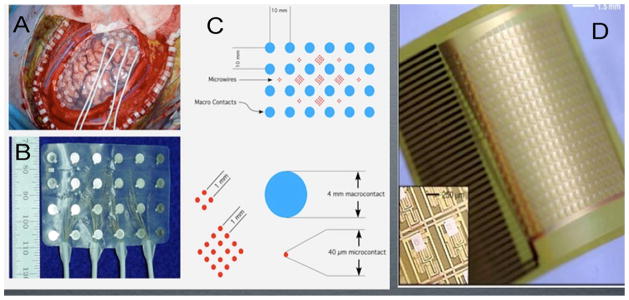
Types of subdural, non-penetrating, electrode arrays. (A) Implant of hybrid subdural electrode in human frontal lobe in patient with drug resistant epilepsy. (B) Hybrid subdural grid composed of 24 clinical macroelectrodes (silver contacts). (C) Schematic of electrode shown in (B) with macroelectrodes (blue) and intercalated microelectrode arrays (red). (D) Flexible thin film electrodes with integrated electronics and 10um electrode spacing.
Source: Adapted from Van Gompel et al. (2008a,b), Viventi et al. (2010).
Fig. 3.

Penetrating electrodes used in human electrophysiology. (A) Schematic of penetrating hybrid depth electrode with 8 clinical macroelectrodes (blue) and microelectrodes (red) exiting the tip and embedded into the shaft between the macroelectrodes. (B) Blow-up of depth-electrode tip showing 40 μm diameter wires exiting the tip. C) MRI showing implanted depth electrode into mesial temporal structures. (D) Utah array composed of 100 microelectrodes (adapted from Donoghue, 2002) that penetrate cortex. (E) Thumbtack microelectrode array that penetrates cortex. The microelectrodes are arrayed along the shaft.
Source: Adapted from Ulbert et al. (2004a,b).
More invasive electrode systems that are independent of the clinical electrodes and penetrate brain tissue have also been used to probe the spatial fine scale of human epileptic brain (Ulbert et al., 2004a,b; Schevon et al., 2008, 2009; Truccolo et al., 2011; Keller et al., 2010). These electrode systems have the advantage of recording single neuron extracellular action potentials in the layers of neocortex, but are more invasive and require penetration of cortex.
2.2. Acquisition and storage
Wide-bandwidth electrophysiology from a large number of microwires required to record neuronal ensembles and sub-millimeter regions of brain has, until very recently, largely been the domain of animal research (Buzsaki and Draguhn, 2004). Recently these advances have been applied to human iEEG, and the approach has shown potential for clinical utility (Bragin et al., 1999a,b; Brinkmann et al., 2009; Engel et al., 2009). Because of the technical challenges associated with wide bandwidth recordings from high impedance microelectrodes, progress determining the optimal spatial and temporal recording resolution for epileptic brain localization and seizure generation has been slow. Nonetheless, significant progress has been made by a number of groups that have demonstrated the feasibility and potential clinical importance. Fortunately, the technical challenges of data transfer, storage, and analysis of large Terabyte data sets is now possible (Le Van Quyen and Bragin, 2007; Brinkmann et al., 2009). Nonetheless, accurately identifying epileptiform spikes and HFO transients in continuous multi-day iEEG recordings continues to present a challenge (Fig. 4).
Fig. 4.

EEG acquisition system streams data from the patient s ICU room to the Acquisition Node via dedicated dual-gigabit ethernet lines. Data are recorded to a 160TB storage area network (SAN) and accessed from workstations and computational nodes via 4Gb fiber channel links.
Source: From Brinkmann et al. (2009).
3. Automatic detection techniques
Automatic detection is crucial for investigation of HFO as biomarkers of epileptogenic tissue, and is likely necessary to propel future clinical applications. The detection and labeling of interictal and ictal epileptiform activity in LFP or iEEG records can be broadly categorized into: (i) Expert manual review – considered the gold standard, but associated with poor inter-reviewer reliability (Abend et al., 2011; Benbadi et al., 2009) and not feasible for large data sets. (ii) Supervised detection – usually implemented using a high sensitivity automated detection algorithm that may have poor specificity, but is combined with expert review. (iii) Unsupervised detection – achieves fully automated detection and data labeling, but requires high specificity and sensitivity detectors to be useful.
3.1. Definition and detection
The criteria selected by different investigators for automated detection are varied, and depending on electrode type (macro-electrode, microelectrodes, penetrating, and epipial), proximity to the HFO generators and the tissue sampled, the range of HFO amplitude (10–1000 μV) and duration (30–100 ms) reported spans a wide range. Algorithms for detection of spontaneous HFO commonly require at least four oscillations that stand out from the ongoing background activity, and at least 25 ms inter-event interval. Visual marking and 1st generation detectors combined with expert review have provided a good understanding of the relation between HFO and epilepsy (see Jacobs et al., 2012, in this special issue), but is very time consuming and subjective. Objective, consistent, accurate labelling of epileptiform activity in large-scale recordings requires automated detectors. The automated mining and analysis of large-scale data sets and HFO detectors is an area of active research (Gardner et al., 2007a,b; Worrell et al., 2008; Blanco et al., 2010, 2011; Crépon et al., 2010; Zelmann et al., 2010, 2011).
The objective is the detection of spontaneous HFO events that can be distinguished from ongoing background activity. Thus, a logical approach is to compare the energy of the signal with an energy threshold. The first step is band-pass filtering the data, to restrict the range of frequencies under consideration. When the energy of the filtered LFP is statistically larger than the threshold during a certain interval, the segment is considered as a possible HFO (Fig. 5A) (Staba et al., 2002a,b; Gardner et al., 2007a,b; Crépon et al., 2010; Zelmann et al., 2011). Under the assumption that HFO are rare events, some detectors (Staba et al., 2002a,b; Gardner et al., 2007a,b; Crépon et al., 2010) compute the energy threshold based on the entire signal, including the events. This assumption seems correct in the majority of the channels, but in very active channels it can fail. In those cases, performance can be improved by first detecting baseline sections (segments without oscillatory components) and computing the energy threshold based on the energy in the detected baseline (Zelmann et al., 2010).
Fig. 5.

Automatic detection of HFOs. Top: General diagram of an automatic detector of HFOs. The EEG is first band-passed filtered; then, an energy threshold is computed; segments of EEG statistically larger than threshold for a minimum duration are considered possible HFOs. These events can then be subjected to further validation or classification. Bottom: Examples of automatic detections. All detectors were implemented using the same filter (not the one in their originally publications) to improve performance and to allow for fair comparison. Black markings correspond to the reference HFOs (events identified jointly by 2 experienced reviewers). Even though the general diagram of part A is valid for all the detectors, different implicit assumptions produced different type of detections.
Source: Modified from Zelmann et al. (2011).
A question that often arises is whether HFO should be a band-limited event (as in Crépon et al., 2010) or it can be a broadband event (e.g. Staba et al., 2002a,b; Worrell et al., 2008; Zelmann et al., 2010). If band-limited, should there be specific spectral boundaries? In other words, should an HFO be defined as an isolated event in the time–frequency map, or could it contain a variety of frequencies within a range? Separate, but related question is whether only those HFOs that occur alone versus those occurring in association with epileptiform spikes are relevant. There is no clear answer to these questions.
Since the analysis is focused in a particular frequency band, the filter characteristics must be taken into account to avoid the detection of false oscillations (Bénar et al., 2010), i.e. sharp transients with spectral content in HFO bands but without actual HFO in the raw LFP. The phenomena is well known, first reported over a century ago by Gibbs’ (Gibbs, 1899) and referred to as “Gibbs’ phenomena”. Such false oscillations are not artefacts (defined as activity originated outside the brain, see Section 4), since the sharp spikes are generated in the brain. They rather originate from the Fourier transform of a transient that always exhibits a wide range of frequencies. The transient being the result of the additive superposition of all those harmonics, a narrow band filter will generate spurious oscillations in the vicinity of the transient. The distinction between true LFP oscillations and spurious oscillations created by filtering, i.e. Gibbs’ phenomena, can be challenging but in principle is possible. For example, oscillations resulting from filtering will have a low correlation with the raw signal in the frequency band of interest. Conversely, if there is a true LFP oscillation present in the signal the correlation should be high. Lastly, the process can also be validated by random selection of events to visually verify the presence of discrete HFO in the unfiltered LFP.
Existing methods for automated HFO detection implicitly model the events as short-duration, high frequency transients added to background activities (Staba et al., 2002a,b), but there are different implicit specific goals on what to detect as an HFO. Indeed, the definition of HFO is dissimilar across different groups. As a result, published detectors were optimized using diverse filter settings, HFO duration, and statistical relation to background. When comparing results from different centres, it is important to take into account not only the difference in the optimization of the detectors, but also the electrode size, the number and distribution of the contacts, the sampling rate and filters, and the quality of the data. This situation is not unique to HFOs but applies to any study based on LFP. Until a unique general definition is established for HFO, it is important not to use a detector “out of the box” because what is valid in one center would probably not be valid for another place. The detector of choice should be trained and validated for a dataset with similar characteristics to the dataset of interest in order to obtain good performance (Zelmann et al., 2011). Fig. 5 B and C exemplifies the detections made under different implicit assumptions when testing different detectors on the same dataset. As a running definition, we suggest the following: at least four oscillations of sinusoidal like morphology in the filtered signal (above 80 Hz) with energy larger than the 95 percentile of the surrounding background. In addition, constrains in the time–frequency plane has been empirically proposed by some authors (see Section 5).
3.2. Validation of the detections
The validation of automatic detectors of sporadic unpredictable events is not trivial. The difficulties that are present in the detection of HFO are the same challenges present in the robust detection of spikes and seizures. In order to validate the detections a “gold standard” is needed. To avoid false negatives, the most common approach is to implement the detectors with high sensitivity but low specificity. In this way, most of the events should be detected, at the cost of producing a large number of false positives that then need to be discarded. As for spikes and seizures, a way of only keeping the “true” HFOs is considering human expert’s detections as the gold standard. But variability among reviewers has to be considered. In this regard, a possibility is to consider more than one reviewer (as in Gardner et al., 2007a,b; Zelmann et al., 2010), although agreement between reviewers can be poor (Gardner et al., 2007a,b). Even though human reviewers are not the perfect solution, it is a reasonable approach given that they are the clinical users and that they are considered as the gold standard when identifying other electrophysiological signals, such as spikes, seizures, or the alpha rhythm. To obtain a reliable gold standard, it is important to control for inter-reviewer reliability and for consistency in the markings (Zelmann et al., 2009). This results in a supervised training algorithm for optimizing the parameters of the detector, followed by validation of all the detected events by expert reviewers. When considering human reviewers as the gold standard, it is also important to consider that reviewers trained in different centres will probably consider a dissimilar definition of HFOs, while reviewer from the same centre will have bias towards certain types of events. However, it is important to also acknowledge that this situation is not unique to HFOs but applies to any study based on LFP or EEG.
Another possibility is to consider the output of the detector directly as the “true” HFO. This approach is followed by Staba et al. (2002) by adding a restriction on the number of oscillations above certain energy level. This method can be extended to include a cascade of classifiers to sieve the data to candidate events (Viola and Jones, 2001). In Blanco et al. (2010), an unsupervised approach is implemented by means of clustering. Unsupervised detection can achieve fully automated detection and labelling of massive data streams, but requires high specificity and sensitivity detectors to be useful. An interesting approach would be a combination of supervised and unsupervised methods. After detecting possible events with a high sensitivity low specificity detectors, clustering could be implemented to remove artefacts, and the remaining events validated by an expert reviewer. In addition, an adaptive approach could allow learning from preceding detections, to gradually reduce the need of expert validation. In this way, excellent performance while significantly reducing data volume can be achieved. In any case, the ultimate validation will be given by the usefulness of the detections. In other words, by whether the same conclusions in terms of epileptogenic regions or cognitive function location are obtained by the automatic methods or by the human experts. Moreover, the rate of HFO in a channel seems a reliable marker of underlying epileptogenic tissue and it has been the most commonly used measure. However, other measures (such as: ranking of channel durations, amplitudes, peak frequency, temporal distributions, and entropy) might turn out to be the most appropriate to characterize HFO activity. For instance, the ranking of the channels with respect to the rate showed that HFOs remain more confined than spikes when comparing interictal and ictal periods (Zijlmans et al., 2011). Further studies are needed to determine which measure is the most informative of the relation of HFOs with the epileptogenic region.
Given the massive amounts of iEEG data that are collected from patients undergoing evaluation for epilepsy surgery it is likely untenable to rely on visual review of HFO. The development of reliable HFO detectors will likely have a significant impact on future clinical applications of wide bandwidth recordings.
4. Artefacts or brain oscillations?
A major obstacle to HFO research is the unfortunate fact that various muscle activities typically result in prominent increases in gamma power (>25 Hz), and contaminate the recorded signal in the HFO spectrum. Myogenic activity interferes with the detection of HFO and represents a significant and often under-estimated challenge in clinical and basic research. For many years, iEEG recordings were assumed to be largely, if not completely, immune to eye movement and muscle artefacts. This assumption has recently been proven wrong (Ball et al., 2009; Jerbi et al., 2009a; Kovach et al., 2011). In this section we briefly overview these sources of artefacts and discuss ways of avoiding them.
Because blinks and saccadic eye movements have been shown to yield gamma-range increases in spectral power, in particular in scalp EEG (Reva and Aftanas, 2004; Trujillo et al., 2005; Yuval-Greenberg et al., 2008; Melloni et al., 2009), there is increasing concern about the reliability of HFO reports obtained from scalp EEG. For instance, the study by Yuval-Greenberg et al. (2008) shows that gamma activity recorded in posterior scalp EEG electrodes might be contaminated by ocular muscle activity associated with miniature saccades. Their detailed findings achieved using high-resolution eye-tracking are in line with earlier reports by Reva and Aftanas (2004) and Trujillo et al. (2005) who reported similar effects using the electrooculogram (EOG). This contamination was shown to be prominent when the reference electrode is positioned on the nose because a saccade is associated with a pre-saccadic spike potential that gets picked up by this reference channel and is thereby injected into all electrode traces. This critical issue might have been overlooked by a number of studies which may have falsely interpreted high frequency scalp EEG activity arising from eye movements as representing signals of neuronal origin. In contrast to scalp-EEG, invasive recordings have long been assumed to be largely immune to such myogenic artefacts. The spatial resolution of iEEG, and specifically of bipolar depth stereotactic-EEG (SEEG) schemes is on the order of 5 mm (Lachaux et al., 2003; Jerbi et al., 2009b) and is one reason why SEEG is, in general, not expected to be contaminated by distant ocular activity. However, intracranial electrodes that record directly from structures in the vicinity of eye muscles and cranium foramen can indeed be contaminated by myogenic activity from extraocular muscles. This was observed recently in depth iEEG recordings (Jerbi et al., 2009a) and replicated in subdural grid recordings (Kovach et al., 2011). These studies show that eye movements generate transient biphasic potential at the onset of a saccade along with an increase in broadband power (20–200 Hz). In addition to saccades, blinks have also been shown to contaminate iEEG (Ball et al., 2009). Moreover, extracranial muscle contractions caused by facial grimacing or chewing also generate artefacts in the high frequency components of iEEG recordings (Otsubo et al., 2008). The presence of muscular activity is more pronounced during seizures, due to tonic muscle activity caused by the seizure itself. These important questions are discussed in more detail in recent publications reporting scalp recorded HFO (Andrade-Valenca et al., 2011; von Ellenrieder et al., 2012).
5. Analysis and characterization of HFO
5.1. Time–frequency analysis
Time–frequency analysis has applications in almost every field of science, spanning neuroscience, engineering, and the physical sciences. Time–frequency analysis characterizes the temporal dependence of the frequency spectrum, and has been used extensively in LFP and EEG analysis (Le Van Quyen and Bragin, 2007). The fast Fourier transform (FFT) has long been the primary computational tool used for computing the spectral content in EEG time series. Because sine wave basis functions have an infinite duration, and the time–frequency uncertainty relationship, the approach provides precise frequency information without temporal resolution. This limitation can be overcome by using consecutive short duration overlapping windows over which the signal of interest is stationary. The temporal resolution is thus limited by the size of the window used for computation. In order to optimally capture the temporal dynamics of spectral measures, techniques, such as Wigner-Ville transform illustrated in Fig. 6E, have been developed and are widely used (Cohen, 1995). More recently, wavelet based transforms have been developed and have proven powerful (Mallat, 1998). Although the wavelet transform is only one of the various transforms that map a signal onto the time–frequency plane, it constitutes a common approach. The choice of the wavelet is not unique and any particular choice will extract the instantaneous frequencies with different accuracy. Given a so-called mother wavelet that oscillates over a small temporal support and vanishes (or decreases rapidly to zero), a set of wavelets is built from dilated and contracted versions of this function centered at various times b:
where a denotes the scale of the dilation (a < 1) or contraction (a > 1). Thus, a wavelet behaves like a ‘mathematical zoom’ at various scales and temporal positions. From a signal s(t), the wavelet coefficient at particular scale-time point (a,b) is given by the projection of the signal over the wavelet at this point:
where the overbar indicates the complex conjugate of the wavelet since this function can be complex-valued. In general, the time–frequency maps consist in displaying the square of the modulus in the time-scale plane. At any scale a, the time course of the wavelet coefficients along the coordinate b can be Fourier transformed to give a more compact and useful expression of the wavelet transform,
Fig. 6.

(A1–A2) Two examples of HFOs (in black) recorded with depth electrodes and their high-pass filtered (>5 Hz) signals, respectively (in red). (B1–B2) The DoG wavelet transform. (C1–C2) The Morlet wavelet transform. (D1–D2) The Morse wavelet transform. (E1–E2) The Wigner-Ville transform. The later being a quadratic time–frequency representation of the signal (no wavelet involved), it generally displays interference patterns that may not represent the frequency content. Among the three other time–frequency representations, the Morse wavelet transform is the most appropriate to describe the temporal organization of the frequency content of the signals.
in which ŝ(ω) and ψ̂(ω) denote the Fourier transform of the signal and the mother wavelet, respectively. This expression emphasizes the well-known trade-off to be found: a narrow-band wavelet will be accurate in frequency but highly delocalized in time. It is worth mentioning that a wavelet is said to be admissible if ψ̂(0) = 0, i.e. it strictly oscillates, without any DC component. Here, we consider three examples all based on an exponential decay in frequency (Fig. 7; examples of applications are shown in Fig. 6).
Fig. 7.

Spectral characteristics of the DoG, Morlet and Morse wavelets. In black, the three wavelets are conveniently scaled such that they share the same frequency mode (1 Hz). In blue, the spectrum correspond the a = 0.3 with respect to the previous and thus have a maxima around 3 Hz. At any scale, the spectrum represents the filter acting on the signal for computing the wavelet coefficients. A narrow band filter will be more accurate in frequency resolution. As seen here, this is achieved with the Morse wavelet. It thus explains the frequency resolution observed in the example in Fig. 6D.
The Derivative-of-Gaussian (DoG) wavelets. This well-known class of wavelet enforces the flatness of the wavelet at f = 0 through the power n:
This real wavelet is the derivative of order n of a Gaussian. The larger n is, the sharper the low-frequency spectrum of the wavelet is. The most common value is n = 2 (“Mexican hat” wavelet) but we consider n = 6 in the illustration in Fig. 7 (top) for two values of a. From the spectral characteristics of this wavelet, we cannot expect to obtain an accurate characterization of the high frequencies contained in the signals although it will detect precise location of the fluctuations. This is illustrated in Fig. 6B where two HFOs are analyzed.
The Morlet wavelet. This is the most popular wavelet despite the fact it does not satisfy exactly the admissibility condition. In frequency, it is Gaussian filter of a given width (fb), centered around a central frequency fc, just far enough to have ψ̂(0) ≈ 0:
The Fourier spectrum of this wavelet is shown in Fig. 7 for scales of ratio equal 0.3. The Morlet wavelet is complex valued and the spectral width being smaller than the previous DoG wavelet, the frequency accuracy of the transform is improved as shown in example of Fig. 6C.
The analytical Morse wavelet (Lilli and Olhede, 2010; Zerouali et al., 2011).
This complex-valued wavelet has a narrower bandwidth (Fig. 7) and better isolates the bursts of oscillations that compose the HFO. As illustrated in Fig. 6D, this time–frequency representation may reveal chirp-like oscillatory behavior (Fig. 6D, left) (Molaee-Ardekani et al., 2010) or a brief burst of fast activity well localized in time and frequency (Fig. 6D, right).
In this way, wavelet transforms are useful in accurately resolving LFP oscillations into specific time and frequency components, for example for the analysis of HFO in vitro (Khalilov et al., 2005; Oren et al., 2006), induced and evoked HFO correlates of a variety of physiological processes (Tallon-Baudry and Bertrand, 1999; Lachaux et al., 2005; Le Van Quyen et al., 2008) or pathologic HFO in epilepsy (Jouny et al., 2003). In addition to wavelets, pseudo-wavelets have been developed for detection of HFOs (Hsu et al., 2010). An example is a method that uses a set of mathematical damped harmonic oscillators as the wavelet basis. The approach relaxes the admissability constraint, which is required for well behaved inverse transforms, but generate good time–frequency resolution for brief oscillatory transients.
5.2. Cross-location and cross-frequency analyzes of HFOs
Synchronization of local and distributed neuronal networks is critical for normal brain function. Functional connectivity is commonly characterized by synchrony, i.e. statistical dependencies, between activities in different brain regions (Varela et al., 2001). These functional couplings are transient (with a duration in the order of hundreds of milliseconds), dynamic (the strength of association between two cortical regions has a time-varying nature) and frequency-specific (neuronal groups oscillate in specific bands according to a precise phase relationship). In neurological disease, neuronal synchrony can be altered, and in epilepsy synchrony is believed to play an important role in the formation of epileptic networks and the generation of seizures. In epilepsy, multiple studies have reported that epileptic brain is characterized by increased neuronal synchrony, except possibly prior to seizure onset when synchrony may actually decrease (Netoff and Schiff, 2002). Previous studies have largely been limited to lower frequency bandwidth in patients with epilepsy. Recently, investigation of neuronal synchrony in epileptic and control subjects with intractable facial pain using iEEG recordings showed a functional disconnection between the brain region generating seizures and surrounding brain (Warren et al., 2010) that extended to HFO range.
Multiple measures of neural synchrony were used to analyze interictal iEEG such as mean phase coherence (Mormann et al., 2003; Schevon et al., 2007), magnitude squared coherence (Zaveri et al., 2009), and nonlinear correlation (Bettus et al., 2008). Nevertheless, the specificity of frequency and transient nature of these high-frequency interactions require time–frequency sensitive tools for detecting short phase-locking between two oscillations, that is, the process by which two cyclic signals tend to oscillate, with a phase difference that is constant. Studying the relationships between the phases of neurophysiologic signals is not a new concept, but detecting precise phase-locking in experimental data can be problematic if, for example, phase entrainment is of short duration, buried in noise or masked by amplitude fluctuations between the oscillating signals that are uncorrelated. Only recently, new tools for the detection of localized phase synchronizations, with respect to both time and frequency, have been developed (Rosenblum et al., 1996; Lachaux et al., 1999; Le Van Quyen et al., 2001; Le Van Quyen and Bragin, 2007). The important advantage of these methods is that the phase components can be analyzed separately from the amplitude components, which can be noisy or uncorrelated. These techniques have opened up a range of new perspectives in neuroscience for the study of normal (reviewed in Varela et al., 2001) or disturbed (reviewed in Uhlhaas and Singer, 2006) synchronizations of HFOs. More recently, synchrony measures have been extended beyond simple pair-wise methods to the complex dynamics of ensembles. A global view of brain synchronization and local ensemble clusters can be probed by investigating the multichannel synchronization, and tools to investigate these complex dynamics have been recently applied to LFP from human recordings (Rudrauf et al., 2006).
In addition to cross-location analyzes of HFOs, recent studies indicate that brain oscillations do not exist in isolation, but they rather interact across different spectral scales giving rise to a variety of cross-frequency coupling dynamics (Canolty and Knight, 2010). Two forms of cross-frequency phase interactions have been described, an amplitude-independent phase-locking of n cycles of one LFP to m cycles of a independent LFP (Palva et al., 2005) and ‘nested oscillations’ (Chrobak and Buzsáki, 1998; Vanhatalo et al., 2004; Canolty et al., 2006). One example of this cross-frequency has been reported in human EEG recordings showing that the phase of low-frequency rhythms (4–8 Hz) during cognitive tasks modulates the amplitude of higher frequency oscillations (80–150 Hz) (Canolty et al., 2006). This type of cross-frequency coupling is called phase-amplitude modulation and another well known example occurs in the rodent hippocampus between the theta oscillatory (4–12 Hz) phase and the amplitude of gamma (30–100 Hz) oscillations (Buzsaki, 2006). Based on these observations, it has been suggested that global brain processes operate in a slow ‘rhythmic mode’ and use these differential excitability states as a mechanism of amplifying relevant activities at a small scale and suppressing irrelevant ones (Schroeder and Lakatos, 2009). Although, several methods have been proposed to assess cross-frequency coupling, none has been chosen as the gold standard. The different measures possess different advantages and limitations and may be used to serve different purposes (Cohen, 2008; Tort et al., 2010).
6. Non-invasive approaches of HFO recording
6.1. Scalp EEG recording of HFO
There have been reports of the detection of task-related gamma activity as well as HFO using scalp EEG, though high frequencies are attenuated over the scalp probably because of the summation of polyphasic cortical activity with variable phase (Pfurtscheller and Cooper, 1975). Regarding the cognitive studies, visual responses at 40 Hz in low-gamma band were initially detected through scalp EEG using time–frequency analysis (Tallon-Baudry et al., 1996). High-gamma (>60 Hz) as well as low-gamma band responses were also detected through MEG with respect to visual stimuli (Kaiser et al., 2004; Wyart and Tallon-Baudry, 2008). In patients with epilepsy, rhythmic ripple oscillations >80 Hz were recently described in association with scalp EEG epileptiform spikes, and were demonstrated to have a close relation with the seizure onset zone (Andrade-Valenca et al., 2011). In childhood epilepsy, scalp EEG ripple oscillations were found in patients with continuous spike-waves during slow wave sleep (CSWS) in Landau–Kleffner syndrome (LKS) and related disorders, and ripple oscillations were shown to have discrete spectral components in the ripple band in time–frequency spectra (Kobayashi et al., 2010) (Fig. 8). A small amount of ripple was observed in some patients with idiopathic childhood epilepsy (Kobayashi et al., 2011). There are also studies of paroxysmal gamma-band activity in the scalp EEG of childhood epilepsy (Kobayashi et al., 2004; Wu et al., 2008).
Fig. 8.

Ripple oscillations in the scalp EEG recorded from a child with Landau–Kleffner syndrome. Representative spikes (left and middle columns, arrowhead) are associated with ripple oscillation, which was largely invariant irrespective of low-cut frequency (LCF) of whether 60 or 120 Hz (EEG traces filtered at 0.5, 60, and 120 Hz are shown in green, blue, and red, respectively). The EEG was recorded during non-REM sleep and therefore did not include muscle activity or eye movements. Identical EEG data are presented in a referential montage (top: O1 with reference to the average EEG of bilateral earlobes, indicated as O1-Aav) and a bipolar montage (bottom: P3-O1). Note that spike-related ripples with at least four consecutive oscillations are clearly observed in both montages. Each panel of time–frequency spectra shows a corresponding discrete blob (arrow) with a frequency at around 130 Hz irrespective of referential or bipolar montage. In contrast, muscle activity (right column) contaminated to scalp EEG recorded during wakefulness is dominant over the temporal region (T4, F8-T4) close to muscles and has very irregular morphology and a noisy spectral pattern with no outstanding blobs.
Amplitude of scalp ripples is at most about 10 μV. In a study of intracranial ripples and fast ripples in pediatric patients with epilepsy (Akiyama et al., 2011), cortical ripples mostly had amplitude <100 μV, but occasionally reached 250 μV and even up to 500 μV and involved area that was simultaneously covered by several electrode-contacts. Although the exact relationship between intracranial and scalp ripples is still an open question, probably only a small proportion of cortical ripples has a broad spatial extent and can be recorded on the scalp (Andrade-Valenca et al., 2011).
6.2. Relation of HFO to fMRI
The analysis of relationship between recording sites of task-related gamma, particularly high-gamma, LFP and regions of blood oxygenation level-dependent (BOLD) signal activation in functional MRI (fMRI) has been pioneered with the use of implanted electrodes in patients with epilepsy to find a close spatial and temporal correspondence between gamma LFP and BOLD activation using an experimental paradigm with an audiovisual stimulation with a movie clip (Mukamel et al., 2005; Nir et al., 2007; Privman et al., 2007), a conditional visuomotor task (Brovelli et al., 2005), and a language task (Lachaux et al., 2007). BOLD signal activation by visual stimuli was demonstrated to reflect non-phase-locked changes in cortical gamma activity rather than phase-locked event-related potentials (ERPs) (Engell et al., 2012). Hemodynamic activity was measured by optical imaging and confirmed to have a tight relation with LFP gamma-oscillation in an animal study (Niessing et al., 2005). The simultaneous recording of iEEG spikes and fMRI was also performed (Vulliemoz et al., 2011). The simultaneous iEEG and fMRI has been demonstrated as a safe technique (Carmichael et al., 2010), and may be promising for the study of HFO in the future.
6.3. HFO generators and inverse problem
Source estimation of high frequencies is mostly performed by the MEG beamformer analysis, which has been used for a variety of cognitive studies. Beamformer techniques are more suitable for source analysis of HFO than traditional dipole source modeling because oscillatory activity is not phase-locked and cannot be averaged to improve signal-to-noise ratio as in case of evoked responses (Hillebrand et al., 2005). In beamformer techniques, an optimum spatial filter is defined for each location of a volumetric grid in the brain, and the spatial filter corresponding to each location is independently applied to MEG data to construct the spatial distribution of power within a specific frequency band.
Regarding the application of MEG beamformer techniques to visual function, gamma activity was estimated to be induced in the primary visual cortex by visual stimuli, particularly luminance contrast (Adjamian et al., 2008). In motor function, high gamma activity was identified in the primary motor cortex during self-paced movements, such as index finger abductions (Cheyne et al., 2008). The induction of gamma activity was also observed in the occipital lobe by a working memory task related to the retention of face orientations (Jokisch and Jensen, 2007), in the caudal inferior temporal gyrus by perceptual closure, which refers to the coherent perception of an object with incomplete visual information (Grützner et al., 2010), and in the midline occipital cortex and the posterior parietal cortex in responses to illusory triangles (Kaiser et al., 2008).
Regarding EEG data recorded with 27 electrodes, source of high-gamma activity related to a self-paced finger movement task was estimated by a weighted minimum norm least-squares inverse method, and the source was in the contralateral motor area (Darvas et al., 2010).
In a study involving epileptic patients who underwent surgery and MEG beamformer analysis on 20–70 Hz activity associated with epileptiform discharges, the resected area was identified with an accuracy of 85% by volumetric sources of beta/gamma power in patients with good surgical outcome (Guggisberg et al., 2008). The reliability of estimated sources of high frequencies should be verified further by comparison to invasive data in the future.
7. International database project and common open toolboxes for analysis
Because of the relatively limited number of centers performing epilepsy surgery, many researchers do not have access to adequate iEEG data sets required to address research questions. Similarly, because of the long time scales over which most animal models of epileptogenesis develop spontaneous seizures, weeks to months, it has not been the practice of researchers to store continuous EEG from these animals over the time course of epileptogenesis. However, it is clear that this is the kind of data (continuous wide-bandwidth electrophysiology from multiple epilepsy models and humans) required for research. Recently, there has been significant interest in development of shared databases and open source toolboxes. The Freiburg Seizure Prediction database (https://epilepsy.uni-freiburg.de/freiburg-seizure-prediction-project/eeg-database) is an excellent resource of human iEEG data from 21 patients, and has been used in multiple publications. There are now two large electrophysiology database projects, one funded by the European Union (http://www.epilepsiae.eu/project_outputs/european_database_on_epilepsy) and one funded by NIH to make human and animal electrophysology available (http://ieeg.org).
In addition to data there are now many toolboxes available for analyzing electrophysiological data. Several libraries of MATLAB routines are commercially available [e.g. the MATLAB wavelet toolbox (http://www.mathworks.com/products/wavelet)] or are free of charge on the Internet [e.g. the time–frequency toolbox (http://tftb.nongnu.org/), the Wavelab toolbox (http://stat.stanford.edu/~wavelab/) or the field trip toolbox (http://fieldtrip.fcdonders.nl/). Another popular is EEGlab (http://sccn.ucsd.edu/eeglab/) that is primarily focused on tools for event-related EEG dynamics. Recently, a software platform called EPILAB for epilepsy related analysis has been created (Teixeira et al., 2011; http://epilepsiae.eu/project_outputs/epilab_software).
8. Conclusions
Digital electronics and computing have revolutionized clinical iEEG and wide bandwidth electrophysiology recordings from hundreds of electrodes are now possible. These studies have redefined the spatial and temporal bandwidth of human brain activity (Bragin et al., 2002a,b; Schevon et al., 2009; Vanhatalo et al., 2005; Stead et al., 2010). There remain many questions about clinical utility, but this is now receiving significant attention (for a recent reviews see Engel et al., 2009; Le Van Quyen et al., 2006; Worrell and Gotman, 2011). The fact that HFO can be recorded with clinical macroelectrodes is of significant clinical importance, since high impedance microwire introduces a number of additional recording challenges. At this time, however, the optimal electrode cross-section and spacing for mapping epileptic brain is not known. While studies have previously demonstrated that FR are often localized to sub-millimeter scales (Bragin et al., 2002a,b), recent studies did not find a correlation between electrode size and HFO detections (Châtillon et al., 2011).
Two recent papers report an association between epilepsy surgery outcomes and resection of HFO generating tissue (Wu et al., 2010; Jacobs et al., 2010). Furthermore, increases in HFO may identify periods of increased predisposition to clinical seizures. Indeed, a question of fundamental importance to epilepsy is understanding the transition from interictal state to seizure. Because interictal HFO localize epileptogenic brain regions and seizures often initiate with a HFO multiple groups have investigated whether HFO precede seizures. In an in vitro model of epilepsy ripple and FR activity were demonstrated to increase prior to seizure onset (Dzhala and Staley, 2003). Grenier et al. (2001, 2003) in a series of in vivo experiments in cat cortex showed that an increase in ripple frequency oscillations preceded induced seizures. There are no conclusive studies, however, showing HFO are precursor events in human partial epilepsy (Zijlmans et al., 2011), although gamma frequency activity and HFO are increased in some patients prior to seizure (Worrell et al., 2004; Khosravani et al., 2009).
On a final note, the signal processing methods and the micro-versus macro-electrode issues discussed here are as critical for the rapidly growing body of neuroscience research that relies on invasive measurements of high frequency brain activity (e.g. Le Van Quyen et al., 2010; Jensen et al., 2007; Lachaux et al., 2003) as the clinical applications. A better understanding of the implications and limitations of the techniques and methods used will be key in shedding light on a number of questions such as the relationship between neuronal firing and broadband gamma-band activity (Manning et al., 2009) or the functional significance of high gamma power suppression in default-mode network structures during attention (Ossandón et al., 2011; Jerbi et al., 2010).
Abbreviations
- EEG
electroencephalography
- iEEG
intracranial EEG
- MEG
magnetoencephalography
- LFP
local field potential
- HFO
high-frequency oscillations
- FR
fast ripples
References
- Abend NS, Gutierrez-Colina A, Zhao H, Guo R, Marsh E, Clancy RR, Dlugos Dennis J. Interobserver reproducibility of electroencephalogram interpretation in critically ill children. J Clin Neurophysiol. 2011;28 (1):15–19. doi: 10.1097/WNP.0b013e3182051123. [DOI] [PMC free article] [PubMed] [Google Scholar]
- Adjamian P, Hadjipapas A, Barnes GR, Hillebrand A, Holliday IE. Induced gamma activity in primary visual cortex is related to luminance and not color contrast: an MEG study. J Vis. 2008;8:4.1–4.7. doi: 10.1167/8.7.4. [DOI] [PubMed] [Google Scholar]
- Akiyama T, McCoy B, Go CY, Ochi A, Elliott IM, Akiyama M, Donner EJ, Weiss SK, Snead OC, 3rd, Rutka JT, Drake JM, Otsubo H. Focal resection of fast ripples on extraoperative intracranial EEG improves seizure outcome in pediatric epilepsy. Epilepsia. 2011;52:1802–1811. doi: 10.1111/j.1528-1167.2011.03199.x. [DOI] [PubMed] [Google Scholar]
- Andrade-Valenca LP, Dubeau F, Mari F, Zelmann R, Gotman J. Interictal scalp fast oscillations as a marker of the seizure onset zone. Neurology. 2011;77:524–531. doi: 10.1212/WNL.0b013e318228bee2. [DOI] [PMC free article] [PubMed] [Google Scholar]
- Baker SN, Curio G, Lemon RN. EEG oscillations at 600 Hz are macroscopic markers for cortical spike bursts. J Physiol. 2003;550:529–534. doi: 10.1113/jphysiol.2003.045674. [DOI] [PMC free article] [PubMed] [Google Scholar]
- Ball T, Kern M, Mutschler I, Aertsen A, Schulze-Bonhage A. Signal quality of simultaneously recorded invasive and non-invasive EEG. Neuroimage. 2009;46:708–716. doi: 10.1016/j.neuroimage.2009.02.028. [DOI] [PubMed] [Google Scholar]
- Bashir ZI, Holmes O. Phases in the development of a penicillin epileptiform focus in rat neocortex. Exp Brain Res. 1993;96:319–327. doi: 10.1007/BF00227111. [DOI] [PubMed] [Google Scholar]
- Benbadis SR, LaFrance WC, Jr, Papandonatos GD, Korabathina K, Lin K, Kraemer HC NES Treatment Workshop. Interrater reliability of EEG-video monitoring. Neurology. 2009 Sep;73 (11):843–846. doi: 10.1212/WNL.0b013e3181b78425. [DOI] [PMC free article] [PubMed] [Google Scholar]
- Bettus G, Wendling F, Guye M, Valton L, Régis J, Chauvel P, Bartolomei F. Enhanced EEG functional connectivity in mesial temporal lobe epilepsy. Epilepsy Res. 2008;81:58–68. doi: 10.1016/j.eplepsyres.2008.04.020. [DOI] [PubMed] [Google Scholar]
- Bénar CG, Chauvière L, Bartolomei F, Wendling F. Pitfalls of high-pass filtering for detecting epileptic oscillations: a technical note on false ripples. Clin Neurophysiol. 2010;121:301–310. doi: 10.1016/j.clinph.2009.10.019. [DOI] [PubMed] [Google Scholar]
- Blanco JA, Stead M, Krieger A, Stacey W, Maus D, Marsh E, Viventi J, Lee KH, Marsh R, et al. Data mining neocortical high-frequency oscillations in epilepsy and controls. Brain. 2011;134:2948–2959. doi: 10.1093/brain/awr212. [DOI] [PMC free article] [PubMed] [Google Scholar]
- Blanco JA, Stead M, Krieger A, Viventi J, Marsh WR, Lee KH, Worrell GA, Litt B. Unsupervised classification of high-frequency oscillations in human neocortical epilepsy and control patients. J Neurophysiol. 2010;104:2900–2912. doi: 10.1152/jn.01082.2009. [DOI] [PMC free article] [PubMed] [Google Scholar]
- Bragin A, Engel JJ, Wilson CL, Fried I, Buzsaki G. High-frequency oscillations in human brain. Hippocampus. 1999a;9:137–142. doi: 10.1002/(SICI)1098-1063(1999)9:2<137::AID-HIPO5>3.0.CO;2-0. [DOI] [PubMed] [Google Scholar]
- Bragin A, Engel JJ, Wilson CL, Fried I, Mathern GW. Hippocampal and entorhinal cortex high-frequency oscillations (100–500 Hz) in human epileptic brain and in kainic acid-treated rats with chronic seizures. Epilepsia. 1999b;40:127–137. doi: 10.1111/j.1528-1157.1999.tb02065.x. [DOI] [PubMed] [Google Scholar]
- Bragin A, Mody I, Wilson CL, Engel JJ. Local generation of fast ripples in epileptic brain. J Neurosci. 2002a;22:2012–2221. doi: 10.1523/JNEUROSCI.22-05-02012.2002. [DOI] [PMC free article] [PubMed] [Google Scholar]
- Bragin A, Wilson CL, Engel JJ. Chronic epileptogenesis requires development of a network of pathologically interconnected neuron clusters: a hypothesis. Epilepsia. 2000;41:S144–S152. doi: 10.1111/j.1528-1157.2000.tb01573.x. [DOI] [PubMed] [Google Scholar]
- Bragin A, Wilson CL, Staba RJ, Reddick M, Fried I, Engel JJ. Interictal high-frequency oscillations (80–500 Hz) in the human epileptic brain: entorhinal cortex. Ann Neurol. 2002b;52:407–415. doi: 10.1002/ana.10291. [DOI] [PubMed] [Google Scholar]
- Brinkmann BH, Bower MR, Stengel KA, Worrell GA, Stead M. Large-scale electrophysiology: acquisition, compression, encryption, and storage of big data. J Neurosci Methods. 2009;180:185–192. doi: 10.1016/j.jneumeth.2009.03.022. [DOI] [PMC free article] [PubMed] [Google Scholar]
- Brovelli A, Lachaux JP, Kahane P, Boussaoud D. High gamma frequency oscillatory activity dissociates attention from intention in the human premotor cortex. Neuroimage. 2005;28:154–164. doi: 10.1016/j.neuroimage.2005.05.045. [DOI] [PubMed] [Google Scholar]
- Buzsaki G. Rhythms of the Brain. University Press; New York, NY: 2006. [Google Scholar]
- Buzsaki G. Large-scale recording of neuronal ensembles. Nat Neurosci. 2004;7:446–451. doi: 10.1038/nn1233. [DOI] [PubMed] [Google Scholar]
- Buzsaki G, Draguhn A. Neuronal oscillations in cortical networks. Science. 2004;304:1926–1929. doi: 10.1126/science.1099745. [DOI] [PubMed] [Google Scholar]
- Buzsaki G, Horvath Z, Urioste R, Hetke J, Wise K. High-frequency network oscillaiton in hippocampus. Science. 1992;256:1025–1027. doi: 10.1126/science.1589772. [DOI] [PubMed] [Google Scholar]
- Buzsaki G, Traub RD, Pedley TA. The cellular basis of EEG activity. In: Ebersole JS, Pedley TA, editors. Current Practice of Clinical Electroencephalography. Lippincott Williams & Wilkins; Philadelphia: 2003. [Google Scholar]
- Canolty RT, Knight RT. The functional role of cross-frequency coupling. Trends Cogn Sci. 2010;14:506–515. doi: 10.1016/j.tics.2010.09.001. [DOI] [PMC free article] [PubMed] [Google Scholar]
- Canolty RT, Edwards E, Dalal SS, Soltani M, Nagarajan SS, Kirsch HE, Berger MS, Barbaro NM, Knight RT. High gamma power is phase-locked to theta oscillations in human neocortex. Science. 2006;313:1626–1628. doi: 10.1126/science.1128115. [DOI] [PMC free article] [PubMed] [Google Scholar]
- Carmichael DW, Thornton JS, Rodionov R, Thornton R, McEvoy AW, Ordidge RJ, Allen PJ, Lemieux L. Feasibility of simultaneous intracranial EEG-fMRI in humans: a safety study. Neuroimage. 2010;49:379–390. doi: 10.1016/j.neuroimage.2009.07.062. [DOI] [PubMed] [Google Scholar]
- Châtillon CE, Zelmann R, Bortel A, Avoli M, Gotman J. Contact size does not affect high frequency oscillation detection in intracerebral EEG recordings in a rat epilepsy model. Clin Neurophysiol. 2011;122:1701–1705. doi: 10.1016/j.clinph.2011.02.022. [DOI] [PMC free article] [PubMed] [Google Scholar]
- Chesi AJ, Stone TW. Epileptiform activity in supragranular and infragranular blocks of mouse neocortex. Epilepsy Res. 1998;31:29–38. doi: 10.1016/s0920-1211(98)00013-8. [DOI] [PubMed] [Google Scholar]
- Cheyne D, Bells S, Ferrari P, Gaetz W, Bostan AC. Self-paced movements induce high-frequency gamma oscillations in primary motor cortex. Neuroimage. 2008;42:332–342. doi: 10.1016/j.neuroimage.2008.04.178. [DOI] [PubMed] [Google Scholar]
- Chrobak JJ, Buzsáki G. Gamma oscillations in the entorhinal cortex of the freely behaving rat. J Neurosci. 1998;18:388–398. doi: 10.1523/JNEUROSCI.18-01-00388.1998. [DOI] [PMC free article] [PubMed] [Google Scholar]
- Cohen L. Time–Frequency Analysis. Prentice Hall, Inc; New Jersey: 1995. [Google Scholar]
- Cohen MX. Assessing transient cross-frequency coupling in EEG data. J Neurosci Methods. 2008;168:494–499. doi: 10.1016/j.jneumeth.2007.10.012. [DOI] [PubMed] [Google Scholar]
- Crépon B, Navarro V, Hasboun D, Clemenceau S, Martinerie J, Baulac M, Adam C, Le Van Quyen M. Mapping interictal oscillations greater than 200 Hz recorded with intracranial macroelectrodes in human epilepsy. Brain. 2010;133:33–45. doi: 10.1093/brain/awp277. [DOI] [PubMed] [Google Scholar]
- Darvas F, Scherer R, Ojemann JG, Rao RP, Miller KJ, Sorensen LB. High gamma mapping using EEG. Neuroimage. 2010;49:930–938. doi: 10.1016/j.neuroimage.2009.08.041. [DOI] [PMC free article] [PubMed] [Google Scholar]
- Draguhn A. Connecting cortex to machines: recent advances in brain interfaces. Nat Neurosci. 2002;5 (Suppl):1085–1088. doi: 10.1038/nn947. [DOI] [PubMed] [Google Scholar]
- Dzhala VI, Staley KJ. Transition from interictal to ictal activity in limbic networks in vitro. J Neurosci. 2003;23:7873–7880. doi: 10.1523/JNEUROSCI.23-21-07873.2003. [DOI] [PMC free article] [PubMed] [Google Scholar]
- Engel J, Bragin A, Staba R, Mody I. High-frequency oscillations: what is normal and what is not? Epilepsia. 2009;50:598–604. doi: 10.1111/j.1528-1167.2008.01917.x. [DOI] [PubMed] [Google Scholar]
- Engell AD, Huettel S, McCarthy G. The fMRI BOLD signal tracks electrophysiological spectral perturbations, not event-related potentials. Neuroimage. 2012;59:2600–2606. doi: 10.1016/j.neuroimage.2011.08.079. [DOI] [PMC free article] [PubMed] [Google Scholar]
- Fisher RS, Webber WR, Lesser RP, Arroyo S, Uematsu S. High-frequency EEG activity at the start of seizures. J Clin Neurophysiol. 1992;9:441–448. doi: 10.1097/00004691-199207010-00012. [DOI] [PubMed] [Google Scholar]
- Gabor AJ, Scobey RP, Wehrli CJ. Relationship of epileptogenicity to cortical organization. J Neurophysiol. 1979;42:1609–1625. doi: 10.1152/jn.1979.42.6.1609. [DOI] [PubMed] [Google Scholar]
- Gardner A, Krieger A, Vachtsevanos G, Litt B. One-class novelty detection for seizure analysis from intracranial EEG. J Mach Learn Res. 2007a;7:1025–1044. [Google Scholar]
- Gardner AB, Worrell GA, Marsh E, Dlugos D, Litt B. Human and automated detection of high-frequency oscillations in clinical intracranial EEG recordings. Clin Neurophysiol. 2007b;118:1134–1143. doi: 10.1016/j.clinph.2006.12.019. [DOI] [PMC free article] [PubMed] [Google Scholar]
- Gibbs J. Nature Lix, 200 and 600. 1899. Fourier’s Series. [Google Scholar]
- Gibbs F, Lennox WG, Gibbs EL. The electroencephalogram in diagnosis and in localization of epileptic seizures. Arch Neurol Psychiatry. 1936;36:1225–1235. [Google Scholar]
- Gloor P. The work of Hans Berger. Electroencephalogr Clin Neurophysiol. 1969;27:649. doi: 10.1016/0013-4694(69)91207-3. [DOI] [PubMed] [Google Scholar]
- Gloor P. Contributions of electroencephalography and electrocorticography to the neurosurgical treatment of the epilepsies. Adv Neurol. 1975;8:59–105. [PubMed] [Google Scholar]
- Goldensohn ES. Initiation and propagation of epileptogenic foci. Adv Neurol. 1975;11:141–162. [PubMed] [Google Scholar]
- Gregory RP, Oates T, Merry RT. Electroencephalogram epileptiform abnormalities in candidates for aircrew training. Electroencephalogr Clin Neurophysiol. 1993;86:75–77. doi: 10.1016/0013-4694(93)90069-8. [DOI] [PubMed] [Google Scholar]
- Grenier F, Timofeev I, Steriade M. Focal synchronization of ripples (80–200 Hz) in neocortex and their neuronal correlates. J Neurophysiol. 2001;86:1884–2198. doi: 10.1152/jn.2001.86.4.1884. [DOI] [PubMed] [Google Scholar]
- Grenier F, Timofeev I, Steriade M. Neocortical very fast oscillations (ripples, 80–200 Hz) during seizures: intracellular correlates. J Neurophysiol. 2003;89:841–852. doi: 10.1152/jn.00420.2002. [DOI] [PubMed] [Google Scholar]
- Grützner C, Uhlhaas PJ, Genc E, Kohler A, Singer W, Wibral M. Neuroelectromagnetic correlates of perceptual closure processes. J Neurosci. 2010;30:8342–8352. doi: 10.1523/JNEUROSCI.5434-09.2010. [DOI] [PMC free article] [PubMed] [Google Scholar]
- Guggisberg AG, Kirsch HE, Mantle MM, Barbaro NM, Nagarajan SS. Fast oscillations associated with interictal spikes localize the epileptogenic zone in patients with partial epilepsy. Neuroimage. 2008;39:661–668. doi: 10.1016/j.neuroimage.2007.09.036. [DOI] [PMC free article] [PubMed] [Google Scholar]
- Hamer HM, Morris HH, Mascha EJ, Karafa MT, Bingaman WE, Bej MD, Burgess RC, Dinner DS, Foldvary NR, et al. Complications of invasive video-EEG monitoring with subdural grid electrodes. Neurology. 2002;58:97–103. doi: 10.1212/wnl.58.1.97. [DOI] [PubMed] [Google Scholar]
- Hillebrand A, Singh KD, Holliday IE, Furlong PL, Barnes GR. A new approach to neuroimaging with megnetoencephalography. Hum Brain Mapp. 2005;25:199–211. doi: 10.1002/hbm.20102. [DOI] [PMC free article] [PubMed] [Google Scholar]
- Holmes O. The intracortical neuronal connectivity subserving focal epileptiform activity in rat neocortex. Exp Physiol. 1994;79:705–721. doi: 10.1113/expphysiol.1994.sp003802. [DOI] [PubMed] [Google Scholar]
- Hsu D, Hsu M, Grabenstatter HL, Worrell GA, Sutula TP. Time–frequency analysis using damped-oscillator pseudo-wavelets: application to electrophysiological recordings. J Neurosci Methods. 2010;194:179–192. doi: 10.1016/j.jneumeth.2010.09.019. [DOI] [PMC free article] [PubMed] [Google Scholar]
- Jacobs J, Levan P, Chander R, Hall J, Dubeau F, Gotman J. Interictal high-frequency oscillations (80–500 Hz) are an indicator of seizure onset areas independent of spikes in the human epileptic brain. Epilepsia. 2008;49:1893–1907. doi: 10.1111/j.1528-1167.2008.01656.x. [DOI] [PMC free article] [PubMed] [Google Scholar]
- Jacobs J, Zijlmans M, Zelmann R, Chatillon CE, Hall J, Olivier A, Dubeau F, Gotman J. High-frequency electroencephalographic oscillations correlate with outcome of epilepsy surgery. Ann Neurol. 2010;67:209–220. doi: 10.1002/ana.21847. [DOI] [PMC free article] [PubMed] [Google Scholar]
- Jacobs J, Staba R, Asano E, Otsubo H, Wu J, Zijlmans M, Mohamed I, Kahane P, Dubeau F, Navarro V, Gotman J. High frequency oscillations (HFOs) in clinical epilepsy. Prog Neurobiol. doi: 10.1016/j.pneurobio.2012.03.001. in this special issue. [DOI] [PMC free article] [PubMed] [Google Scholar]
- Jensen O, Kaiser J, Lachaux JP. Human gamma-frequency oscillations associated with attention and memory. Trends Neurosci. 2007;30:317–324. doi: 10.1016/j.tins.2007.05.001. [DOI] [PubMed] [Google Scholar]
- Jerbi K, Freyermuth S, Dalal S, Kahane P, Bertrand O, Berthoz A, Lachaux JP. Saccade related gamma-band activity in intracerebral EEG: dissociating neural from ocular muscle activity. Brain Topogr. 2009a;22:18–23. doi: 10.1007/s10548-009-0078-5. [DOI] [PubMed] [Google Scholar]
- Jerbi K, Ossandón T, Hamamé CM, Senova S, Dalal S, Jung J, Minotti L, Bertrand O, Berthoz A, Kahane P, Lachaux JP. Task-related gamma-band dynamics from an intracerebral perspective: review and implications for surface EEG and MEG. Hum Brain Mapp. 2009b;30 (June):1758–1771. doi: 10.1002/hbm.20750. [DOI] [PMC free article] [PubMed] [Google Scholar]
- Jerbi K, Vidal S, Ossandon T, Dalal S, Jung J, Hoffmann D, Minotti L, Bertrand O, Kahane P, Lachaux JP. Exploring the electrophysiological correlates of the default-mode network with intracerebral EEG. Front Syst Neurosci. 2010;4 (June):27. doi: 10.3389/fnsys.2010.00027. [DOI] [PMC free article] [PubMed] [Google Scholar]
- Jirsch JD, Urrestarazu E, LeVan P, Olivier A, Dubeau F, Gotman J. High-frequency oscillations during human focal seizures. Brain. 2006;129:1593–1608. doi: 10.1093/brain/awl085. [DOI] [PubMed] [Google Scholar]
- Jouny CC, Franaszczuk PJ, Bergey GK. Characterization of epileptic seizure dynamics using Gabor atom density. Clin Neurophysiol. 2003;114:426–437. doi: 10.1016/s1388-2457(02)00344-9. [DOI] [PubMed] [Google Scholar]
- Jokisch D, Jensen O. Modulation of gamma and alpha activity during a working memory task engaging the dorsal or ventral stream. J Neurosci. 2007;27:3244–3251. doi: 10.1523/JNEUROSCI.5399-06.2007. [DOI] [PMC free article] [PubMed] [Google Scholar]
- Kajikawa Y, Schroeder CE. How local is the local field potential? Neuron. 2011;72 (5):847–858. doi: 10.1016/j.neuron.2011.09.029. [DOI] [PMC free article] [PubMed] [Google Scholar]
- Katzner S, Nauhaus I, Benucci A, Bonin V, Ringach DL, Carandini M. Local origin of field potentials in visual cortex. Neuron. 2009;61 (1):35–41. doi: 10.1016/j.neuron.2008.11.016. [DOI] [PMC free article] [PubMed] [Google Scholar]
- Khalilov I, Le Van Quyen M, Gozlan H, Ben-Ari Y. Epileptogenic actions of GABA and fast oscillations in the developing hippocampus. Neuron. 2005;48:787–796. doi: 10.1016/j.neuron.2005.09.026. [DOI] [PubMed] [Google Scholar]
- Kaiser J, Bühler M, Lutzenberger W. Magnetoencephalographic gamma-band responses to illusory triangles in humans. Neuroimage. 2004;23:551–560. doi: 10.1016/j.neuroimage.2004.06.033. [DOI] [PubMed] [Google Scholar]
- Kaiser J, Heidegger T, Wibral M, Altmann CF, Lutzenberger W. Distinct gamma-band components reflect the short-term memory maintenance of different sound lateralization angles. Cereb Cortex. 2008;18:2286–2295. doi: 10.1093/cercor/bhm251. [DOI] [PMC free article] [PubMed] [Google Scholar]
- Keller CJ, Truccolo W, Gale JT, Eskandar E, Thesen T, Carlson C, Devinsky O, Kuzniecky R, Doyle WK, et al. Heterogeneous neuronal firing patterns during interictal epileptiform discharges in the human cortex. Brain. 2010;133:1668–1681. doi: 10.1093/brain/awq112. [DOI] [PMC free article] [PubMed] [Google Scholar]
- Khosravani H, Mehrotra N, Rigby M, Hader WJ, Pinnegar CR, Pillay N, Wiebe S, Federico P. Spatial localization and time-dependant changes of electrographic high frequency oscillations in human temporal lobe epilepsy. Epilepsia. 2009;50:605–616. doi: 10.1111/j.1528-1167.2008.01761.x. [DOI] [PubMed] [Google Scholar]
- Kobayashi K, Oka M, Akiyama T, Inoue T, Abiru K, Ogino T, Yoshinaga H, Ohtsuka Y, Oka E. Very fast rhythmic activity on scalp EEG associated with epileptic spasms. Epilepsia. 2004;45:488–496. doi: 10.1111/j.0013-9580.2004.45703.x. [DOI] [PubMed] [Google Scholar]
- Kobayashi K, Watanabe Y, Inoue T, Oka M, Yoshinaga H, Ohtsuka Y. Scalp-recorded high-frequency oscillations in childhood sleep-induced electrical status epilepticus. Epilepsia. 2010;51:2190–2194. doi: 10.1111/j.1528-1167.2010.02565.x. [DOI] [PubMed] [Google Scholar]
- Kobayashi K, Yoshinaga H, Toda Y, Inoue T, Oka M, Ohtsuka Y. High-frequency oscillations in idiopathic partial epilepsy of childhood. Epilepsia. 2011;52:1812–1819. doi: 10.1111/j.1528-1167.2011.03169.x. [DOI] [PubMed] [Google Scholar]
- Kovach CK, Tsuchiya N, Kawasaki H, Oya H, Howard MA, Adolphs R. Manifestation of ocular-muscle EMG contamination in human intracranial recordings. Neuroimage. 2011;54:213–233. doi: 10.1016/j.neuroimage.2010.08.002. [DOI] [PMC free article] [PubMed] [Google Scholar]
- Lachaux JP, Fonlupt P, Kahane P, Minotti L, Hoffmann D, Bertrand O, Baciu M. Relationship between task-related gamma oscillations and BOLD signal: new insights from combined fMRI and intracranial EEG. Hum Brain Mapp. 2007;28:1368–1375. doi: 10.1002/hbm.20352. [DOI] [PMC free article] [PubMed] [Google Scholar]
- Lachaux JP, Rodriguez E, Martinerie J, Varela FJ. Measuring phase synchrony in brain signals. Hum Brain Mapp. 1999;8:194–208. doi: 10.1002/(SICI)1097-0193(1999)8:4<194::AID-HBM4>3.0.CO;2-C. [DOI] [PMC free article] [PubMed] [Google Scholar]
- Lachaux JP, Rudrauf D, Kahane P. Intracranial EEG and human brain mapping. J Physiol Paris. 2003;97:613–628. doi: 10.1016/j.jphysparis.2004.01.018. [DOI] [PubMed] [Google Scholar]
- Lachaux JP, George N, Tallon-Baudry C, Martinerie J, Hugueville L, Minotti L, Kahane P, Renault B. The many faces of the gamma band response to complex visual stimuli. Neuroimage. 2005;25:491–501. doi: 10.1016/j.neuroimage.2004.11.052. [DOI] [PubMed] [Google Scholar]
- Le Van Quyen M, Bragin A. Analysis of dynamic brain oscillations: methodological advances. Trends Neurosci. 2007;30:365–373. doi: 10.1016/j.tins.2007.05.006. [DOI] [PubMed] [Google Scholar]
- Le Van Quyen M, Foucher J, Lachaux J, Rodriguez E, Lutz A, Martinerie J, Varela FJ. Comparison of Hilbert transform and wavelet methods for the analysis of neuronal synchrony. J Neurosci Methods. 2001;111:83–98. doi: 10.1016/s0165-0270(01)00372-7. [DOI] [PubMed] [Google Scholar]
- Le Van Quyen M, Khalilov I, Ben-Ari Y. The dark side of high-frequency oscillations in the developing brain. Trends Neurosci. 2006;29:419–427. doi: 10.1016/j.tins.2006.06.001. [DOI] [PubMed] [Google Scholar]
- Le Van Quyen M, Bragin A, Staba R, Crépon B, Wilson CL, Engel J. Cell type-specific firing during ripple oscillations in the hippocampal formation of humans. J Neurosci. 2008;28:6104–6110. doi: 10.1523/JNEUROSCI.0437-08.2008. [DOI] [PMC free article] [PubMed] [Google Scholar]
- Le Van Quyen M, Staba R, Bragin A, Dickson C, Valderrama M, Fried I, Engel J. Large-scale microelectrode recordings of high frequency gamma oscillations in human cortex during sleep. J Neurosci. 2010;30:7770–7782. doi: 10.1523/JNEUROSCI.5049-09.2010. [DOI] [PMC free article] [PubMed] [Google Scholar]
- Lilli J, Olhede S. On the analytic wavelet transform. IEEE Trans Inf Theory. 2010;56 (8):4135–4156. [Google Scholar]
- Lisman JE, Idiart MA. Storage of 7+/−2 short-term memories in oscillatory subcycles. Science. 1995;267:1512–1555. doi: 10.1126/science.7878473. [DOI] [PubMed] [Google Scholar]
- Luders JJ, Comair Y. Epilepsy Surgery. Lippincott Williams & Wilkins; Philadelphia: 2001. [Google Scholar]
- Mallat S. A Wavelet Tour of Signal Processing. Academic Press; London: 1998. [Google Scholar]
- Manning JR, Jacobs J, Fried I, Kahana MJ. Broadband shifts in local field potential power spectra are correlated with single-neuron spiking in humans. J Neurosci. 2009 Oct;29(43):13613–13620. doi: 10.1523/JNEUROSCI.2041-09.2009. [DOI] [PMC free article] [PubMed] [Google Scholar]
- Melloni L, Schwiedrzik CM, Wibral M, Rodriguez E, Singer W. Response to: Yuval-Greenberg et al. transient induced gamma-band response in EEG as a manifestation of miniature saccades. Neuron. 2009;62 (1):8–10. doi: 10.1016/j.neuron.2009.04.002. [DOI] [PubMed] [Google Scholar]
- Miles R, Wong RK, Traub RD. Synchronized after discharges in the hippocampus: contribution of local synaptic interactions. Neuroscience. 1984;12:1179–1189. doi: 10.1016/0306-4522(84)90012-5. [DOI] [PubMed] [Google Scholar]
- Mitzdorf U. Current source-density method and application in cat cerebral cortex: investigation of evoked potentials and EEG phenomena. Physiol Rev. 1985;65:37–100. doi: 10.1152/physrev.1985.65.1.37. [DOI] [PubMed] [Google Scholar]
- Mormann F, Andrzejak RG, Kreuz T, Rieke C, David P, Elger CE, Lehnertz K. Automated detection of a preseizure state based on a decrease in synchronization in intracranial electroencephalogram recordings from epilepsy patients. Phys Rev E Stat Nonlin Soft Matter Phys. 2003;67:021912. doi: 10.1103/PhysRevE.67.021912. [DOI] [PubMed] [Google Scholar]
- Molaee-Ardekani B, Benquet P, Bartolomei F, Wendling F. Computational modeling of high-frequency oscillations at the onset of neocortical partial seizures: From ‘altered structure’ to ‘dysfunction’. NeuroImage. 2010;52:1109–1122. doi: 10.1016/j.neuroimage.2009.12.049. [DOI] [PubMed] [Google Scholar]
- Mukamel R, Gelbard H, Arieli A, Hasson U, Fried I, Malach R. Coupling between neuronal firing, field potentials, and FMRI in human auditory cortex. Science. 2005;309:951–954. doi: 10.1126/science.1110913. [DOI] [PubMed] [Google Scholar]
- Neidermeyer E, Lopes da Silva F. Electroencephalography: Basic Principals, Clinical Applications and Related Fields. Lippincott and Wilkins; Philadelphia: 2011. [Google Scholar]
- Netoff TI, Schiff SJ. Decreased neuronal synchronization during experimental seizures. J Neurosci. 2002;22:7297–7307. doi: 10.1523/JNEUROSCI.22-16-07297.2002. [DOI] [PMC free article] [PubMed] [Google Scholar]
- Niessing J, Ebisch B, Schmidt KE, Niessing M, Singer W, Galuske RA. Hemodynamic signals correlate tightly with synchronized gamma oscillations. Science. 2005;309:948–951. doi: 10.1126/science.1110948. [DOI] [PubMed] [Google Scholar]
- Nir Y, Fisch L, Mukamel R, Gelbard-Sagiv H, Arieli A, Fried I, Malach R. Coupling between neuronal firing rate, gamma LFP, and BOLD fMRI is related to interneuronal correlations. Curr Biol. 2007;17:1275–1285. doi: 10.1016/j.cub.2007.06.066. [DOI] [PubMed] [Google Scholar]
- Oren I, Mann EO, Paulsen O, Hájos N. Synaptic currents in anatomically identified CA3 neurons during hippocampal gamma oscillations in vitro. J Neurosci. 2006;26:9923–9934. doi: 10.1523/JNEUROSCI.1580-06.2006. [DOI] [PMC free article] [PubMed] [Google Scholar]
- Ossandón T, Jerbi K, Vidal JR, Bayle DJ, Henaff MA, Jung J, Minotti L, Bertrand O, Kahane P, Lachaux JP. Transient suppression of broadband gamma power in the default-mode network is correlated with task complexity and subject performance. J Neurosci. 2011;12:14521–21430. doi: 10.1523/JNEUROSCI.2483-11.2011. [DOI] [PMC free article] [PubMed] [Google Scholar]
- Otsubo H, Ochi A, Imai K, Akiyama T, Fujimoto A, Go C, Dirks P, Donner EJ. High-frequency oscillations of ictal muscle activity and epileptogenic discharges on intracranial EEG in a temporal lobe epilepsy patient. Clin Neurophysiol. 2008;119 (4):862–868. doi: 10.1016/j.clinph.2007.12.014. [DOI] [PubMed] [Google Scholar]
- Palva JM, Palva S, Kaila K. Phase synchrony among neuronal oscillations in the human cortex. J Neurosci. 2005;25:3962–3972. doi: 10.1523/JNEUROSCI.4250-04.2005. [DOI] [PMC free article] [PubMed] [Google Scholar]
- Pfurtscheller G, Cooper R. Frequency dependence of the transmission of the EEG from cortex to scalp. Electroencephalogr Clin Neurophysiol. 1975;38:93–96. doi: 10.1016/0013-4694(75)90215-1. [DOI] [PubMed] [Google Scholar]
- Privman E, Nir Y, Kramer U, Kipervasser S, Andelman F, Neufeld MY, Mukamel R, Yeshurun Y, Fried I, Malach R. Enhanced category tuning revealed by intracranial electroencephalograms in high-order human visual areas. J Neurosci. 2007;27:6234–6242. doi: 10.1523/JNEUROSCI.4627-06.2007. [DOI] [PMC free article] [PubMed] [Google Scholar]
- Reichenthal E, Hocherman S. The critical cortical area for development of penicillin-induced epielpsy. Electroencephalogr Clin Neurophysiol. 1977;42:248–251. doi: 10.1016/0013-4694(77)90031-1. [DOI] [PubMed] [Google Scholar]
- Reichenthal E, Hocherman S. A critical epileptic area in the cat’s cortex and its relation to the cortical columns. Electroencephalogr Clin Neurophysiol. 1979;47:147–152. doi: 10.1016/0013-4694(79)90216-5. [DOI] [PubMed] [Google Scholar]
- Reva NV, Aftanas LI. The coincidence between late non-phase-locked gamma synchronization response and saccadic eye movements. Int J Psychophysiol. 2004;51:215–222. doi: 10.1016/j.ijpsycho.2003.09.005. [DOI] [PubMed] [Google Scholar]
- Rosenblum MG, Pikovsky AS, Kurths J. Phase synchronization of chaotic oscillators. Phys Rev Lett. 1996;76:1804–1807. doi: 10.1103/PhysRevLett.76.1804. [DOI] [PubMed] [Google Scholar]
- Rudrauf D, Douiri A, Kovach C, Lachaux JP, Cosmelli D, Chavez M, Adam C, Renault B, Martinerie J, Le Van Quyen M. Frequency flows and the time–frequency dynamics of multivariate phase synchronization in brain signals. Neuroimage. 2006;31:209–227. doi: 10.1016/j.neuroimage.2005.11.021. [DOI] [PubMed] [Google Scholar]
- Schevon CA, Cappell J, Emerson R, Isler J, Grieve P, Goodman R, McKhann G, Weiner H, Doyle W, et al. Cortical abnormalities in epilepsy revealed by local EEG synchrony. Neuroimage. 2007;35:140–148. doi: 10.1016/j.neuroimage.2006.11.009. [DOI] [PMC free article] [PubMed] [Google Scholar]
- Schevon CA, Ng SK, Cappell J, Goodman RR, McKhann G, Waziri A, Branner A, Sosunov A, Schroeder CE, Emerson RG. Microphysiology of epileptiform activity in human neocortex. J Clin Neurophysiol. 2008;25:321–330. doi: 10.1097/WNP.0b013e31818e8010. [DOI] [PMC free article] [PubMed] [Google Scholar]
- Schevon CA, Trevelyan AJ, Schroeder CE, Goodman RR, McKhann G, Emerson RG. Spatial characterization of interictal high frequency oscillations in epileptic neocortex. Brain. 2009;132:3047–3059. doi: 10.1093/brain/awp222. [DOI] [PMC free article] [PubMed] [Google Scholar]
- Schroeder CE, Lakatos P. Low-frequency neuronal oscillations as instruments of sensory selection. Trends Neurosci. 2009;32:9–18. doi: 10.1016/j.tins.2008.09.012. [DOI] [PMC free article] [PubMed] [Google Scholar]
- Schwartz TH. Optical imaging of epileptiform events in visual cortex in response to patterned photic stimulation. Cereb Cortex. 2003;13:1287–1298. doi: 10.1093/cercor/bhg076. [DOI] [PubMed] [Google Scholar]
- Schwindt W, Nicholson C, Lehmenkuhler A. Critical volume of rat cortex and extracellular threshold concentration for a pentylenetetrazol-induced epileptic focus. Brain Res. 1997;753:86–97. doi: 10.1016/s0006-8993(96)01495-3. [DOI] [PubMed] [Google Scholar]
- Singer W. Neuronal synchrony: a versatile code for the definition of relations? Neuron. 1999;24:49–65. doi: 10.1016/s0896-6273(00)80821-1. [DOI] [PubMed] [Google Scholar]
- Staba RJ, Wilson CL, Bragin A, Fried I, Engel JJ. Quantitative analysis of high-frequency oscillations (80–500 Hz) recorded in human epileptic hippocampus and entorhinal cortex. J Neurophysiol. 2002a;88:1743–2152. doi: 10.1152/jn.2002.88.4.1743. [DOI] [PubMed] [Google Scholar]
- Staba RJ, Wilson CL, Bragin A, Fried I, Engel JJ. Sleep states differentiate single neuron activity recorded from human epileptic hippocampus, entorhinal cortex, and subiculum. J Neurosci. 2002b;22:5694–5704. doi: 10.1523/JNEUROSCI.22-13-05694.2002. [DOI] [PMC free article] [PubMed] [Google Scholar]
- Stead M, Bower M, Brinkmann BH, Lee K, Marsh WR, Meyer FB, Litt B, Van Gompel J, Worrell GA. Microseizures and the spatiotemporal scales of human partial epilepsy. Brain. 2010;133:2789–2797. doi: 10.1093/brain/awq190. [DOI] [PMC free article] [PubMed] [Google Scholar]
- Swartz BE, Goldensohn ES. Timeline of the history of EEG and associated fields. Electroencephalogr Clin Neurophysiol. 1998;106:173–176. [PubMed] [Google Scholar]
- Tallon-Baudry C, Bertrand O. Oscillatory gamma activity in humans and its role in object representation. Trends Cogn Sci. 1999;3:151–162. doi: 10.1016/s1364-6613(99)01299-1. [DOI] [PubMed] [Google Scholar]
- Tallon-Baudry C, Bertrand O, Delpuech C, Pernier J. Stimulus specificity of phase-locked and non-phase-locked 40 Hz visual responses in human. J Neurosci. 1996;16:4240–4249. doi: 10.1523/JNEUROSCI.16-13-04240.1996. [DOI] [PMC free article] [PubMed] [Google Scholar]
- Tao JX, Ray A, Hawes-Ebersole S, Ebersole JS. Intracranial EEG substrates of scalp EEG interictal spikes. Epilepsia. 2005;46:669–676. doi: 10.1111/j.1528-1167.2005.11404.x. [DOI] [PubMed] [Google Scholar]
- Teixeira CA, Direito B, Feldwisch-Drentrup H, Valderrama M, Costa RP, Alvarado-Rojas C, Nikolopoulos S, Le Van Quyen M, Timmer J, Schelter B, Dourado A. EPILAB: a software package for studies on the prediction of epileptic seizures. J Neurosci Methods. 2011;15 (200):257–271. doi: 10.1016/j.jneumeth.2011.07.002. [DOI] [PubMed] [Google Scholar]
- Telenczuk B, Baker SN, Herz AV, Curio G. High-frequency EEG covaries with spike burst patterns detected in cortical neurons. J Neurophysiol. 2011;105:2951–2959. doi: 10.1152/jn.00327.2010. [DOI] [PMC free article] [PubMed] [Google Scholar]
- Tort AB, Komorowski R, Eichenbaum H, Kopell N. Measuring phase-amplitude coupling between neuronal oscillations of different frequencies. J Neurophysiol. 2010;104:1195–1210. doi: 10.1152/jn.00106.2010. [DOI] [PMC free article] [PubMed] [Google Scholar]
- Traub RD, Whittington MA, Buhl EH, LeBeau FE, Bibbig A, Boyd S, Cross H, Baldeweg T. A possible role for gap junctions in generation of very fast EEG oscillations preceding the onset of, and perhaps initiating, seizures. Epilepsia. 2001;42:153–170. doi: 10.1046/j.1528-1157.2001.26900.x. [DOI] [PubMed] [Google Scholar]
- Truccolo W, Donoghue JA, Hochberg LR, Eskandar EN, Madsen JR, Anderson WS, Brown EN, Halgren E, Cash SS. Single-neuron dynamics in human focal epilepsy. Nat Neurosci. 2011;14:635–641. doi: 10.1038/nn.2782. [DOI] [PMC free article] [PubMed] [Google Scholar]
- Trujillo LT, Peterson MA, Kaszniak AW, Allen JJ. EEG phase synchrony differences across visual perception conditions may depend on recording and analysis methods. Clin Neurophysiol. 2005;116:172–189. doi: 10.1016/j.clinph.2004.07.025. [DOI] [PubMed] [Google Scholar]
- Uhlhaas PJ, Singer W. Neural synchrony in brain disorders: relevance for cognitive dysfunctions and pathophysiology. Neuron. 2006;52:155–168. doi: 10.1016/j.neuron.2006.09.020. [DOI] [PubMed] [Google Scholar]
- Ulbert I, Heit G, Madsen J, Karmos G, Halgren E. Laminar analysis of human neocortical interictal spike generation and propagation: current source density and multiunit analysis in vivo. Epilepsia. 2004a;45 (Suppl 4):48–56. doi: 10.1111/j.0013-9580.2004.04011.x. [DOI] [PubMed] [Google Scholar]
- Ulbert I, Magloczky Z, Eross L, Czirjak S, Vajda J, Bognar L, Toth S, Szabo Z, Halasz P, et al. In vivo laminar electrophysiology co-registered with histology in the hippocampus of patients with temporal lobe epilepsy. Exp Neurol. 2004b;187:310–318. doi: 10.1016/j.expneurol.2003.12.003. [DOI] [PubMed] [Google Scholar]
- Urrestarazu E, Chander R, Dubeau F, Gotman J. Interictal high-frequency oscillations (100–500 Hz) in the intracerebral EEG of epileptic patients. Brain. 2007;130:2354–2366. doi: 10.1093/brain/awm149. [DOI] [PubMed] [Google Scholar]
- Urrestarazu E, Jirsch JD, LeVan P, Hall J, Avoli M, Dubeau F, Gotman J. High-frequency intracerebral EEG activity (100–500 Hz) following interictal spikes. Epilepsia. 2006;47:1465–1476. doi: 10.1111/j.1528-1167.2006.00618.x. [DOI] [PubMed] [Google Scholar]
- Van Gompel JJ, Stead SM, Giannini C, Meyer FB, Marsh WR, Fountain T, So E, Cohen-Gadol A, Lee KH, Worrell GA. Phase I trial: safety and feasibility of intracranial electroencephalography using hybrid subdural electrodes containing macro- and microelectrode arrays. Neurosurg Focus. 2008a;25:E23. doi: 10.3171/FOC/2008/25/9/E23. [DOI] [PMC free article] [PubMed] [Google Scholar]
- Van Gompel JJ, Worrell GA, Bell ML, Patrick TA, Cascino GD, Raffel C, Marsh WR, Meyer FB. Intracranial electroencephalography with subdural grid electrodes: techniques, complications, and outcomes. Neurosurgery. 2008b;63:498–505. doi: 10.1227/01.NEU.0000324996.37228.F8. (discussion 505–506) [DOI] [PubMed] [Google Scholar]
- Vanhatalo S, Palva JM, Holmes MD, Miller JW, Voipio J, Kaila K. Infraslow oscillations modulate excitability and interictal epileptic activity in the human cortex during sleep. Proc Natl Acad Sci USA. 2004;101:5053–5057. doi: 10.1073/pnas.0305375101. [DOI] [PMC free article] [PubMed] [Google Scholar]
- Vanhatalo S, Voipio J, Kaila K. Full-band EEG (FbEEG): an emerging standard in electroencephalography. Clin Neurophysiol. 2005;116:1–8. doi: 10.1016/j.clinph.2004.09.015. [DOI] [PubMed] [Google Scholar]
- Varela F, Lachaux JP, Rodriguez E, Martinerie J. The brainweb: phase synchronization and large-scale integration. Nat Rev Neurosci. 2001;2:229–239. doi: 10.1038/35067550. [DOI] [PubMed] [Google Scholar]
- Viola P, Jones M. Rapid object detection using a boosted cascade of simple features. IEEE Comput Soc Conf Comput Vis Pattern Recog. 2001;1:511. [Google Scholar]
- Viventi J, Kim DH, Moss JD, Kim YS, Blanco JA, Annetta N, Hicks A, Xiao J, Huang Y, et al. A conformal, bio-interfaced class of silicon electronics for mapping cardiac electrophysiology. Sci Transl Med. 2010;2:24ra22. doi: 10.1126/scitranslmed.3000738. [DOI] [PMC free article] [PubMed] [Google Scholar]
- von Ellenrieder N, Andrade-Valença LP, Dubeau F, Gotman J. Automatic detection of fast oscillations (40–200 Hz) in scalp EEG recordings. Clin Neurophysiol. 2012;123:670–680. doi: 10.1016/j.clinph.2011.07.050. [DOI] [PMC free article] [PubMed] [Google Scholar]
- von der Malsburg C. The what and why of binding: the modeler’s perspective. Neuron. 1999;24:95–104. 111–125. doi: 10.1016/s0896-6273(00)80825-9. [DOI] [PubMed] [Google Scholar]
- Vulliemoz S, Carmichael DW, Rosenkranz K, Diehl B, Rodionov R, Walker MC, McEvoy AW, Lemieux L. Simultaneous intracranial EEG and fMRI of interictal epileptic discharges in humans. Neuroimage. 2011;54:182–190. doi: 10.1016/j.neuroimage.2010.08.004. [DOI] [PubMed] [Google Scholar]
- Warren CP, Hu S, Stead M, Brinkmann BH, Bower MR, Worrell GA. Synchrony in normal and focal epileptic brain: the seizure onset zone is functionally disconnected. J Neurophysiol. 2010;104:3530–3539. doi: 10.1152/jn.00368.2010. [DOI] [PMC free article] [PubMed] [Google Scholar]
- Whitmer D, Worrell G, Stead M, Lee IK, Makeig S. Utility of independent component analysis for interpretation of intracranial EEG. Front Hum Neurosci. 2010;4:184. doi: 10.3389/fnhum.2010.00184. [DOI] [PMC free article] [PubMed] [Google Scholar]
- Worrell G, Gotman J. High-frequency oscillations and other electrophysiological biomarkers of epilepsy: clinical studies. Biomarkers Med. 2011;5:557–566. doi: 10.2217/bmm.11.74. [DOI] [PMC free article] [PubMed] [Google Scholar]
- Worrell GA, Gardner AB, Stead SM, Hu S, Goerss S, Cascino GJ, Meyer FB, Marsh R, Litt B. High-frequency oscillations in human temporal lobe: simultaneous microwire and clinical macroelectrode recordings. Brain. 2008;131:928–937. doi: 10.1093/brain/awn006. [DOI] [PMC free article] [PubMed] [Google Scholar]
- Worrell GA, Parish L, Cranstoun SD, Jonas R, Baltuch G, Litt B. High-frequency oscillations and seizure generation in neocortical epilepsy. Brain. 2004;127:1496–1506. doi: 10.1093/brain/awh149. [DOI] [PubMed] [Google Scholar]
- Wu JY, Koh S, Sankar R, Mathern GW. Paroxysmal fast activity: an interictal scalp EEG marker of epileptogenesis in children. Epilepsy Res. 2008;82:99–106. doi: 10.1016/j.eplepsyres.2008.07.010. [DOI] [PMC free article] [PubMed] [Google Scholar]
- Wu JY, Sankar R, Lerner JT, Matsumoto JH, Vinters HV, Mathern GW. Removing interictal fast ripples on electrocorticography linked with seizure freedom in children. Neurology. 2010;75:1686–1694. doi: 10.1212/WNL.0b013e3181fc27d0. [DOI] [PMC free article] [PubMed] [Google Scholar]
- Wyart V, Tallon-Baudry C. Neural dissociation between visual awareness and spatial attention. J Neurosci. 2008;28:2667–2679. doi: 10.1523/JNEUROSCI.4748-07.2008. [DOI] [PMC free article] [PubMed] [Google Scholar]
- Wyler AR, Ojemann GA, Ward AA. Neurons in human epileptic cortex: correlation between unit and EEG activity. Ann Neurol. 1982;11:301–308. doi: 10.1002/ana.410110311. [DOI] [PubMed] [Google Scholar]
- Yuval-Greenberg S, Tomer O, Keren AS, Nelken I, Deouell LY. Transient induced gamma-band response in EEG as a manifestation of miniature saccades. Neuron. 2008;58:429–441. doi: 10.1016/j.neuron.2008.03.027. [DOI] [PubMed] [Google Scholar]
- Zaveri HP, Pincus SM, Goncharova II, Duckrow RB, Spencer DD, Spencer SS. Localization-related epilepsy exhibits significant connectivity away from the seizure-onset area. Neuroreport. 2009;20:891–895. doi: 10.1097/WNR.0b013e32832c78e0. [DOI] [PubMed] [Google Scholar]
- Zelmann R, Mari F, Jacobs J, Zijlmans M, Chander R, Gotman J. Automatic detector of high frequency oscillations for human recordings with macroelectrodes. Conf Proc IEEE Eng Med Biol Soc. 2010:2329–2333. doi: 10.1109/IEMBS.2010.5627464. [DOI] [PMC free article] [PubMed] [Google Scholar]
- Zelmann R, Mari F, Jacobs J, Zijlmans M, Dubeau F, Gotman J. A comparison between detectors of high frequency oscillations. Clin Neurophysiol. 2011;123:106–116. doi: 10.1016/j.clinph.2011.06.006. [DOI] [PMC free article] [PubMed] [Google Scholar]
- Zerouali Y, Herry C, Jemel B, Lina J-M. Localization of synchronous cortical neural sources. IEEE Trans Biomed Eng. 2011 doi: 10.1109/TBME.2011.2176938. in press. [DOI] [PubMed] [Google Scholar]
- Zelmann R, Zijlmans M, Jacobs J, Châtillon CE, Gotman J. Improving the identification of high frequency oscillations. Clin Neurophysiol. 2009;120:1457–1464. doi: 10.1016/j.clinph.2009.05.029. [DOI] [PMC free article] [PubMed] [Google Scholar]
- Zijlmans M, Jacobs J, Kahn YU, Zelmann R, Dubeau F, Gotman J. Ictal and interictal high frequency oscillations in patients with focal epilepsy. Clin Neurophysiol. 2011;122:664–671. doi: 10.1016/j.clinph.2010.09.021. [DOI] [PMC free article] [PubMed] [Google Scholar]