Abstract
PURPOSE
Cancer screening programs have the potential of intended beneficial effects, but they also inevitably have unintended harmful effects. In the case of screening mammography, the most frequent harm is a false-positive result. Prior efforts to measure their psychosocial consequences have been limited by short-term follow-up, the use of generic survey instruments, and the lack of a relevant benchmark—women with breast cancer.
METHODS
In this cohort study with a 3-year follow-up, we recruited 454 women with abnormal findings in screening mammography over a 1-year period. For each woman with an abnormal finding on a screening mammogram (false and true positives), we recruited another 2 women with normal screening results who were screened the same day at the same clinic. These participants were asked to complete the Consequences of Screening in Breast Cancer—a validated questionnaire encompassing 12 psychosocial outcomes—at baseline, 1, 6, 18, and 36 months.
RESULTS
Six months after final diagnosis, women with false-positive findings reported changes in existential values and inner calmness as great as those reported by women with a diagnosis of breast cancer (Δ = 1.15; P = .015; and Δ = 0.13; P = .423, respectively). Three years after being declared free of cancer, women with false-positive results consistently reported greater negative psychosocial consequences compared with women who had normal findings in all 12 psychosocial outcomes (Δ >0 for 12 of 12 outcomes; P <.01 for 4 of 12 outcomes).
CONCLUSION
False-positive findings on screening mammography causes long-term psychosocial harm: 3 years after a false-positive finding, women experience psychosocial consequences that range between those experienced by women with a normal mammogram and those with a diagnosis of breast cancer.
Key words: mass screening, breast cancer, false-positive reactions/adverse effects
INTRODUCTION
Screening for cancer has the potential for intended beneficial effects, with the reduction on cancer mortality as the most important.1 Inevitably, however, screening for cancer also has unintended harmful effects, primarily caused by the consequences of detecting inconsequential cancer and false-positive results.1 For cancer screening, including screening mammography, this balance between benefits and harms is delicate.2 Some women who attend mammography screening will avoid dying from breast cancer or receive less aggressive treatment.3 Others will have a condition overdiagnosed or receive a false-positive test result (hereafter referred to as false positive), and thus have traumatic experiences and receive unnecessary testing and/or treatment.3
The most frequent harm in breast screening is having a finding that is a false positive. The risk of having false positives differs greatly from one country to another. The cumulative risk in Europe and the United States of false positives in 10 screening rounds ranges from 20% to 60%.4–10
In the last 20 years, numerous quantitative studies have been published measuring psychological and social aspects related to screening mammography.11 The conclusion is that false positives have negative short-term psychosocial consequences, but the long-term psychosocial consequences are ambiguous.12 Some studies show substantial negative psychosocial consequences, even 35 months after a false positive.13 Others have found that the negative psychosocial impact disappears with time.14–16 These surveys, however, were performed using inadequate measures.12 The questionnaires used were generic and lacked content validity: the actual experiences of women with false positives, after they received additional examinations and were declared free of breast cancer, were not measured.17 Focus-group interviews with women with false positives have revealed that the women’s experiences during the critical period from being told the initial abnormal finding to the final false-positive diagnosis are different from their experiences after the final diagnosis.17 A survey on psychosocial long-term consequences of false positives therefore needs to include a measure with 2 parts: a first part that is completed at all the survey assessment points from the critical period encompassing the psychosocial consequences that are associated with a direct threat of breast cancer; and a second part that encompasses the long-term psychosocial changes experienced after the final diagnostic result.17 To our knowledge such a survey has never been conducted.
The aim of this study, performed among women with and without abnormal findings on screening mammograms and who were and were not diagnosed with a subsequent breast cancer, was to measure the long-term psychosocial consequences of false-positive findings on screening mammography for a 3-year follow-up period using a condition-specific questionnaire with high content validity and adequate psychometric properties.
METHODS
Study Population and Survey Administration
In Denmark all women aged 50 to 69 years are invited via public databases to biannual breast screening.18 From June 3, 2004, to June 2, 2005, women with abnormal findings from 2 of the publicly financed screening mammography programs (Copenhagen and Funen), accounting for about 20% of the total screened population, were consecutively recruited to participate in the study.18 In the Copenhagen program approximately 10,000 women were screened of whom 230 were recalled for additional testing because of abnormal results19; in the Funen program approximately 20,000 were screened and 360 recalled.20
All women with an abnormal screening results were asked to participate in the survey when they attended the recall clinic. Those agreeing to participate completed part I of the Consequences of Screening in Breast Cancer (COS-BC) questionnaire17,21 before they had any additional examinations. For each participant with abnormal findings on screening mammography, another 2 women with normal findings who were screened the same day and at the same screening clinic as the woman with the abnormal result were mailed and asked to complete part I of the COS-BC questionnaire 1 week after receiving the letter reporting the normal result.
All recruited women were mailed and asked to complete the COS-BC questionnaire17,21,22 at 4 follow-up time points: 1, 6, 18, and 36 months after their final diagnosis (true or false positive) or their normal screening result. The women were asked to return the completed questionnaire in an enclosed stamped addressed envelope. A reminder was posted within 2 weeks.
Questionnaire
The COS-BC is a multidimensional condition-specific questionnaire, with 29 items in part I and 13 items in part II, measuring psychosocial consequences of abnormal and false-positive screening mammography.17,21,22 In a previous qualitative study, the content validity of the measure was confirmed by conducting focus group and individual interviews with women with false-positive findings.17,22 Furthermore, the psychometric properties of the questionnaire were tested in previous cohort studies using the partial credit Rasch model for polytomous items.21,22
Part I encompasses 2 single items (“felt less attractive” and “busy to take my mind off things”) and 6 scales measuring anxiety (6 items), sense of dejection (6 items), negative impact on behavior (7 items), sleep (4 items), sexuality (2 items), and degree of breast selfexamination (2 items).21 All items in the 8 psychosocial outcomes in part I have 4 response categories: “not at all,” “a bit,” “quite a bit,” and “a lot.” The higher the score, the greater negative psychosocial consequences the person has experienced.17,21,22
Part II of the COS-BC encompasses 4 scales designed to measure perceived changes as a result of mammographic screening: existential values (6 items: for example, “my thoughts about the future are more pessimistic/optimistic”; “my sense of well-being is less/ more”); impact on relationships within social network (3 items: for example, “my relationship with friends/ family is less/more close“; “my relationship with other people is worse/better”); feeling less or more relaxed/ calm (2 items); and being less or more anxious about breast cancer/”believing that I do not have having breast cancer” (2 items).17,22 All items in these scales have 5 response categories: “much less,” “less,” “the same as before,” “more,” and “much more.”
It is well known that a person’s values and perceptions of life can change as a result of trauma and existential crisis. These changes can be interpreted by the individual as positive, negative, or a combination of both. Therefore, part II of the COS-BC requires a laterally reversed scoring system: a response to “the same as before” becomes a value of “no change;” a response to “less” or “more” becomes a value of “minor change;” and a response to “much less” or “much more” becomes a value of “major change.”17,22,23 The 4 sum-scores of part II reflect the degree of changes in the 4 long-term psychosocial outcomes, respectively. A high score in part II denotes that the individual is highly psychosocially affected, irrespective of this experience being positive or negative.22,23
The items in the 10 scales of the COS-BC have been found invariant in relation to time by testing the items for differential item functioning.24 Such testing ensures that repeated measurement in a longitudinal survey would be invariant, so that any change over time would be an actual change and not due to differential item functioning.21,22,24
Apart from the 12 psychosocial outcomes in the COS-BC, information was obtained about age, employment status, social class, and whether the woman was living alone.
Statistics
If one or more items in a scale were not completed, or if a single item was not completed, then the scale or the single item was set as missing, and they were not included in the primary statistical analyses. In the 2-item scale of sexuality, the respondents could also reply “not applicable” to both items. If so, the responses from these respondents were also set to missing.
We analyzed the differences in baseline covariates between the 3 screening groups (true positive, false positive, and normal) using ÷2 tests for categorical variables and Wilcoxon signed rank test for continuous variables.
For each of the 10 scales and the 2 single items measuring psychosocial consequences, the developments of the mean score for each of the 3 screening groups over the follow-up time points were analyzed in linear regression models, both unadjusted and adjusted for the baseline covariates: living alone, employment status, social class, and (a quadratic function of) age. We used generalized estimating equations methods to account for repeated measurement on the same individual.25 To adjust for possible bias resulting from differential dropout from the study, the scores available at each follow-up time point were weighted by the inverse of an estimate of the probability of this score being observed at that time point.26,27 These probabilities were estimated from the data in logistic regression models for the psychosocial outcome being missing, with the baseline covariates, the screening outcome groups, and the observed scores of the appropriate psychosocial outcome from previous visits as independent variables.
A statistical significance level of P <.01 was used to avoid type 1 error caused by multiplicity.
The study was approved by the Danish Data Protection Agency, 2007–41–0777. An approval from the ethics committee was not required.
RESULTS
Participation in the study and the distribution of screening results and final diagnosis among the participants and these women’s response rates are displayed in Figure 1. One hundred thirty-six (23.1%) women with abnormal findings did not participate in the study, mostly because of lack of invitation caused by sick leave and holiday among the clinic staff, but some women refused to participate. Eight of the 454 participants with abnormal findings were excluded; 3 because they had cancers other than breast cancer diagnosed, and 5 because their final diagnosis after an abnormal screening mammography was unknown.
Figure 1.
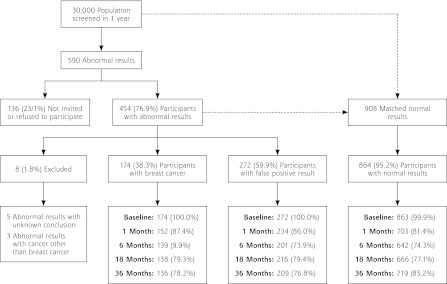
The distribution of screening results and final diagnosis among the eligible women and these women’s response rates at 5 time points: baseline, 1, 6, 18, and 36 months.
We found no significant differences between the 3 screening groups in relation to social status, employment, and whether they lived alone (Table 1). The significant differences in relation to age-group were expected: the younger the woman, the greater the possibility for false positives because of denser breast tissue; the older the woman, the greater the possibility of a diagnosis of breast cancer because of the natural history of the disease.
Table 1.
Baseline Characteristics of the Screened Population
| Screening Result
|
|||||
|---|---|---|---|---|---|
| Characteristic | Total No. (%) | Normal No. (%) | False-Positive No. (%) | Breast Cancer No. (%)) | P Value |
| Participants, No. | 1,310 | 864 | 272 | 174 | |
| Age, ya | |||||
| 50–54 | 367 (28.0) | 217 (25.1) | 112 (41.2) | 38 (21.8) | <.001 |
| 55–59 | 415 (31.7) | 310 (35.9) | 66 (24.3) | 39 (22.4) | |
| 60–64 | 303 (23.1) | 210 (24.3) | 48 (17.7) | 45 (25.9) | |
| ≥65 | 225 (17.2) | 127 (14.7) | 46 (16.9) | 52 (29.9) | |
| Living alone, No. | 847 | 264 | 168 | ||
| No | 922 (72.1) | 611 (72.1) | 186 (70.5) | 125 (74.4) | .671 |
| Yes | 357 (27.9) | 236 (27.9) | 78 (29.5) | 43 (25.6) | |
| Employment, No. | 845 | 264 | 168 | ||
| Workingb | 696 (54.5) | 467 (55.3) | 147 (55.7) | 82 (48.8) | .298 |
| Unemployed | 51 (4.0) | 38 (4.5) | 8 (3.0) | 5 (3.0) | |
| Pensioned | 530 (41.5) | 340 (40.2) | 109 (41.3) | 81 (48.2) | |
| Social status, No. | 847 | 263 | 168 | ||
| I | 42 (3.3) | 32 (3.8) | 5 (1.9) | 5 (3.0) | .398 |
| II | 188 (14.7) | 128 (15.1) | 41 (15.6) | 19 (11.3) | |
| III | 251 (19.6) | 165 (19.5) | 53 (20.2) | 33 (19.6) | |
| IV | 461 (36.1) | 312 (36.8) | 94 (35.7) | 55 (32.7) | |
| V | 336 (26.3) | 210 (24.8) | 70 (26.6) | 56 (33.3) | |
Mean and interquartile range for total = 58.6 y (54.4–63.3 y), normal = 58.7 y (55.0–62.7 y), false positive = 57.1 y (53.2–62.4 y), and breast cancer = 61.0 y (55.8–66.0 y).
Includes 5 students.
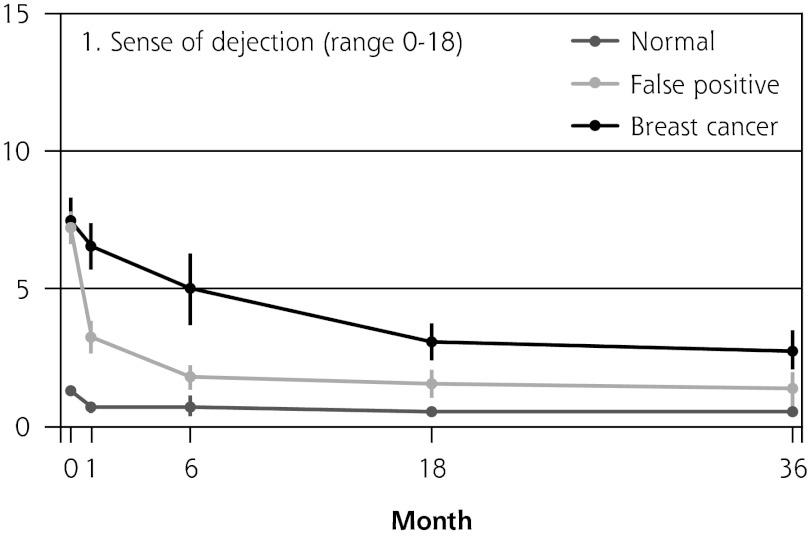
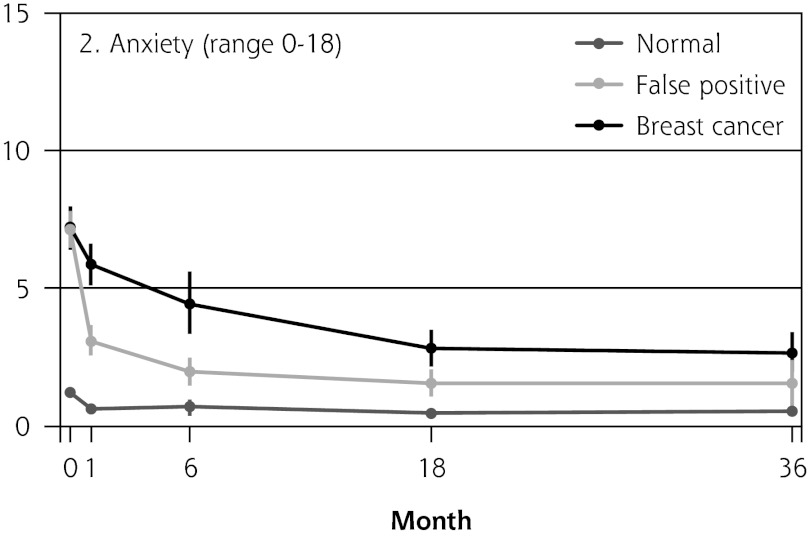
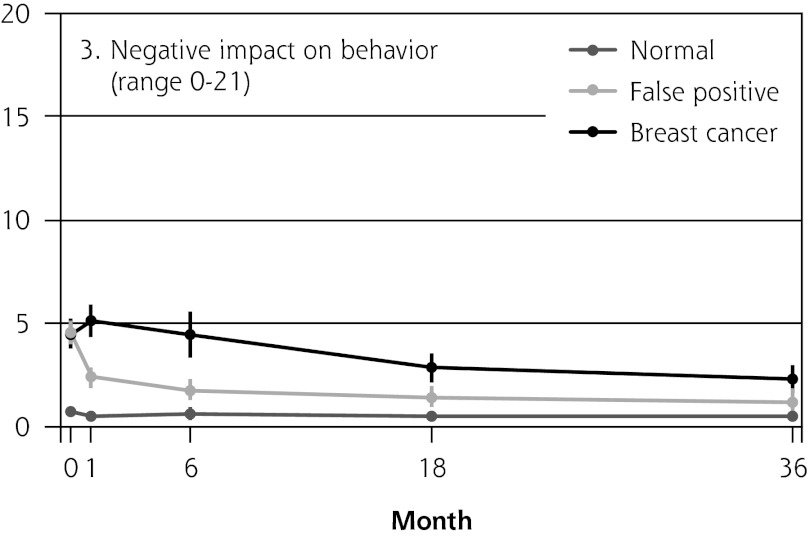
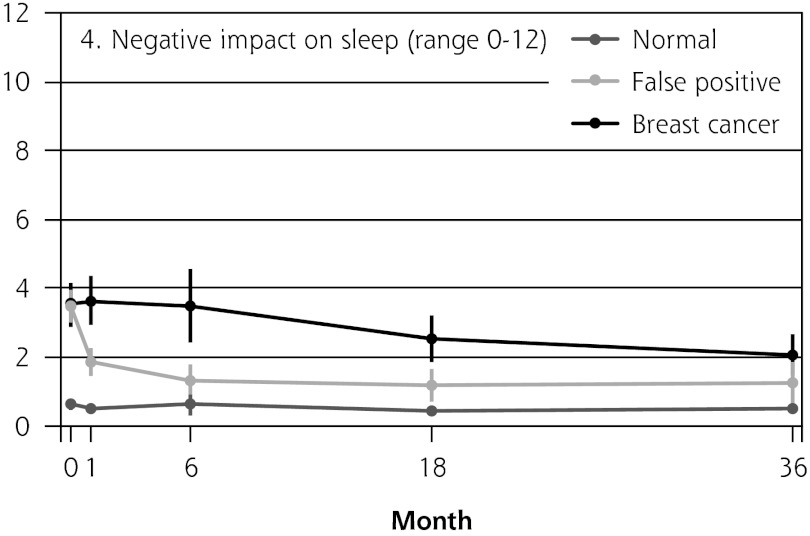
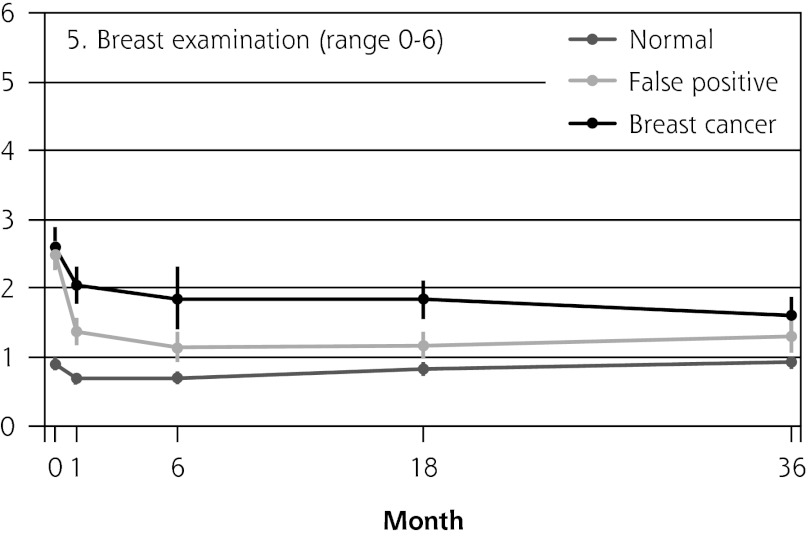
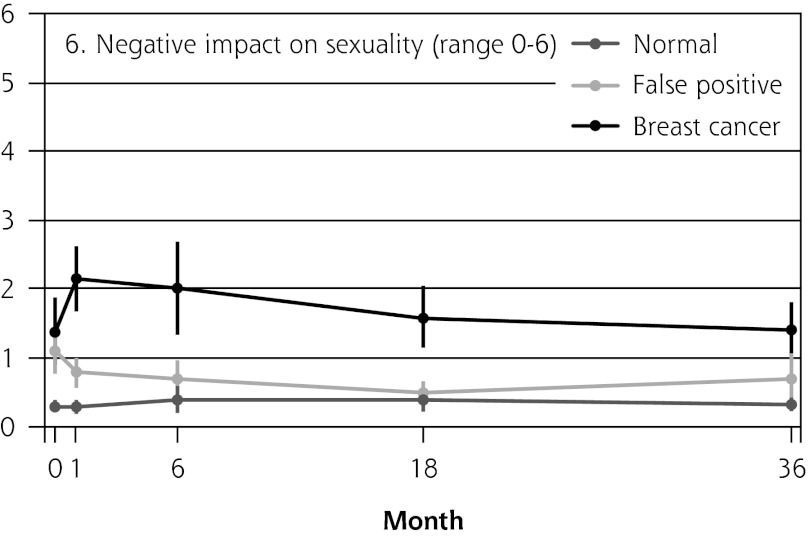
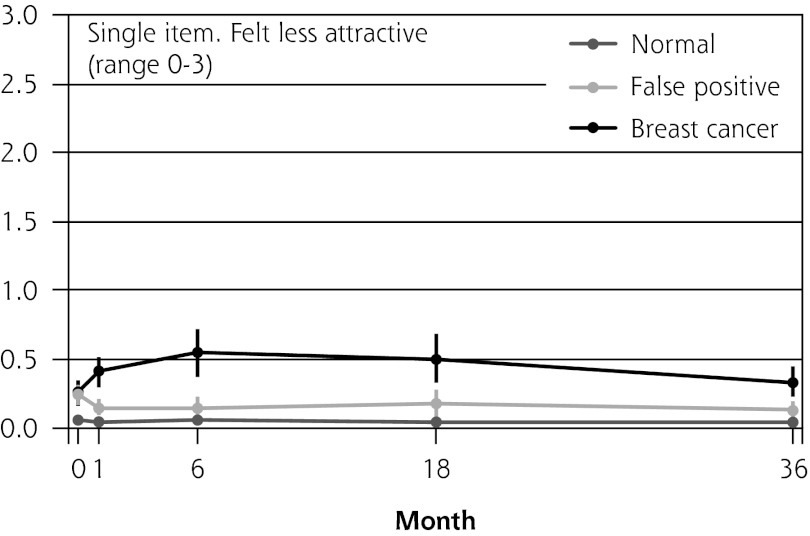
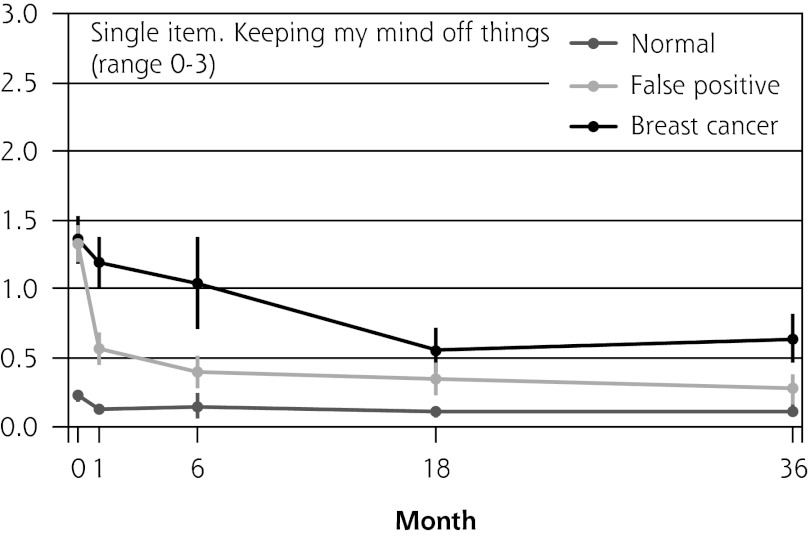
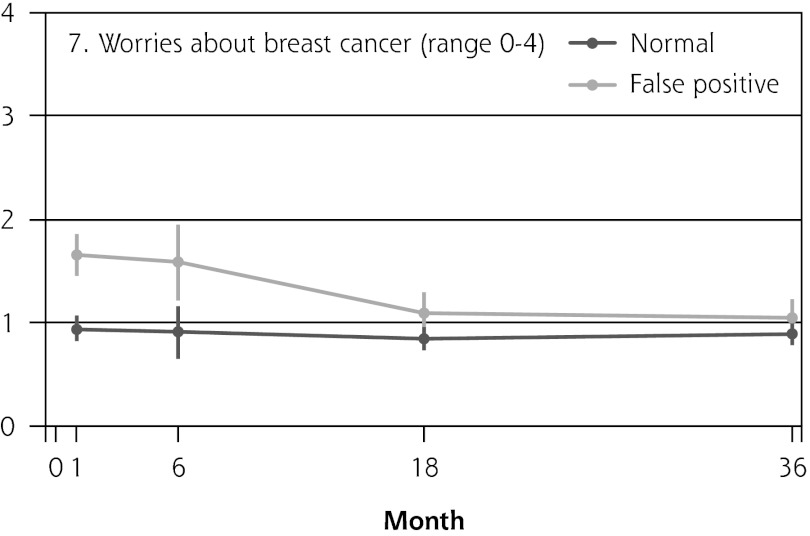
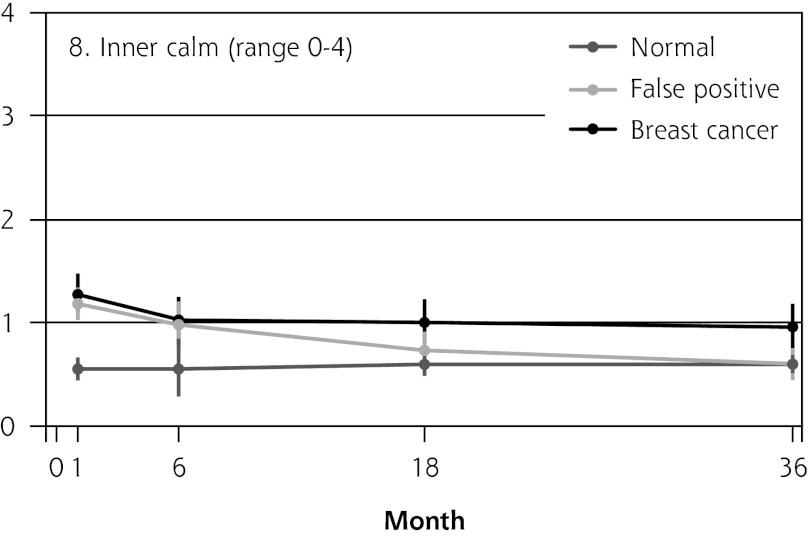
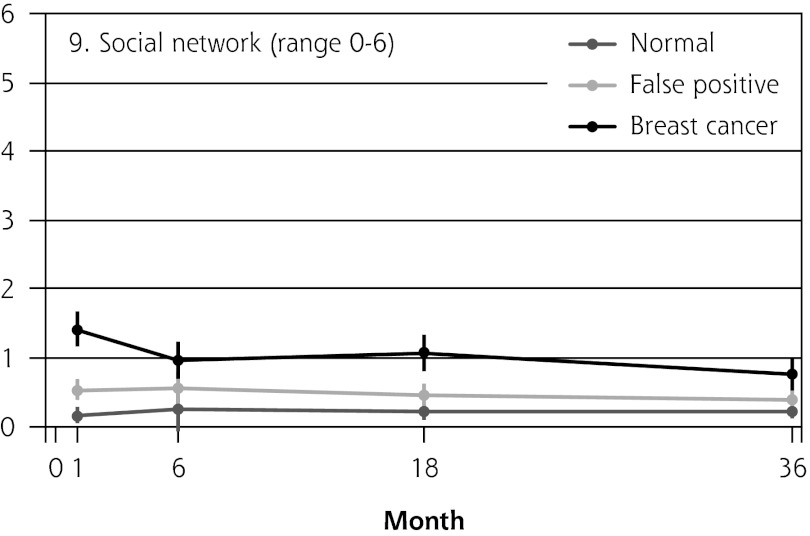
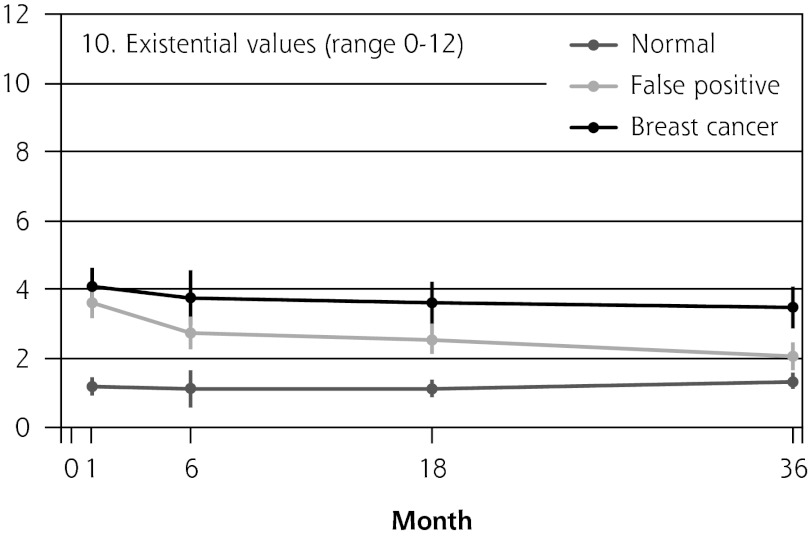
Figure 2 shows the mean score of each of the 8 psychosocial outcomes in part I of the COS-BC for the 3 screening groups at each measurement period. Figure 3 shows the mean score of each of the 4 psychosocial outcomes in part II. The patterns of development of the mean outcomes are seen to be similar among all 12 psychosocial outcomes after the critical period from learning the initial finding to the final diagnosis.
Figure 2.
The mean score of each of the 8 psychosocial outcomes, part I of the COS-BC for the 3 screening groups at 5 time points: 0, 1, 6, 18, and 36 months.
COS-BC = Consequences of Screening in Breast Cancer.
Figure 3.
The mean score of each of the 4 psychosocial outcomes, part II of the COS-BC for 2 or 3 of the screening groups at 4 time points: 1, 6, 18, and 36 months.
COS-BC = Consequences of Screening in Breast Cancer.
Table 2 shows the mean differences in the 12 outcomes, adjusted for baseline covariates, between the 3 screening groups at each measurement round.
Table 2.
Adjusted Analyses of Psychosocial Consequences of Breast Cancer Screening: Estimated Mean Differences Between Each Pair of 3 Diagnosis Groups.
| Follow-up Time
|
Follow-up Time
|
||||||||||
|---|---|---|---|---|---|---|---|---|---|---|---|
| 0 Months
|
1 Month
|
6 Months
|
18 Months
|
36 Months
|
|||||||
| Scale (Range) | Differencea | Mean Δ (95% CI) | P Value | Mean Δ (95% CI) | P Value | Mean Δ (95% CI) | P Value | Mean Δ (95% CI) | P Value | Mean Δ (95% CI) | P Value |
| 1. Sense of dejection (0–18) | Normal →→ breast cancer | 6.34 (5.52 to 7.17) | <.001 | 4.09 (2.88 to 5.30) | <.001 | 2.54 (1.86 to 3.22) | <.001 | 2.18 (1.47 to 2.88) | <.001 | 5.91 (5.08 to 6.75) | <.001 |
| Normal → false p ositive | 5.91 (5.27 to 6.55) | <.001 | 0.83 (0.23 to 1.43) | .007 | 0.88 (0.39 to 1.36) | <.001 | 0.69 (0.16 to 1.21) | .011 | 2.45 (1.89 to 3.02) | <.001 | |
| False positive → breast cancer | 0.43 (−0.58 to 1.44) | .401 | 3.26 (2.05 to 4.47) | <.001 | 1.66 (0.86 to 2.47) | <.001 | 1.49 (0.63 to 2.35) | .001 | 3.46 (2.49 to 4.43) | <.001 | |
| No. responding | 1, 270 | 942 | 993 | 1,042 | 1,034 | ||||||
| 2. Anxiety (0–18) | Normal → breast cancer | 6.17 (5.35 to 7.00) | <.001 | 3.68 (2.59 to 4.77) | <.001 | 2.38 (1.67 to 3.09) | <.001 | 2.19 (1.51 to 2.88) | <.001 | 5.35 (4.57 to 6.13) | <.001 |
| Normal → false positive | 5.83 (5.17 to 6.49) | <.001 | 1.08 (0.50 to 1.66) | <.001 | 0.95 (0.47 to 1.43) | <.001 | 0.87 (0.17 to 1.56) | .014 | 2.39 (1.84 to 2.94) | <.001 | |
| False positive → breast cancer | 0.34 (−0.68 to 1.37) | .510 | 2.60 (1.47 to 3.72) | <.001 | 1.43 (0.60 to 2.26) | .001 | 1.33 (0.37 to 2.28) | .007 | 2.96 (2.03 to 3.89) | <.001 | |
| No. responding | 1, 244 | 930 | 987 | 1,032 | 1,029 | ||||||
| 3. Negative impact on behavior (0–21) | Normal → breast cancer | 3.99 (3.26 to 4.73) | <.001 | 3.76 (2.73 to 4.79) | <.001 | 2.31 (1.59 to 3.03) | <.001 | 1.79 (1.13 to 2.46) | <.001 | 4.87 (4.10 to 5.63) | <.001 |
| Normal → false positive | 3.70 (3.12 to 4.28) | <.001 | 0.89 (0.30 to 1.49) | .003 | 0.85 (0.35 to 1.36) | .001 | 0.60 (−0.01 to 1.20) | .054 | 1.75 (1.24 to 2.25) | <.001 | |
| False positive → breast cancer | 0.29 (−0.61 to 1.20) | .527 | 2.87 (1.73 to 4.01) | <.001 | 1.46 (0.58 to 2.34) | .001 | 1.20 (0.31 to 2.08) | .008 | 3.12 (2.24 to 4.00) | <.001 | |
| No. responding | 1,235 | 934 | 985 | 1,038 | 1,025 | ||||||
| 4. Negative impact on sleep (0–12) | Normal → breast cancer | 2.89 (2.26 to 3.52) | <.001 | 2.77 (1.86 to 3.69) | <.001 | 1.99 (1.34 to 2.65) | <.001 | 1.53 (0.99 to 2.06) | <.001 | 3.20 (2.53 to 3.87) | <.001 |
| Normal → false positive | 2.81 (2.33 to 3.30) | <.001 | 0.65 (0.14 to 1.16) | .013 | 0.71 (0.25 to 1.17) | .003 | 0.71 (0.17 to 1.25) | .010 | 1.31 (0.87 to 1.75) | <.001 | |
| False positive → breast cancer | 0.08 (−0.69 to 0.85) | .845 | 2.12 (1.17 to 3.08) | <.001 | 1.29 (0.50 to 2.08) | .001 | 0.82 (0.08 to 1.55) | .029 | 1.89 (1.12 to 2.66) | <.001 | |
| No. responding | 1,257 | 941 | 984 | 1,043 | 1,043 | ||||||
| 5. Breast examination (0–6) | Normal → breast cancer | 1.73 (1.40 to 2.06) | <.001 | 1.13 (0.69 to 1.57) | <.001 | 0.99 (0.69 to 1.30) | <.001 | 0.67 (0.38 to 0.95) | <.001 | 1.37 (1.08 to 1.66) | <.001 |
| Normal → false positive | 1.64 (1.40 to 1.88) | <.001 | 0.46 (0.22 to 0.69) | <.001 | 0.38 (0.17 to 0.60) | .001 | 0.38 (0.14 to 0.62) | .002 | 0.69 (0.47 to 0.90) | <.001 | |
| False positive → breast cancer | 0.10 (−0.29 to 0.48) | .629 | 0.67 (0.21 to 1.14) | .005 | 0.61 (0.27 to 0.95) | <.001 | 0.28 (−0.06 to 0.63) | .106 | 0.68 (0.35 to 1.02) | <.001 | |
| No. responding | 1,28 0 | 942 | 998 | 1,053 | 1,04 4 | ||||||
| 6. Negative impact on sexuality (0–6) | Normal → breast cancer | 1.04 (0.58 to 1.50) | <.001 | 1.55 (1.00 to 2.11) | <.001 | 1.26 (0.80 to 1.72) | <.001 | 1.01 (0.63 to 1.39) | <.001 | 1.97 (1.54 to 2.40) | <.001 |
| Normal → false positive | 0.76 (0.45 to 1.07) | <.001 | 0.26 (−0.09 to 0.61) | .151 | 0.13 (−0.09 to 0.35) | .234 | 0.31 (−0.04 to 0.66) | .086 | 0.50 (0.26 to 0.74) | <.001 | |
| False positive → breast cancer | 0.29 (−0.27 to 0.84) | .316 | 1.29 (0.66 to 1.92) | <.001 | 1.13 (0.65 to 1.61) | <.001 | 0.70 (0.20 to 1.21) | .006 | 1.47 (0.99 to 1.95) | <.001 | |
| No. responding | 992 | 842 | 889 | 939 | 900 | ||||||
| Single item: felt less attractive (0–3) | Normal → breast cancer | 0.20 (0.10 to 0.30) | <.001 | 0.48 (0.32 to 0.65) | <.001 | 0.45 (0.26 to 0.65) | <.001 | 0.29 (0.17 to 0.41) | <.001 | 0.36 (0.24 to 0.48) | <.001 |
| Normal → false positive | 0.17 (0.10 to 0.25) | <.001 | 0.08 (−0.00 to 0.16) | .060 | 0.13 (0.03 to 0.22) | .008 | 0.07 (0.01 to 0.14) | .023 | 0.09 (0.03 to 0.15) | .003 | |
| False positive → breast cancer | 0.03 (−0.10 to 0.15) | .668 | 0.40 (0.22 to 0.58) | <.001 | 0.33 (0.11 to 0.54) | .003 | 0.22 (0.09 to 0.35) | .001 | 0.27 (0.14 to 0.40) | <.001 | |
| No. responding | 1,261 | 941 | 993 | 1,050 | 1,0 42 | ||||||
| Single item: Keeping my mind off things (0–3) | Normal → breast cancer | 1.14 (0.96 to 1.31) | <.001 | 0.84 (0.57 to 1.11) | <.001 | 0.44 (0.28 to 0.60) | <.001 | 0.51 (0.34 to 0.67) | <.001 | 1.07 (0.89 to 1.25) | <.001 |
| Normal → false positive | 1.10 (0.96 to 1.25) | <.001 | 0.21 (0.05 to 0.37) | .010 | 0.23 (0.11 to 0.35) | <.001 | 0.16 (0.04 to 0.27) | .007 | 0.44 (0.32 to 0.57) | <.001 | |
| False positive → breast cancer | 0.04 (−0.18 to 0.26) | .741 | 0.63 (0.34 to 0.92) | <.001 | 0.21 (0.01 to 0.41) | .037 | 0.35 (0.16 to 0.55) | <.001 | 0.63 (0.41 to 0.84) | <.001 | |
| No. responding | 1,292 | 946 | 999 | 1,053 | 1,048 | ||||||
| 7. Worried about breast cancer (0–4) | Normal → breast cancer | NA | NA | NA | NA | NA | |||||
| Normal → false positive | NA | 0.61 (0.30 to 0.92) | <.001 | 0.23 (0.02 to 0.43) | .030 | 0.16 (−0.03 to 0.35) | .099 | 0.69 (0.49 to 0.90) | <.001 | ||
| False positive → breast cancer | NA | NA | NA | NA | NA | ||||||
| No. responding | 0 | 826 | 863 | 912 | 930 | ||||||
| 8. Inner calm (0–4) | Normal → breast cancer | NA | 0.56 (0.28 to 0.84) | <.001 | 0.43 (0.18 to 0.67) | .001 | 0.39 (0.14 to 0.63) | .002 | 0.76 (0.55 to 0.98) | <.001 | |
| Normal → false positive | NA | 0.42 (0.13 to 0.72) | .005 | 0.16 (−0.04 to 0.36) | .115 | 0.03 (−0.16 to 0.21) | .786 | 0.65 (0.46 to 0.84) | <.001 | ||
| False positive → breast cancer | NA | 0.13 (−0.19 to 0.46) | .423 | 0.26 (−0.01 to 0.54) | .063 | 0.36 (0.08 to 0.64) | .012 | 0.11 (−0.14 to 0.37) | .396 | ||
| No. responding | 0 | 974 | 1,014 | 1,056 | 1,085 | ||||||
| 9. Social network (0–6) | Normal → breast cancer | NA | 0.81 (0.50 to 1.12) | <.001 | 0.91 (0.65 to 1.18) | <.001 | 0.58 (0.33 to 0.82) | <.001 | 1.29 (1.02 to 1.56) | <.001 | |
| Normal → false positive | NA | 0.34 (0.04 to 0.64) | .026 | 0.27 (0.09 to 0.46) | .004 | 0.20 (0.04 to 0.40) | .016 | 0.39 (0.22 to 0.57) | <.001 | ||
| False positive → breast cancer | NA | 0.47 (0.14 to 0.81) | .006 | 64 (0.34 to 0.94) | <.001 | 0.38 (0.10 to 0.65) | .007 | 0.90 (0.60 to 1.19) | <.001 | ||
| No. responding | 0 | 967 | 1,00 4 | 1,055 | 1,082 | ||||||
| 10. Existential values (0–12) | Normal → breast cancer | NA | 2.90 (2.04 to 3.75) | <.001 | 2.59 (1.94 to 3.24) | <.001 | 2.27 (1.61 to 2.93) | <.001 | 3.02 (2.41 to 3.63) | <.001 | |
| Normal → false positive | NA | 1.74 (1.04 to 2.44) | <.001 | 1.46 (0.95 to 1.97) | <.001 | 0.83 (0.36 to 1.30) | .001 | 2.51 (2.02 to 3.00) | <.001 | ||
| False positive → breast cancer | NA | 1.15 (0.23 to 2.07) | .015 | 1.12 (0.36 to 1.89) | .004 | 1.43 (0.69 to 2.19) | <.001 | 0.51 (−0.20 to 1.23) | .158 | ||
| No. responding | 0 | 959 | 996 | 1,043 | 1,075 | ||||||
NA = not applicable.
Note: The correlation between repeated measures on the same woman is controlled for by generalized estimating equations (GEE) methods.
The mean difference Ä should be interpreted as the mean score in the group after the arrow minus the mean score in the group before the arrow shown in column marked Difference.
The women having abnormal screening mammography findings in the critical period before a final diagnosis (0 months) reported greater negative psychosocial consequences for all 8 outcomes compared with those women with normal findings. Also, in the short term (1 month) after the final diagnosis, the women who had false positives reported statistically greater negative consequences in the same 8 psychosocial outcomes compared with the women who had normal findings; at the same time, however, they reported significantly less-negative consequences than women with breast cancer. In the long term (6, 18, and 36 months), women with breast cancer experienced greater negative psychosocial consequences than women with false positives, who in turn experienced greater negative psychosocial consequences than women with normal findings. The difference throughout follow-up in psychosocial outcomes between women with false positives and women with normal results generally declined.
In all 4 scales of part II, the women with false positives reported significantly greater negative consequences than women with normal results in the short term (1 month). In the long-term (6, 18, and 36 months), the score tendency seen in part I persisted in part II. Women with breast cancer experienced greater negative changes in psychosocial consequences than women with false positives, who again experienced greater negative changes than women with normal findings. In the 2 scales regarding inner calm and existential values, however, there was no statistically significant difference between women with false positives and those with breast cancer up to 6 months’ follow-up.
DISCUSSION
Having a false positive is not harmless and causes undesirable outcomes in the long run. For a period of 3 years after being declared free of suspected cancer, women with false positives consistently reported greater negative psychosocial consequences compared with women with normal findings.
The pattern of the 12 psychosocial outcomes in this prospective longitudinal study was consistent. At the time of screening and at 1, 6, and 18 months after screening and final diagnosis, there were, in general, significant differences between the 3 screening groups: normal, false-positive, and true-positive results. Women with breast cancer experienced greater negative psychosocial consequences than women with false-positive findings, and these women experienced greater negative psychosocial consequences than women with normal findings. The differences between these 3 groups diminished at the 36-month assessment, although with the same pattern as at the 1-, 6-, and 18-month assessments. The consistent pattern in the 12 psychosocial outcomes indicated that the negative psychosocial consequences assessed with part I of the COS-BC and the long-term consequences assessed with part II measure the same overall construct: psychosocial consequences of breast screening. The sum scores reflecting changes in part II can therefore be seen as measuring negative psychosocial consequences as well. This finding confirms complex theories behind people’s reactions to trauma, which for some individuals can in the long term be followed by positive reactions. Such positive reactions reported by women with false-positives, however, are not a benefit of screening, “since first the fear, then the relief, are induced by the same screening.”28
Part II was developed in particular to measure the long-term consequences of false-positive cancer screening results.17,22,23 Our findings from this part imply that the degree of change in inner calmness and existential values within the first half-year after final diagnosis were just as great for women with breast cancer as for women receiving false-positive findings. Furthermore, the changes in existential values within 3 years were still greater for those having false positives compared with those with normal findings.
Brett and Austoker also found that 35 months after a false-positive finding, women still reported negative psychosocial consequences measured with the Psychological Consequences Questionnaire (PCQ).13 Part I of the COS-BC is a further development of the PCQ, and the content of 18 of the 29 items in part I has been adapted from the PCQ.17,21,22 In some of the scales and 1 of the single items in part I, a significant difference was found between women with false-positive and those with normal findings at the 36-month assessment. Such was not the case in some of the other scales and the other single item. When Brett and Austoker conducted their study in the United Kingdom, women were offered triennial breast screening. Thus, their 35-month assessment was just 1 month before the next screening. Studies have shown that some women reported negative psychosocial consequences simply as a result of receiving an invitation to breast screening.29
In Denmark women are offered biennial breast screening. Thus, the 36-month assessment in the present study is 1 year before and 1 year after the women are offered screening. A limitation, therefore, was that most women with normal and false-positive findings included in this study were offered a repeated breast screening at 24 months. By placing the 36-month assessment as far away as possible from subsequent invitations to breast screening, however, we might have minimized the contamination from an approaching invitation to screening. This design could be regarded as a viable strength in this study, and it could explain some of the difference in the results we measured with part I and the results found by Brett and Austoker.13
Another limitation of this study was that it was not possible to obtain the exact numbers of women who were not invited or who refused to participate in the survey at the recall clinics, even though the 2 screening centers were asked to collect these data.19 The centers reported that very few women refused to participate among those with abnormal findings. The main reason of refusal was that the women were too scared as a result of the abnormal screening result. We might therefore have underestimated the negative psychosocial consequences for those women with breast cancer and false positives.
A particular strength of the present study was that women with breast cancer were included in the survey. Thus it was possible over 3 years to compare psychosocial outcomes, not only between women having normal and false-positive findings, but also between women with false positives and women with breast cancer. We did not record family or friends’ history of breast cancer and previous experience with screening mammography, which are possible confounders. Because the lifetime risk for breast cancer in Denmark is 1 in 10, however, all women have relatives or friends with the diagnosis of breast cancer. Furthermore, the greater the age, the greater the probability is of women having previous experience with breast screening and having relatives or friends with breast cancer. We have adjusted for age as a possible confounder and thereby also indirectly adjusted for previous experience with breast cancer and screening mammography.
Collecting questionnaire data under 2 different conditions may result in bias. All 446 women, including those having an abnormal mammography, completed the COS-BC at the recall clinic. At 1, 6, 18, and 36 months after final diagnosis (true or false positive), the same women completed the questionnaire at home. Women with normal screening results completed the COS-BC at home only. Had some women completing the COS-BC at the recall clinic “smartened up” their answers to be polite, the negative short-term psychosocial consequences of an abnormal screening mammography would most likely be underestimated.
False-positive screening mammography causes long-term psychosocial harm. In a period of 3 years after being declared free of cancer suspicion, women with false positives consistently reported greater negative psychosocial consequences compared with women with normal findings. The first half-year after final diagnosis, women with false positives reported changes just as great in existential values and inner calmness as women with breast cancer.
Footnotes
Conflicts of interest: authors report none
To read or post commentaries in response to this article, see it online at http://www.annfammed.org/content/11/2/106.
Funding support: The Danish General Practice Foundation, The Danish Cancer Association, Helsefonden, and The Novo Nordisk Foundation. The authors have been independent of the above-mentioned funding organizations in all processes of the research project.
Authors’ contributions: John Brodersen contributed to the design, acquisition of data, drafting of the manuscript. Volkert D. Siersma contributed to the statistical analysis. Both authors participated in interpreting data, obtaining funding, critical revision, and final approval of the submitted manuscript.
References
- 1.Welch HG. Should I Be Tested for Cancer? Maybe Not and Here’s Why. Los Angeles, CA: University of California Press; 2004 [Google Scholar]
- 2.Gøtzsche PC, Hartling OJ, Nielsen M, Brodersen J, Jørgensen KJ. Breast screening: the facts—or maybe not. BMJ. 2009;338:b86. [DOI] [PubMed] [Google Scholar]
- 3.Brodersen J, Jørgensen KJ, Gøtzsche PC. The benefits and harms of screening for cancer with a focus on breast screening. Pol Arch Med Wewn. 2010;120(3):89–94 [PubMed] [Google Scholar]
- 4.Elmore JG, Barton MB, Moceri VM, Polk S, Arena PJ, Fletcher SW. Ten-year risk of false positive screening mammograms and clinical breast examinations. [see comments]. N Engl J Med. 1998;338(16): 1089–1096 [DOI] [PubMed] [Google Scholar]
- 5.Christiansen CL, Wang F, Barton MB, et al. Predicting the cumulative risk of false-positive mammograms. J Natl Cancer Inst. 2000; 92(20):1657–1666 [DOI] [PubMed] [Google Scholar]
- 6.Barratt A, Howard K, Irwig L, Salkeld G, Houssami N. Model of outcomes of screening mammography: information to support informed choices. BMJ. 2005;330(7497):936–940 [DOI] [PMC free article] [PubMed] [Google Scholar]
- 7.Castells X, Molins E, Macià F. Cumulative false positive recall rate and association with participant related factors in a population based breast cancer screening programme. J Epidemiol Community Health. 2006;60(4):316–321 [DOI] [PMC free article] [PubMed] [Google Scholar]
- 8.Hofvind S, Thoresen S, Tretli S. The cumulative risk of a false-positive recall in the Norwegian Breast Cancer Screening Program. Cancer. 2004;101(7):1501–1507 [DOI] [PubMed] [Google Scholar]
- 9.Njor SH, Olsen AH, Schwartz W, Vejborg I, Lynge E. Predicting the risk of a false-positive test for women following a mammography screening programme. J Med Screen. 2007;14(2):94–97 [DOI] [PubMed] [Google Scholar]
- 10.Hubbard RA, Kerlikowske K, Flowers CI, Yankaskas BC, Zhu W, Miglioretti DL. Cumulative probability of false-positive recall or biopsy recommendation after 10 years of screening mammography: a cohort study. Ann Intern Med. 2011;155(8):481–492 [DOI] [PMC free article] [PubMed] [Google Scholar]
- 11.Salz T, Richman AR, Brewer NT. Meta-analyses of the effect of false-positive mammograms on generic and specifc psychosocial outcomes. Psychooncology. 2010;19(10):1026–1034 [DOI] [PubMed] [Google Scholar]
- 12.Brodersen J, Thorsen H, Cockburn J. The adequacy of measurement of short and long-term consequences of false-positive screening mammography. J Med Screen. 2004;11(1):39–44 [DOI] [PubMed] [Google Scholar]
- 13.Brett J, Austoker J. Women who are recalled for further investigation for breast screening: psychological consequences 3 years after recall and factors affecting re-attendance. J Public Health Med. 2001; 23(4):292–300 [DOI] [PubMed] [Google Scholar]
- 14.Cockburn J, Staples M, Hurley SF, De Luise T. Psychological consequences of screening mammography. J Med Screen. 1994;1(1):7–12 [DOI] [PubMed] [Google Scholar]
- 15.Gilbert FJ, Cordiner CM, Affleck IR, Hood DB, Mathieson D, Walker LG. Breast screening: the psychological sequelae of false-positive recall in women with and without a family history of breast cancer. Eur J Cancer. 1998;34(13):2010–2014 [DOI] [PubMed] [Google Scholar]
- 16.Lampic C, Thurfjell E, Bergh J, Sjödén PO. Short- and long-term anxiety and depression in women recalled after breast cancer screening. Eur J Cancer. 2001;37(4):463–469 [DOI] [PubMed] [Google Scholar]
- 17.Brodersen J, Thorsen H. Consequences of Screening in Breast Cancer (COS-BC): development of a questionnaire. Scand J Prim Health Care. 2008;26(4):251–256 [DOI] [PMC free article] [PubMed] [Google Scholar]
- 18.Vejborg I, Mikkelsen E, Garne JP, et al. Mammography screening in Denmark. Dan Med Bull. 2011;58(6):C4287. [PubMed] [Google Scholar]
- 19.Utzon-Frank N, Vejborg I, von Euler-Chelpin M, Lynge E. Balancing sensitivity and specificity: sixteen year’s of experience from the mammography screening programme in Copenhagen, Denmark. Cancer Epidemiol. 2011;35(5):393–398 [DOI] [PubMed] [Google Scholar]
- 20.Njor SH, Olsen AH, Bellstrom T, Dyreborg U, Bak M, Axelsson C, et al. Mammography screening in the county of Fyn. November 1993–December 1999. APMIS Suppl 2003;(110):1–33 [PubMed] [Google Scholar]
- 21.Brodersen J, Thorsen H, Kreiner S. Validation of a condition-specific measure for women having an abnormal screening mammography. Value Health. 2007;10(4):294–304 [DOI] [PubMed] [Google Scholar]
- 22.Brodersen J. Measuring Psychosocial Consequences of False-positive Screening Results: Breast Cancer as an Example [dissertation]. Copenhagen: Department of General Practice, Institute of Public Health, Faculty of Health Sciences, University of Copenhagen: Månedsskrift for Praktisk Lægegerning; 2006 [Google Scholar]
- 23.Brodersen J, Thorsen H, Kreiner S. Consequences of screening in lung cancer: development and dimensionality of a questionnaire. Value Health. 2010;13(5):601–612 [DOI] [PubMed] [Google Scholar]
- 24.Brodersen J, Meads DM, Kreiner S, Thorsen H, Doward L, McKenna SP. Methodological aspects of differential item functioning in the Rasch Model. J Med Econ. 2007;10(3):309–324 [Google Scholar]
- 25.Diggle PJ, Heagerty P, Liang KY, Zeger SL. The Analysis of Longitudinal Data. 2nd ed Oxford, England: Oxford University Press; 2002 [Google Scholar]
- 26.Dufouil C, Brayne C, Clayton D. Analysis of longitudinal studies with death and drop-out: a case study. Stat Med. 2004;23(14): 2215–2226 [DOI] [PubMed] [Google Scholar]
- 27.Robins JM, Rotnitzky A, Zhao LP. Analysis of semiparametric regression models for repeated outcomes in the presence of missing data. J Am Stat Assoc. 1995;90(429):106–121 [Google Scholar]
- 28.Gram IT, Lund E, Slenker SE. Quality of life following a false positive mammogram. Br J Cancer. 1990;62(6):1018–1022 [DOI] [PMC free article] [PubMed] [Google Scholar]
- 29.Brett J, Bankhead C, Henderson B, Watson E, Austoker J. The psychological impact of mammographic screening. A systematic review. Psychooncology. 2005;14(11):917–938 [DOI] [PubMed] [Google Scholar]


