

Abstract
The effect of cellular crowding environments on protein structure and stability is a key issue in molecular and cellular biology. The classical view of crowding emphasizes the volume exclusion effect that generally favors compact, native states. Here, results from molecular dynamics simulations and NMR experiments show that protein crowders may destabilize native states via protein-protein interactions. In the model system considered here, mixtures of villin head piece and protein G at high concentrations, villin structures become increasingly destabilized upon increasing crowder concentrations. The denatured states observed in the simulation involve partial unfolding as well as more subtle conformational shifts. The unfolded states remain overall compact and only partially overlap with unfolded ensembles at high temperature and in the presence of urea. NMR measurements on the same systems confirm structural changes upon crowding based on changes of chemical shifts relative to dilute conditions. An analysis of protein-protein interactions and energetic aspects suggests the importance of enthalpic and solvation contributions to the crowding free energies that challenge an entropic-centered view of crowding effects.
Keywords: Molecular dynamics simulation, folding, villin, protein-protein interactions
INTRODUCTION
Biological cells consist of many elements such as proteins, nucleic acids, lipids and metabolites at rather dense concentrations. Such high concentrations are significantly different from the conditions typically encountered in experimental studies like dilute solutions or crystals1,2. Macromolecular crowding due to a dense cellular environments, on the order of tens of mM3, has long been proposed to modulate biomolecular structure and dynamics4. Crowding also appears to modulate kinetic properties such as diffusion and association rates that control biochemical reactions5-7. Furthermore, properties of the solvent also seem to be affected as a result of protein crowding both dynamically and thermodynamically, e.g. in form of reduced self-diffusion rates and dielectric constants8.
The long-standing view of the effect of crowding on protein stability involves an entropic stabilization of the native state due to volume exclusion that limits the space for extended conformations9. This view has been challenged recently, both experimentally and computationally10-13. In hydrogen-exchange NMR studies of chymotrypsin inhibitor 2 (CI2) in concentrated protein and non-protein crowder solutions13 it was found that CI2 stability depended strongly on the surrounding crowder type. In the presence of polyvinylpyrrolidone (PVP) CI2 was stabilized, while stability remained largely unaffected by bovine serum albumin (BSA) and a destabilizing effect was found in the presence of lysozyme. To better understand how CI2 is destabilized relative to PVP in the presence of protein crowders, molecular dynamics (MD) simulations of the same systems with fully atomistic models were performed14. These simulations suggest that the effect of crowding primarily depends on the nature of protein-protein interactions with the crowder proteins and, in particular, whether crowder interactions are favorable or not. Consistent with these findings are results from in-cell NMR studies11 that also indicate a destabilization of proteins in cellular environments. The experimental data by itself do not fully describe the origin of the observed destabilization effects but they suggest that in addition to entropy effects due to crowding7,15,16 enthalpic contributions due to protein crowders also play an essential role as suggested by recent amide proton exchange experiments17.
Past studies have often discussed crowding effects as a shift in equilibrium between native and unfolded states7. However, the recent observation of a non-native state under crowded environments that is different from simple unfolding suggest the possibility of a more complicated scenario18. One possibility to understand such data is that crowding disfavors the (thermally or chemically) unfolded state for entropic reasons but favors alternate non-native states for enthalpic reasons. In order to probe this issue further, we performed a series of fully atomistic MD simulations of protein mixtures at high total protein concentrations. We found that native protein stabilities were reduced by crowding, including the sampling of partially unfolded structures that could not be explained by a simple excluded volume effect of crowding. This suggests that the presence of protein crowders is essential in understanding crowding7. Moreover, the observed non-native states do not simply match the unfolded ensemble suggesting that crowding may significantly alter protein folding landscapes from those observed under dilute conditions. The MD results were further supported by NMR spectra on the same protein systems in dilute condition as well as in crowded environments. Chemical shift changes in the crowded environments agree with the simulation results and suggest reduced native-state stability in crowded protein environments due to non-specific protein-protein interactions.
METHODS
Simulation methodologies
Two small globular proteins were used as protein crowders: segment B1 of streptococcal protein G (protein G, 56 residues, PDB entry 1PGB19) and the headpiece subdomain of chicken villin (villin, 36 residues, PDB entry 1VII20) (cf. Fig. S1). Simulated systems consisted of four protein G and eight villin molecules, solvated with TIP3P water molecules under periodic boundary conditions. Different box sizes corresponding to protein volume fractions ranging from 10% to 43% were considered for each system. These simulations were described in detail previously8 and only the key aspects are briefly summarized here. In the initial systems protein G and villin molecules were placed in random orientations at the corners of cubic boxes8. Production simulations were carried out over 300 ns in the NPT ensemble at 300K and 1 bar pressure. For comparison, simulations of a single villin molecule, with eight different starting conditions, were also performed over 300 ns each at 298K and 1bar pressure. In addition, two 300 ns simulations of villin at 500K and in the presence of 8 M urea, respectively, were carried out. Urea was modeled using recent Kirkwood-Buff derived parameters21. All simulations were carried out with NAMD (version 2.7b2)22 The CHARMM22 all-atom force field23 was used with the CMAP correction term24 for modeling the proteins and standard simulation parameters were applied otherwise8. The simulations were analyzed with the MMTSB Tool set25, CHARMM26, and custom analysis scripts. VMD27 was used for visualization.
For the energetic analysis, we extracted 3,000 snapshots for each of the eight villin molecules from the trajectory of the most crowded system (C5) for a total of 24,000 snapshots. In each snapshot, the respective villin molecule was centered and all other molecules were translated to the periodic image with the minimum distance from the central villin. Free energies of crowding were calculated using a MMPB/SA scheme14 according to:
| (1) |
Contributions for villin, crowders, and villin plus the crowders were evaluated according to:
| (2) |
where ΔGMM is the vacuum force field energy, ΔGPB is the electrostatic solvation free energy obtained from the Poisson equation (using the PBEQ module in CHARMM with a grid spacing of 0.25 Å) and the solvent-accessible surface area (SASA) is multiplied by γ=0.00542 cal/mol/Å2 to estimate the cost of cavity formation.
Solute entropy changes were found to be negligible in a similar previous calculation 14 and were ignored here. In order to reflect a reduction in dielectric constant upon crowding 8 we used ε=80 for calculating ΔGvillin but ε=60 for ΔGcrowders and ΔGvillin+crowders.
Energetic estimates based on scaled particle theory were obtained from the following expression for the free energy of crowding in the presence of hard-sphere crowders28:
| (3) |
where π=ϕ/(1-ϕ) with the crowder volume fraction ϕ and z=(af/am). af is the radius of the folded protein modeled as a sphere and am is the crowder radius. Because the radius of gyration underestimates the contact surface of a spherical model of a protein, we calculated effective radii based on the SASA for a given conformation according to SASA = 4πr2. The crowder radius was set to 16.6 Å as an average over protein G and villin radii. In scaled particle theory, eq. 3 is given for the folded state while different expressions have been proposed for the unfolded ensemble29-31. Here we apply eq. 3 for both the native and the partially denatured states because we do not observe fully unfolded states that could be described as freely linked Gaussian chains.
NMR experiments of villin in dilute and crowded conditions
Protein sample preparations and NMR experiments are detailed in the supplemental material. Briefly, the DNAs encoding the headpiece subdomain (the amino acid sequence from L792 to F826, referred to from L2 to F36 in this paper; villin) of the chicken villin protein (SwissProt accession number P02640) and the segment B1 (from T228 to E282, referred to from T2 to E56 in this paper; protein G) of streptococcal protein G (P06654) were cloned into the expression vector using a two-step PCR32. The 15N-labeled villin and non-labeled protein G were synthesized by cell-free protein synthesis33. All NMR spectra were recorded at 298K on a 600 MHz Bruker Avance spectrometer equipped with CryoProbe.
RESULTS
Five systems with different protein volume fractions (10%vol to 43%vol) were set up. Each system consisted of four protein G and eight villin headpiece subdomain molecules (see Fig. S1 and Methods section for additional details) and, for each, 300 ns of MD simulation was performed with explicit solvent at 298 K. For comparison with a non-crowded environment, additional simulations of a single villin molecule were also performed at 298 K, at high temperature (500 K), and in the presence of urea.
Native state stability under crowded conditions
Protein stability was examined via root mean square deviations from the native state (RMSD, see time series in Fig S2) and the radius of gyration (Rg) from Cα atoms. Villin structures showed significant deviations from the native structures for some of the molecules. According to the potentials of mean force (PMFs) as a function of RMSD and Rg (cf. Figs. 1 and S3), non-native villin conformations appear at all crowder concentrations (C1-C5) but not under dilute conditions (cf. Fig. 1). However, native conformations remained the predominant species with fractions of native states of 0.92, 0.92, 0.96, 0.96 and 0.75 at increasingly crowded environments (C1-C5), respectively. The largest number of non-native states was seen for the most crowded case, C5, where representative denatured structures, denoted as LM1, LM2, LM3 and LM4, are shown in Fig. 1. In these structures, there is a loss of both tertiary and secondary structure, with RMSD values ranging from 5 Å to 10 Å with respect to the native state. However, the denatured structures remain overall compact with Rg values below 13 Å. In terms of secondary structure, the central (R15-F18) and C-terminal (P22-E32) α-helices were well maintained, but the N-terminal α-helix (residues D4-F11) was lost partially upon crowding (see Fig. S4). Previous folding studies of villin using atomistic MD simulations34,35 have suggested that the C-terminal of α-helix forms first, whereas the N-terminal α-helix forms last. Hence, the destabilization of the N-terminal vs. the C-terminal α-helix upon crowding may reflect differential intrinsic stabilities of villin that are brought out by crowding. In the denatured structures LM1-LM4 there is also a partial loss of tertiary interactions that leads to opening of the hydrophobic core. In particular, residues F7, F11 and F18 in the central core became exposed to the environment. As will be detailed below, the loss of intramolecular hydrophobic packing is partially compensated with intermolecular interactions involving hydrophobic residues.
Figure 1.

Potential mean force (PMF) as a function of RMSD and Rg of villin at different protein concentrations (C1(12%vol), C2(17%vol), C3(25%vol), C4(37%vol) and C5(43%vol)) in units of kBT. Representative structures are shown for local energy minimum states in the most crowded system (C5). NC and HT indicate the PMFs calculated form dilute simulation at 298 K and 500K, respectively. Native regions are defined as RMSD < 4.5 Å and Rg < 9.5 Å and unfolded regions as RMSD > 4.5 Å or Rg > 9.5 Å. The N-terminal residue is represented by red a sphere and key residues forming a central hydrophobic core, F7, F11 and F28, are shown in licorice form.
In contrast to villin, protein G remains highly stable during all of the simulations except for the most crowded case (C5) where a slightly destabilized near-native state with values of 2 Å < RMSD < 3 Å and 10 Å < Rg < 11 Å appears (see Fig. S3). This results from one of the four protein G molecules in the most crowded simulation deviating as far as 2.7 Å in RMSD from the native structure (Fig. S2), while the other three copies retain the native structure. This destabilized protein G conformation has a slightly opened core with the hydrophobic pocket between residues T25 on the helix and T2 on the β-sheet becoming more exposed to solvent (cf. Fig. S5). Concomitant with the opening of the core there were also structural changes in part of the α-helix (E32-N37) at the junction (V21) between the α-helix (A23-N37) and the β-sheet (K13-E19) and turn (D47-K50) region. Our finding that protein G shows less destabilization upon crowding compared to villin is likely a reflection of different inherent thermal stabilities of the native state. The B1 domain of protein G has a Tm of close to 90°C36 while the Tm of the villin headpiece domain is around 65°C37,38. Furthermore, villin has a stability of only 2.4 kcal/mol at 25°C38 vs. 6.6 kcal/mol at 25°C for protein G39.
There are also more subtle structural changes in villin as a result of crowding. Fig. 2b shows the PMF as a function of the Cα distance between V10 and G34, at the N-terminal helix and C-terminus, respectively. Under dilute conditions, the most stable state was located at 10 Å. Upon crowding, a second state with a shorter distance (7 Å) becomes equally populated. The state with the shorter distance is non-native and results in a slightly more compact core. The conformations with much larger distances (up to 22 Å) correspond to the partially denatured states described above.
Figure 2.

(A) 1H,15N TROSY-HSQC spectra of 15N-labeled villin (1 mM villin (green), 32 mM villin (blue), and 32 mM villin with protein G (red)). Residues with changed chemical shifts are labeled. (B) PMF along the Cα distance between G34 and V10 for non-crowded (NC: black) and crowded simulations (C1 (blue), C2 (magenta), C3 (light blue), C4 (orange) and C5 (green), respectively) with the two major structures shown in blue (open) and red (closed), respectively.
To compare with the MD results, we measured NMR spectra of villin in dilute solution (1mM villin) and in crowded conditions (32 mM villin as well as 32 mM villin and 16 mM protein G). The highest experimental concentration of villin and protein G matches the simulation C2 (17% vol. fraction). Higher concentrations could not be achieved experimentally. In Fig. 2a, the 1H,15N TROSY-HSQC spectra of 15N labeled villin (1 and 32 mM) and 32 mM 15N labeled villin with 16 mM non labeled protein G are shown. Most of the signals were conserved, but significant deviations of chemical shifts were observed upon crowding for S3, V10, L23, W24, G34, and L35 (cf. Fig. 2a). The changes of the chemical shifts for V10 and G34 are consistent with the shift in populations to a different state upon crowding as seen from MD (Fig. 2b). Other residues that show the changes of chemical shift are located at the surface in the native structure of villin consistent with increased protein-protein interaction upon crowding. We did not observe clear NMR evidence for the denatured states seen in the MD. This may be explained by the relatively small population (<10% except for the most crowded conditions that could not be matched experimentally) and large degree of heterogeneity of the denatured states as suggested by the simulations.
Differences between unfolding ensembles under high temperature and urea induced MD simulations
We compared the non-native structures observed upon crowding with the unfolded ensembles upon thermal and chemical denaturation. Using LM1-LM4 as representative non-native structures upon crowding, minimum RMSD values between snapshots of the thermally unfolded states were found to range between 3.0 Å and 4.0 Å. Superimposed snapshots with the respective minimum RMSD structures are shown in Fig. S6 emphasizing a high degree of similarity, but not all of these structures have corresponding matches in the urea-induced unfolded ensemble. Furthermore, when comparing the entire PMF between the high temperature MD simulations and crowded simulations, it is clear that most structures of the unfolded ensemble, especially much more extended conformations, are not sampled under crowded conditions. The dominant structures at high-temperature involve significant destabilization of the second helix (residues R15-F18) while maintaining the N- and C-terminal helices (cf. HT in Fig. 1) while urea-induced unfolded structures tend to maintain the central helix but lose both N- and C-terminal helices. Both are qualitatively different from the crowding-induced denatured states.
Protein-Protein interactions upon crowding
To further understand the origin of protein destabilization upon crowding, we analyzed minimum distance contact maps to understand protein-protein interactions in the crowded environments. Protein G-protein G and villin-villin did not show significant changes upon crowding except that the contacts became more frequent (cf. Fig. S7). In contrast, villin-protein G interactions qualitatively changed upon crowding (see Fig. 4). At lower concentrations, localized charge-charge interactions between Lysine/Arginine and Aspartic acid/Glutamic acid pairs dominate (see C1-C2) while, at higher concentrations (C4-C5), polar-hydrophobic and polar-polar interactions become dominant. At intermediate concentrations (C3), both are present. In particular, residues 15-25 of villin, where most of the hydrophobic residues are located, are involved in many of the contacts under the most crowded conditions. Representative dimer structures of villin-protein G interactions are shown in Fig. 4. The dimer A/B highlights the salt bridges between K31/D46 and D40/K25 at low concentrations. At higher concentrations, different interactions appear. The dimer C has polar-hydrophobic interactions between the loop region around D47-K50 of protein G and the central hydrophobic core of villin. The dimer D has polar-polar interactions between residues T2 and T17 at the edge of the β-sheet of protein G and the central α-helix (R15-F18) of villin.
Figure 4.

Interactions between protein G and villin at different concentrations (C1-C5) (a) and representative villin-protein G dimer structures (b). Contacts are defined from the average minimum Cα–distances. Key acidic and basic residues forming protein-protein interactions via salt bridges are indicated by a broken line. Representative dimer structures for charge-charge (A and B), polar-hydrophobic (C) and polar-polar (D) interactions are show in (b) with the contacting residue in licorice representation.
Energetic analysis using MMPB/SA and scaled particle theory
To gain a quantitative understanding of the how non-native conformations may be stabilized upon crowding, we carried out an energetic analysis of the conformational ensemble of villin under the most crowded conditions (C5). The resulting free energies of crowding (see Methods), averaged and projected as a function of Rg and RMSD, are shown in Fig. 5. The total MMPB/SA estimates show that both native-like and partially unfolded states are similarly favorable, in particular those corresponding to states LM1 and LM2, in qualitative agreement with the PMF-based analysis. Further analysis of the individual contributions indicates that the dominant states are primarily stabilized via electrostatic and Lennard-Jones interactions (Fig. 5b) but destabilized in terms of electrostatic solvation energy (Fig. 5c) suggesting a significant enthalpic contribution to the free energy of crowding due to protein-protein interactions. While electrostatic and solvation energies largely cancel each other, the partially unfolded states are favored because of an overall reduction of solvent-accessible surface areas (SASA) that reduce the cost of cavity formation in water (Fig. 5d). Individually, the SASA of the central villin increases upon unfolding but because of interactions with protein G the total SASA is decreased. This suggests that non-polar solvation effects may in fact be the major driving force for villin unfolding upon crowding.
Figure 5.

Energetic analysis using MMPB/SA and scaled particle theory. Total energy (a) as well as non-bonded vacuum interaction (b), PB-based electrostatic solvation (c), solvent-accessible surface area-based hydrophobic solvation (d) and scaled particle theory (e) are shown.
For comparison, we also calculated relative free energies based on scaled particle theory28-30 (see Methods). Based on this theory, the native structure of villin would be stabilized by ~5 kBT compared to any of the denatured structures. It is clear from this analysis that the entropic factors captured by scaled particle theory only play a relatively minor role compared to the enthalpic factors and solvation effects in the presence of protein crowders.
CONCLUDING REMARKS
This study examines protein stability in crowded environments with realistic protein crowders for a model system consisting of villin and protein G. Significant sampling of non-native structures is observed for villin molecules upon crowding, involving both subtle structural changes and overall unfolding. The results challenge the classical view of crowding based on a volume exclusion effect and suggest that partially unfolded structures can become stable under crowded environments through enthalpy-driven protein-protein interactions with surrounding crowders. We hope that this work will stimulate further studies to understand the conformational sampling of proteins in realistic cellular environments.
Supplementary Material
Figure 3.
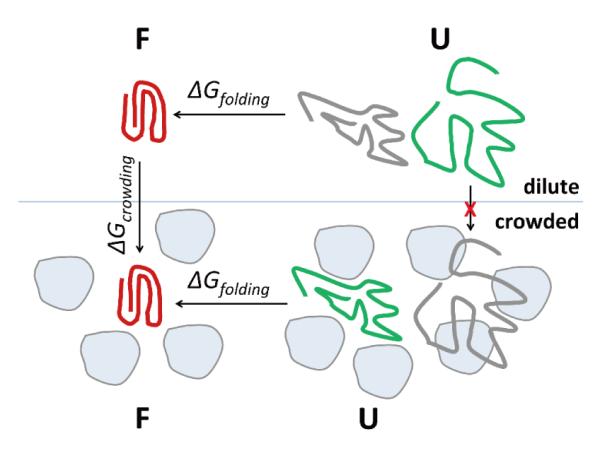
Schematic figure of protein folding in crowded environments.
The results from comparing the unfolded ensembles suggest that the crowding-induced denatured states are distinctly different from the major conformations in either the chemically or thermally unfolded ensembles. We therefore propose, that a discussion of protein folding equilibria under crowded conditions should therefore consider a significantly modified unfolded ensemble (cf. Fig. 3) where the unfolded structures upon crowding may at most partially overlap with the unfolded ensembles under dilute conditions (cf. Fig. 3). This observation is especially relevant for recently proposed post-processing protocols where solute conformations are first sampled separately in the absence of crowding agents and then inserted into crowding environments to examine their stability 40. A key assumption of this approach is that sampling of the solute under dilute conditions produces an ensemble that includes all of the conformations observed under crowded conditions. Our results suggest that this may not necessarily be valid.
ACKNOWLEDGMENT
Computational resources were provided by RICC (RIKEN Integrated Cluster of Clusters). Funding from NIH GM084953, NIH GM092949 and RIKEN-QBiC (to M.F.) is acknowledged. A part of this research has been funded by MEXT SPIRE Supercomputational Life Science (to Y.S.). We thank Kazuharu Hanada, Eiko Seki, Masaomi Ikari, Shusei Sugiyama, Takeshi Nagira, Naoko Akimoto, and Satoru Watanabe for sample preparation.
Funding Sources NIH GM092949, NIH GM084953, RIKEN-QBIC, MEXT SPIRE
ABBREVIATIONS
- BSA
bovine serum albumin
- CHARMM
Chemistry at Harvard molecular mechanics
- CI2
chymotrypsin inhibitor 2
- CMAP
cross-correlation map
- MD
molecular dynamics
- NMR
nuclear magnetic resonance
- MMTSB
multi-scale modeling tools in structural biology
- NPT
constant number of particles, pressure, and temperature ensemble
- PB
Poisson-Boltzmann
- PDB
protein data bank
- PMF
potential of mean force
- PME
particle-mesh Ewald
- PVP
polyvinylpyrrolidone
- Rg
radius of gyration
- RMSD
root mean-square displacement
- SASA
solvent-accessible surface area
- MMPB/SA
molecular mechanics Poisson-Boltzmann/surface area
- TIP3P
transferable interaction potential-3 point
- TROSY-HSQC
transverse relaxation optimized spectroscopy-heteronuclear single quantum coherence
Footnotes
Author Contributions The manuscript was written through contributions of all authors.
SUPPORTING INFORMATION AVAILABLE Supplementary material provides further details on experimental methods and additional figures showing the sequence and structure of villin and protein G, RMSD time series, PMFs as a function of Rg and RMSD for protein G, secondary structure content for villin, details of structural perturbations in protein G upon crowding, a more extensive comparison of villin sampling upon crowding, at high temperature, and in urea as well as residue contact maps for villin-villin and protein G-protein G interactions. This information is available free of charge via the Internet at http://pubs.acs.org/.
REFERENCES
- (1).Dauber P, Hagler AT. Accounts Chem. Res. 1980;13:105. [Google Scholar]
- (2).Goodsell DS. Trends Biochem. Sci. 1991;16:203. doi: 10.1016/0968-0004(91)90083-8. [DOI] [PubMed] [Google Scholar]
- (3).Ellis RJ, Minton AP. Nature. 2003;425:27. doi: 10.1038/425027a. [DOI] [PubMed] [Google Scholar]
- (4).Minton AP. Biopolymers. 1981;20:2093. [Google Scholar]
- (5).Minton AP. J. Cell. Sci. 2006;119:2863. doi: 10.1242/jcs.03063. [DOI] [PubMed] [Google Scholar]
- (6).Dix JA, Verkman AS. Annu. Rev. Biophys. 2008;37:247. doi: 10.1146/annurev.biophys.37.032807.125824. [DOI] [PubMed] [Google Scholar]
- (7).Zhou HX, Rivas GN, Minton AP. Annu. Rev. Biophys. 2008;37:375. doi: 10.1146/annurev.biophys.37.032807.125817. [DOI] [PMC free article] [PubMed] [Google Scholar]
- (8).Harada R, Sugita Y, Feig M. J. Am. Chem. Soc. 2012;134:4842. doi: 10.1021/ja211115q. [DOI] [PMC free article] [PubMed] [Google Scholar]
- (9).Zimmerman SB, Minton AP. Annu. Rev. Biophys. Biomol. Struct. 1993;22:27. doi: 10.1146/annurev.bb.22.060193.000331. [DOI] [PubMed] [Google Scholar]
- (10).Elcock AH. Curr. Opin. Struct. Biol. 2010;20:196. doi: 10.1016/j.sbi.2010.01.008. [DOI] [PMC free article] [PubMed] [Google Scholar]
- (11).Inomata K, Ohno A, Tochio H, Isogai S, Tenno T, Nakase I, Takeuchi T, Futaki S, Ito Y, Hiroaki H, Shirakawa M. Nature. 2009;458:106. doi: 10.1038/nature07839. [DOI] [PubMed] [Google Scholar]
- (12).Schlesinger AP, Wang YQ, Tadeo X, Millet O, Pielak G. J. Am. Chem. Soc. 2011;133:8082. doi: 10.1021/ja201206t. [DOI] [PMC free article] [PubMed] [Google Scholar]
- (13).Miklos AC, Sarkar M, Wang YQ, Pielak GJ. J. Am. Chem. Soc. 2011;133:7116. doi: 10.1021/ja200067p. [DOI] [PubMed] [Google Scholar]
- (14).Feig M, Sugita Y. J. Phys. Chem. B. 2012;116:599. doi: 10.1021/jp209302e. [DOI] [PMC free article] [PubMed] [Google Scholar]
- (15).Takahashi K, Arjunan SNV, Tomita M. Febs Letters. 2005;579:1783. doi: 10.1016/j.febslet.2005.01.072. [DOI] [PubMed] [Google Scholar]
- (16).Ridgway D, Broderick G, Lopez-Campistrous A, Ru’aini M, Winter P, Hamilton M, Boulanger P, Kovalenko A, Ellison MJ. Biophys. J. 2008;94:3748. doi: 10.1529/biophysj.107.116053. [DOI] [PMC free article] [PubMed] [Google Scholar]
- (17).Wang Y, Sarkar M, Smith AE, Krois AS, Pielak GJ. J. Am. Chem. Soc. 2012;134:16614. doi: 10.1021/ja305300m. [DOI] [PubMed] [Google Scholar]
- (18).Hong JA, Gierasch LM. J. Am. Chem. Soc. 2010;132:10445. doi: 10.1021/ja103166y. [DOI] [PMC free article] [PubMed] [Google Scholar]
- (19).Gronenborn AM, Filpula DR, Essig NZ, Achari A, Whitlow M, Wingfield PT, Clore GM. Science. 1991;253:657. doi: 10.1126/science.1871600. [DOI] [PubMed] [Google Scholar]
- (20).Davies DR, Chiu TK, Kubelka J, Herbst-Irmer R, Eaton WA, Hofrichter J. Proc. Natl. Acad. Sci. U.S.A. 2005;102:7517. doi: 10.1073/pnas.0502495102. [DOI] [PMC free article] [PubMed] [Google Scholar]
- (21).Weerasinghe S, Smith PE. J. Phys. Chem. B. 2005;109:15080. doi: 10.1021/jp051773i. [DOI] [PubMed] [Google Scholar]
- (22).Kale L, Skeel R, Bhandarkar M, Brunner R, Gursoy A, Krawetz N, Phillips J, Shinozaki A, Varadarajan K, Schulten K. J. Comput. Phys. 1999;151:283. [Google Scholar]
- (23).MacKerell AD, Bashford D, Bellott M, Dunbrack RL, Evanseck JD, Field MJ, Fischer S, Gao J, Guo H, Ha S, Joseph-McCarthy D, Kuchnir L, Kuczera K, Lau FTK, Mattos C, Michnick S, Ngo T, Nguyen DT, Prodhom B, Reiher WE, Roux B, Schlenkrich M, Smith JC, Stote R, Straub J, Watanabe M, Wiorkiewicz-Kuczera J, Yin D, Karplus M. J. Phys. Chem. B. 1998;102:3586. doi: 10.1021/jp973084f. [DOI] [PubMed] [Google Scholar]
- (24).Mackerell AD, Feig M, Brooks CL. J. Comput. Chem. 2004;25:1400. doi: 10.1002/jcc.20065. [DOI] [PubMed] [Google Scholar]
- (25).Feig M, Karanicolas J, Brooks CL., III J. Mol. Graph. Model. 2004;22:377. doi: 10.1016/j.jmgm.2003.12.005. [DOI] [PubMed] [Google Scholar]
- (26).Brooks BR, Bruccoleri RE, Olafson BD, States DJ, Swaminathan S, Karplus M. J. Comput. Chem. 1983;4:187. [Google Scholar]
- (27).Humphrey W, Dalke A, Schulten K. J. Mol. Graph. 1996;14:33. doi: 10.1016/0263-7855(96)00018-5. [DOI] [PubMed] [Google Scholar]
- (28).Lebowitz JL, Rowlinson JS. J. Chem. Phys. 1964;41:133. [Google Scholar]
- (29).Zhou HX. Arch. Biochem. Biophys. 2008;469:76. doi: 10.1016/j.abb.2007.07.013. [DOI] [PMC free article] [PubMed] [Google Scholar]
- (30).Zhou HX. J. Mol. Recognit. 2004;17:368. doi: 10.1002/jmr.711. [DOI] [PubMed] [Google Scholar]
- (31).Minton AP. Biophys. J. 2000;78:101. doi: 10.1016/S0006-3495(00)76576-3. [DOI] [PMC free article] [PubMed] [Google Scholar]
- (32).Yabuki T, Motoda Y, Hanada K, Nunokawa E, Saito M, Seki E, Inoue M, Kigawa T, Yokoyama S. J. Struc. Funct. Genomics. 2007;8:173. doi: 10.1007/s10969-007-9038-z. [DOI] [PubMed] [Google Scholar]
- (33).Matsuda T, Koshiba S, Tochio N, Seki E, Iwasaki N, Yabuki T, Inoue M, Yokoyama S, Kigawa T. J. Biomol. NMR. 2007;37:225. doi: 10.1007/s10858-006-9127-5. [DOI] [PubMed] [Google Scholar]
- (34).Yoda T, Sugita Y, Okamoto Y. Biophys. J. 2010;99:1637. doi: 10.1016/j.bpj.2010.06.045. [DOI] [PMC free article] [PubMed] [Google Scholar]
- (35).Harada R, Kitao A. J. Chem. Theory Comput. 2012;8:290. doi: 10.1021/ct200363h. [DOI] [PubMed] [Google Scholar]
- (36).Alexander P, Fahnestock S, Lee T, Orban J, Bryan P. Biochemistry. 1992;31:3597. doi: 10.1021/bi00129a007. [DOI] [PubMed] [Google Scholar]
- (37).Brewer SH, Vu DM, Tang YF, Li Y, Franzen S, Raleigh DP, Dyer RB. Proc. Natl. Acad. Sci. U.S.A. 2005;102:16662. doi: 10.1073/pnas.0505432102. [DOI] [PMC free article] [PubMed] [Google Scholar]
- (38).Wang MH, Tang YF, Sato SS, Vugmeyster L, McKnight CJ, Raleigh DP. J. Am. Chem. Soc. 2003;125:6032. doi: 10.1021/ja028752b. [DOI] [PubMed] [Google Scholar]
- (39).Orban J, Alexander P, Bryan P, Khare D. Biochemistry. 1995;34:15291. doi: 10.1021/bi00046a038. [DOI] [PubMed] [Google Scholar]
- (40).Qin SB, Zhou HX. Biophys. J. 2009;97:12. doi: 10.1016/j.bpj.2009.03.066. [DOI] [PMC free article] [PubMed] [Google Scholar]
Associated Data
This section collects any data citations, data availability statements, or supplementary materials included in this article.