Abstract
Purpose
To investigate factors that influence the multiplet pattern observed in J-difference editing of GABA.
Theory and Methods
Density matrix simulations were applied to investigate the shape of the 3 ppm GABA multiplet as a function of the editing sequence’s slice selective refocusing pulse properties, in particular bandwidth, transition width, and flip angle. For comparison to the calculations, experimental measurements were also made at 3T on a 10 mM GABA solution using the MEGA-PRESS sequence at various refocusing pulse flip angles.
Results
Good agreement was found between experiments and simulations. The edited multiplet consists of 2 outer lines of slightly unequal intensity due to strong coupling, and a smaller central line, the result of the unequal J-couplings between the C4 and C3 protons. The size of the center peak increases with increasing slice selective refocusing pulse transition width, and deviation of the flip angle from 180°.
Conclusion
The 3 ppm GABA multiplet pattern observed in the MEGA-PRESS experiment depends quite strongly on the properties of the slice selective refocusing pulses used. Under some circumstance the central peak can be quite large; this does not necessarily indicate inefficient editing, or a subtraction artifact, but should be recognized as a property of the pulse sequence itself.
Keywords: GABA, MEGA-PRESS, pseudo-doublet, J-difference editing
INTRODUCTION
J-difference edited detection of the inhibitory neurotransmitter GABA (1) is being widely applied in both clinical and cognitive neuroscience (2). The need for edited detection arises because the MR signals of GABA are overlapped by signals from other more concentrated metabolites, such as creatine (Cr), which make direct detection difficult. One widely used J-difference edited method for detecting GABA is the ‘MEGA-PRESS’ pulse sequence (3), in which the H4 GABA signal at 3 ppm is separated from overlying Cr signals on the basis of its coupling to the H3 GABA spins at 1.9 ppm.
For simple, weakly-coupled, spin systems the multiplet patterns detected by spectral editing can be readily predicted from simple analytical theory, particularly if ideal RF pulse behavior is assumed. However, for more complicated spin systems, spin systems containing strong-coupling, and in the presence of ‘imperfections’ in the RF pulses, generally the expected multiplet pattern can only be determined by exact numerical calculation. Simulations of multiplet patterns are important for MEGA-PRESS if they are to be used as model functions (‘basis sets’) for spectral fitting routines, as well as to recognize the presence or absence of artifacts in experimental spectra, so as to distinguish the ‘true’ GABA signal from those of either co-editing molecules (e.g. macromolecules) or subtraction artifacts. Simulations using different parameters also allow for experiments to be optimized in order to produce spectra with the highest signal-to-noise ratio.
In this paper, density-matrix simulations of the evolution of the GABA spin system are used to investigate the form of the 3 ppm GABA H4 multiplet as a function of various different properties of the slice selective refocusing pulses of the MEGA-PRESS experiment.
Background theory
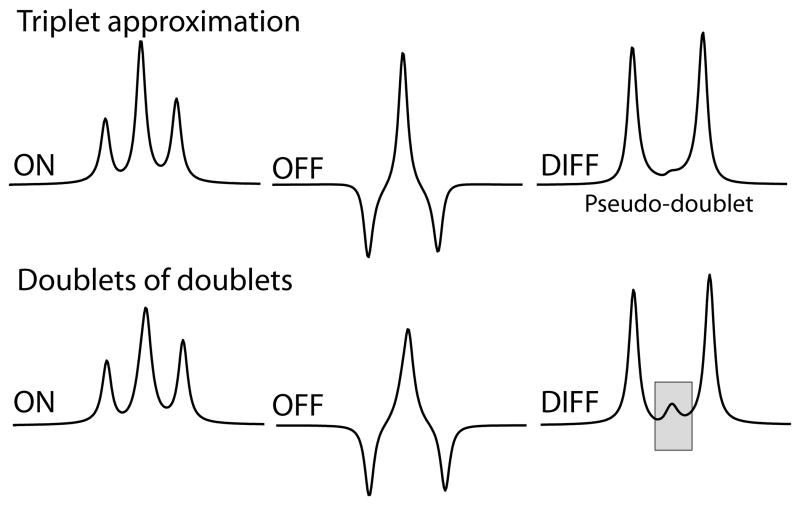
J-difference editing involves the acquisition of two datasets (usually referred to as the “OFF” and “ON” spectra). For the MEGA-PRESS experiment, the ON acquisition consists of a single-voxel PRESS sequence into which two frequency-selective editing pulses are incorporated. These pulses can be selectively applied to the GABA H3 protons that resonate at 1.9 ppm, with the effect that evolution of the J-coupling between the H3 and H4 protons (J3-4) at 3 ppm is refocused. During the OFF acquisition, these pulses are omitted (or more commonly, applied at a frequency that has no impact on GABA signals) so that the J-coupling evolves for the duration of the experiment. As can be seen from the simulated spectra in Figure 1, the multiplet at 3 ppm is substantially different between the ON and OFF experiments, so that when the two spectra are subtracted to remove the overlying Cr signals, a residual GABA signal is observed.
Figure 1.
Simulations of the MEGA-PRESS ON, OFF and DIFF spectra assuming: (above) equal couplings of 7 Hz and (below) the values in reference (4). Note that when unequal couplings are considered (the lower case), the difference spectrum contains a clear center peak.
It is a useful approximation to consider the GABA spin system as an A2M2X2 system (with A corresponding to the H4 protons at 3 ppm, M to the H3 protons at 1.9 ppm, and X to the H2 protons at 2.2 ppm), in which case the magnetic resonance (MR) spectrum would consist of a triplet at 3 ppm (A), a quintet at 1.9 ppm (M) and a triplet at 2.3 ppm (X), if JAM ≈ JMX and JAX ≈ 0. In this case, the J-difference editing ON spectrum would give a positive triplet at 3 ppm, while the OFF spectrum would give a ‘W-triplet’ in which the outer peaks of the triplet are inverted, as seen in Figure 1a. Subtracting these two gives a spectrum (labeled DIFF) which only contains the outer peaks, and which is often referred to as a ‘pseudo-doublet’. This approximation is a helpful way to conceptualize the experiment, but has limitations. The GABA signal at 3 ppm is not a simple triplet, but a superposition of two doublets of doublets, because both the C4 and C3 spins are magnetically non-equivalent and the coupling constants are not equal, i.e. J3-4 ≠ J3-4′ (4). As can be seen in Figure 1b, the net result for the DIFF spectrum is that the center peak is not absent as in the pseudo-doublet, but is present with relatively low intensity. This is a direct result of the GABA spin system and is not the result of imperfect subtraction or strong coupling -the center peak of a triplet does not evolve under coupling, and so is accurately subtracted out, whereas the center two peaks of a doublet of doublets (with not quite identical coupling constants) will evolve slowly under coupling, resulting in a J-difference signal.
The current investigation was motivated by two factors: firstly, the observation that MEGA-PRESS implementations on different scanners have noticeably different center-peak intensities (e.g. see Figure 2 of {Mullins PG et al. Current Practice in the use of MEGA-PRESS spectroscopy for the detection of GABA. Neuroimage 2012; under review}) deserves explanation; and secondly, the expectation of a pseudo-doublet leads to the view that seeing a doublet splitting in in vivo edited spectra is a useful marker of data quality (5). These two are linked by the fact that if a particular implementation of MEGA-PRESS has a greater relative intensity in the center peak, a doublet splitting would be less likely to be observed in vivo, largely independent of data “quality”. Thus, the aim of this paper is to use simulations and experiments to demonstrate the factors that influence the structure of the 3 ppm GABA multiplet in MEGA-PRESS spectra recorded at 3 Tesla.
Methods
Simulations
Spectral simulations were performed using an in-house MATLAB-based (MathWorks, Natick MA) implementation of the density-matrix formalism. The chemical shifts and coupling constants of the GABA spin system were taken from (4) and are given in Table 1. These values were estimated from high-resolution NMR data of a GABA sample using PERCH (Kuopio, Finland) automated consistency analysis software and, in comparison with previously published chemical shifts and coupling constants (6–8), were shown to produce simulated spectra which best agreed with experimental high-resolution GABA spectra recorded at high magnetic field strength.
Table 1.
Chemical shifts and coupling of GABA spin system (as taken from (4)).
| Spin | Chemical Shift (in ppm) | Couplings (in Hz) to: | ||||
|---|---|---|---|---|---|---|
| H2′ | H3 | H3′ | H4 | H4′ | ||
| H2 | 2.2840 | −15.938 | 7.678 | 6.980 | 0 | 0 |
| H2′ | 2.2840 | 6.980 | 7.678 | 0 | 0 | |
| H3 | 1.8880 | −15.000 | 8.510 | 6.503 | ||
| H3′ | 1.8880 | 6.503 | 8.510 | |||
| H4 | 3.0130 | −14.062 | ||||
| H4′ | 3.0130 | |||||
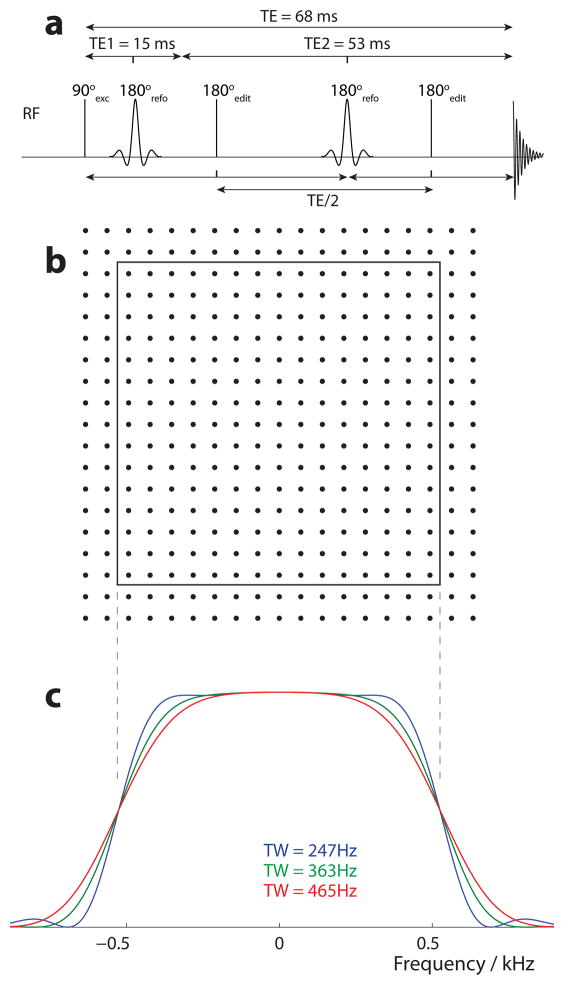
The MEGA-PRESS pulse sequence was simulated by following the evolution of the density matrix (σ(t)) under the influence of a time-independent Hamiltonian corresponding to either free precession, or rotation about an RF field. All simulations were performed at a B0 magnetic field strength of 3.0 T. The free precession Hamiltonian described evolution of the spins during delays, accounting for both chemical shifts and J-coupling effects. The RF pulses were simulated in the following manner: Firstly, for computational efficiency, both the excitation pulse and the editing pulses were assumed to be ideal rotations; the excitation pulse was simulated as an instantaneous 90 rotation applied to all spins about the x-axis, and the editing pulses were simulated as instantaneous rotations with ideal flip angles (i.e. 180° for spins at 1.9 ppm and 0° for other spins). An editing pulse of duration δ was implemented as a free precession period of δ/2, followed by the pulse rotations, followed by a second δ/2 period of free precession. Secondly, the shaped slice selective refocusing pulses were simulated in full as a series of small, ideal rotations about the effective field (B1eff, the vector sum of the applied B1 field, and the field offset for each spin). The default bandwidth of the slice selective refocusing pulses was set to 1050 Hz. Each individual simulation was run for a particular point in two-dimensional space corresponding to the plane of the 180° degree slice selection pulses, with the appropriate field offsets calculated according to the position in the plane and the strength of slice-selective gradients applied during the pulse. The strength of the gradients was chosen such that the region selected by the slice selective refocusing pulses was 3 cm × 3 cm. Slice-selective coherence selection was implemented by using a four-step phase cycle, with phases of [0, 90, 0, 90], [0, 0, 90, 90], and [0, 180, 180, 0] applied to the first and second refocusing pulses and receiver respectively. The timing of the editing pulses is shown in Figure 2a.
Figure 2.
(a) Simulation pulse sequence timing. The excitation pulse and editing pulses are treated as ideal rotations of 90° and 180° respectively. The first editing pulse is halfway between excitation and the second refocusing point. The second editing pulse is halfway between that point and the start of acquisition. Thus the time between these two editing pulses is TE/2.
(b) Schematic diagram showing the spatial location of the 19×19 array of simulation locations ● relative to the nominal voxel limits (solid line).
(c) Frequency response profile of the three refocusing pulses used to investigate transition bandwidth.
Common to all simulations, the echo time was 68 ms, of which the first slice-selective spin echo had a duration of 15 ms. The observed transverse magnetization was calculated by taking the trace of σ(t)Iy, where Iy is the operator for the y-component of the angular momentum. A 2048-point free induction decay (FID) was generated by calculating the observed magnetization at the echo time, and at subsequent 500 μs free-precession intervals. To approximate T2* decay, the FID was apodized using an exponential filter corresponding to a 2 Hz linewidth. Finally, the FID was Fourier transformed to produce a spectrum with a spectral width of 2000 Hz and a digital resolution of ~1 Hz/point.
Three sets of simulations were run, in order to investigate the impact of:
The bandwidth of slice-selective refocusing pulses;
The transition bandwidth of slice-selective refocusing pulses; and
The flip angle of slice-selective refocusing pulses
on the form of the edited multiplet. These three factors were chosen as they are known to differ substantially between different implementations of the MEGA-PRESS sequence.
Slice-selective refocusing bandwidth
By modulating the B1 field strength of slice-selective refocusing pulses, three different bandwidths were investigated:700 Hz; 1050 Hz; and 1400 Hz. These bandwidths are in the typical range used for in vivo experiments in humans and should be considered in the context of the chemical shift difference between the coupled spins (1.1 ppm) which is 141 Hz at 3T. In each case, the bandwidth of both slice-selective refocusing pulses was changed, and the gradient strength was recalculated to maintain a 3 × 3 cm2 voxel size.
Each simulation was carried out for 361 spatial positions, following a 19×19 spatial matrix covering 3.6 × 3.6 cm2 area, as shown in Figure 2b. Since experiments cannot performed with the spatial resolution possible in simulations, the acquired signal from a single voxel experiment was represented by the sum of the simulations from the 361 positions in the plane.
Slice-selective transition bandwidth
An ideal slice-selective refocusing pulse has a flip angle of 180° within the slice and 0° outside the slice, and a ‘top-hat’ spatial profile with an instantaneous transition from 180° to 0°. Finite-length slice-selective pulses of the kind used experimentally and simulated in this study have a finite transition bandwidth in which the flip angle is intermediate (i.e. between 180° and 0°) at the edge of the pulse profile. Transition bandwidth was manipulated by multiplying the amplitude modulation function of the refocusing pulses by a Gaussian function (approximately equivalent to convolving the refocusing profile with a Gaussian), making the pulse profile further from ideal. Three different refocusing pulses were generated; the one-dimensional refocusing profile for each is shown in Figure 2c. The bandwidth of each was 1050 Hz, and the transition bandwidths were 247 Hz, 363 Hz and 465 Hz.
Full 361-position spatial simulations (Figure 2b) were performed for MEGA-PRESS experiments incorporating each of these refocusing pulses with different transition bandwidths.
Refocusing flip angle
The B1 amplitude of the refocusing pulses was multiplied by factors ranging from 0.667 to 1.000 while maintaining the same duration to change the flip angle of slice-selective pulses between 120° and 180°. These simulations were performed for a single spatial position at the center of the voxel.
Experiments
A series of experiments was also performed for comparison with the flip-angle simulations. A 10 mM GABA phantom was studied in a 3T Philips Achieva scanner (Philips Healthcare LLC, Best, The Netherlands). The flip angles of the slice selective refocusing pulses were modulated by scaling the RF amplitude of both pulses, from 120 to 180 degrees in steps of 10 degrees. Other experimental parameters included: TR/TE = 2000/68 ms; 2.4× 2.4 × 4.0 cm3 voxel; 128 averages of 2048 datapoints sampled at a rate of 2 kHz; refocusing pulse bandwidth 1.4 kHz; 14 ms editing pulses placed alternately at 1.9 ppm and 7.5 ppm.
Results
Simulations of the MEGA-PRESS pulse sequence for the six-spin GABA system performed on a desktop PC (3 GHz processor, 3 Gbytes RAM) were performed in approximately 2 minutes per increment (or 12 hours per 19×19 array).
Slice-selective refocusing bandwidth
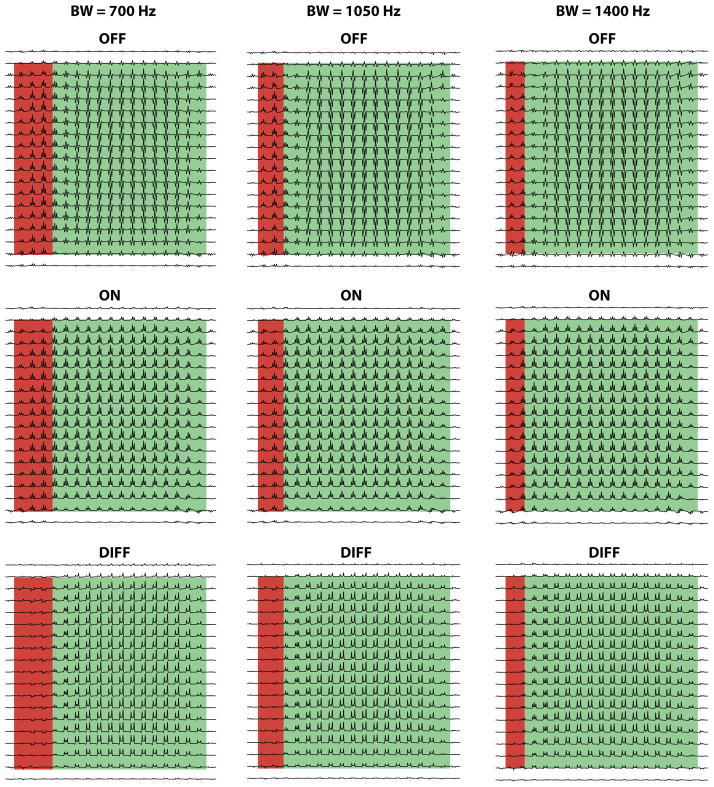
Figure 3 shows the results of simulations of the three slice-selective refocusing pulse bandwidths. Only the signal at 3 ppm (the target of editing) is shown for clarity. Along the dimension defined by the first refocusing pulse (vertical in Figure 3), the signals are relatively uniform as the duration of the first spin echo is short. There is significant spatial heterogeneity in the other, horizontal dimension, corresponding to the direction of the 2nd refocusing pulse. It can be seen that the outer lines of the multiplet also do not quite have equal intensity, with the upfield line slightly more intense than the downfield; this is a result of strong coupling between the H4 and H3 spins at 3T. (This effect is more easily seen in Figure 5).
Figure 3.
Spatially resolved simulated spectra for refocusing bandwidths of 700 Hz, 1050 Hz and 1400 Hz; only the 3 ppm GABA signal is shown. Note that in the majority of the voxel (highlighted in green) both 3 ppm spins and 1.9 ppm spins undergo the second refocusing pulse and so the experiment performs as expected. The fraction of the voxel in which only the 3 ppm spins undergo the second refocusing pulse (highlighted in red) scales with the inverse of the bandwidth.
Figure 5.
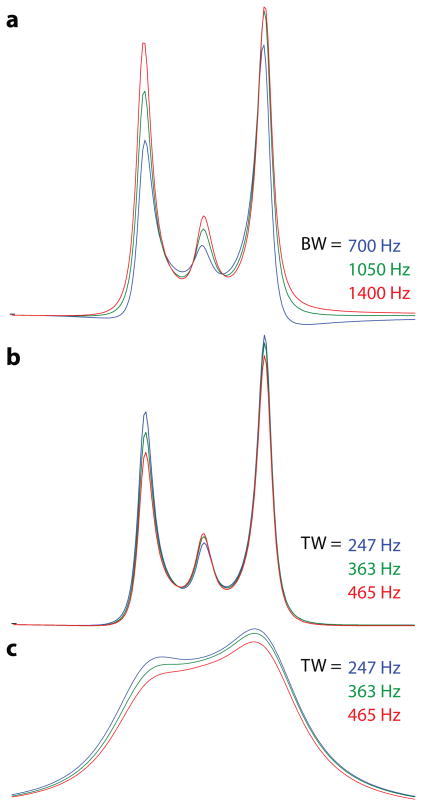
Summations over the whole voxel for: (a) the bandwidth simulations shown in Figure 3; and (b) the transition width simulations shown in Figure 4. (c) shows the same data as (b) processed with 10 Hz line broadening to simulate increased linewidth in vivo. Note that the bandwidth of the refocusing pulses affects the overall GABA multiplet intensity (or editing efficiency) (a), while the transition width affects the relative size of the central peak in the difference spectrum (b). Under realistic line broadening conditions (c), the size of the center peak clearly affects whether a pseudo-doublet splitting is observed.
As can be seen, this variation arises because of spatially varying evolution of coupling in the OFF spectra. In regions where both the 1.9 ppm spins and 3 ppm spins undergo the second slice-selective refocusing pulses (highlighted green), coupling evolves as intended resulting in the ‘W-like’ multiplet. In regions in which only the 3 ppm spins undergo the second slice-selective refocusing pulse (highlighted red), evolution of the coupling is refocused, giving an in-phase multiplet. The ON spectra show refocused coupling evolution in all regions. Thus the difference (DIFF) spectra show a dropout of signal in the red region, as both ON and OFF spectra are the same. This red region decreases in size as the refocusing bandwidth is increased, as shown. From the ratio of the chemical shift difference between coupled spins to the refocusing bandwidth, the red region takes up 20%,13%, and 10% of the voxel (the ratio δ described in (9)) in the cases of 700, 1050 and 1400 Hz bandwidths. This result agrees with previous discussions of bandwidth effects in MEGA-PRESS of GABA (8,9).
Slice-selective transition bandwidth
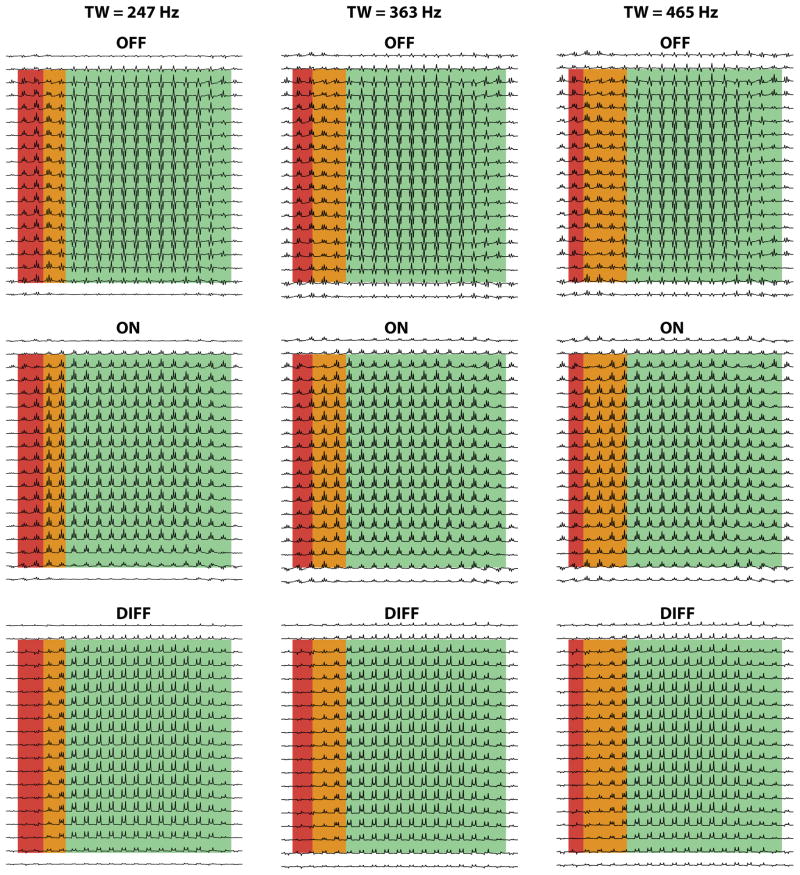
An interesting effect is observed in Figure 3 at the transition between red and green regions, where the flip angle applied to the 1.9 ppm spins is intermediate between 0° and 180°. This effect is investigated in greater detail in Figure 4, in which this transition band is additionally highlighted in orange. Again, only the edited signal at 3 ppm is shown for clarity.
Figure 4.
Simulated spectra for three different transition bandwidths (for the pulse profiles shown in Figure 2b); only the 3 ppm GABA signal is shown. Note that in the transition region of the voxel (highlighted in orange), the OFF spectrum has reduced intensity, resulting in a larger relative contribution from the center peak in the difference spectra.
As the profile of slice-selective refocusing pulses becomes less rectangular, the spatial extent of the orange transition region is increased. Within this region, the OFF spectra have reduced amplitude, whereas the ON spectra are unaffected, with the net effect that the difference spectra look like the ON spectra, with full intensity center peaks in addition to the outer peaks.
Aggregate over the whole voxel
Figure 5a shows the simulated signal from the whole voxel from the slice-selective refocusing pulse bandwidth simulations shown in Figure 3. The main effect is a modulation of the intensity, but not the form, of the multiplet as the bandwidth increases. Figure 5b shows the aggregate signal from the transition width simulation shown in Figure 4. Within the transition band, the center peak has full intensity, and therefore the contribution of the center peak to the aggregate spectrum is increased as the transition bandwidth increases. These simulations were performed with linewidths similar to those seen in the phantom experiments. Figure 5c shows the same simulated data processed with 10 Hz exponential line broadening to model the increased linewidth seen in vivo.
Refocusing flip angle
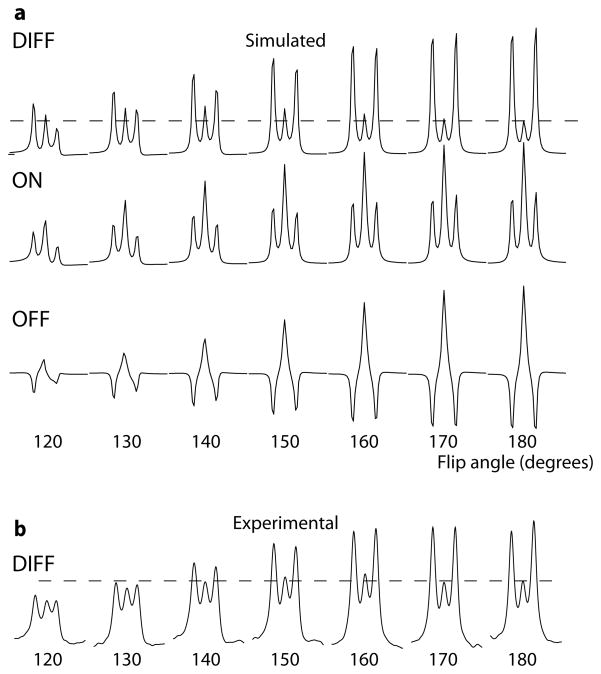
Since the transition regions discussed above are those regions in which the 1.9 ppm spins undergo a refocusing pulse of intermediate flip angle, simulations of the GABA signal as a function of refocusing pulse flip angle were also undertaken as described above. Figure 6a shows the simulated signal at 3 ppm for flip angles from 120° to 180°. There is a global reduction in signal intensity for flip angles below 180°, caused by reduced efficiency of refocusing. In addition, the center peak of the difference spectrum is relatively increased in the reduced flip angle case relative to the outer lines, largely due to reduced signal in the OFF spectrum. Figure 6b shows the experimental results for the same flip angle values showing similarly increased relative center-peak intensity compared to the outer lines at reduced flip angles.
Figure 6.
Effect of refocusing flip angle on both simulated and experimental spectra. Simulated spectra for flip angles from 120° to 180° are shown in (a). The dashed lines show the height of the center peak in the 180° spectrum. Experimental results in (b) show similar increase in the relative intensity of the center peak at lower flip angles. Note that there is not exact agreement between simulations and experiments, because the simulations are from the center of the voxel only.
Discussion
The simulations and experiments performed here illustrate several points about the 3 ppm GABA multiplet observed at 3T using the MEGA-PRESS editing sequence: namely, (a) even under conditions of ideal flip angle pulses, a small ‘center’ peak is present due to the presence of magnetically inequivalent methylene groups in the AA′MM′XX′ spin system and unequal coupling constants between the 3, 3′ and 4, 4′ spins; (b) the multiplet is asymmetric (with the downfield outer line of lower intensity that the upfield at refocusing flip angles close to 180°) due to strong coupling effects; (c) that the relative intensities of the outer and central lines are dependent on the flip angles of the slice selective refocusing pulses - as the flip angle decreases from 180° the relative amplitude of the center line increases; (d) these effects will also be observed in the ‘transition zone’ of the slice selective pulses where the flip angle deviates from 180°. Finally, chemical shift displacement effects also cause loss of signal due to lack of modulation in the OFF spectra in regions where the passive, coupled H3 spins are not affected by the slice selective refocusing pulses.
Since the edited multiplet results from the subtraction of the ON and OFF spectra, the origin of these observations should be considered from the effects of these experimental factors on the individual spectra. To a first approximation, the ‘on’ spectra have all J-modulation removed from them, and consist of a positive triplet regardless of the flip angle of the slice selective pulses. When the ‘off’ spectra have ideal flip angles, the multiplet has a ‘W’ pattern with the outer lines inverted as expected, and a positive center peak. However, when the flip angle of the slice selective pulses deviates from 180°, signal intensity is lost due to the creation of unobservable zero- and multiple-quantum coherence, both in the center and outer peaks. Subtracting the ‘off’ from the ‘on’ scans in these circumstances causes a difference spectrum with appreciable intensity from the center peak.
The loss of editing efficiency that occurs due to reduced refocusing bandwidth has been described elsewhere (8,9). However, it should be noted that the loss is not global throughout the voxel, but is confined to a ‘silent region’ along one face of the prescribed voxel; this has important implications for voxel placement. For example, consider an experiment which is focused on a cortical surface region, and in which the prescribed voxel has one face aligned with the surface of the brain. It is entirely possible that the GABA-silent region of the voxel might correspond with the cortical surface and the tissue of interest. Careful consideration of which slice-selective pulse corresponds to which spatial direction, and the chemical-shift displacement direction associated with each is required to make sure that this does not happen. Another solution is to use the inner-volume saturation (IVS) method to remove regions of unwanted modulation from the region of interest (9). The fraction of the voxel that contains signal with the desired modulation pattern should also be considered when quantifying edited spectra of GABA; the ‘effective’ voxel size may be different from that of the reference signal (e.g. creatine, or water), and the effective voxel size/location should be used when calculating the voxel grey matter fraction as a covariate or correction factor for GABA concentration.
Similarly, the spatial heterogeneity of the edited signals should also be considered when simulating basis sets for the quantitative analysis of spectra. Simulations over the whole voxel, rather than just single point in the center of the voxel, including non-ideal refocusing pulse effects are required for generation of the most accurate basis set. This is true not only for GABA-edited spectra, but also for editing experiments targeting other molecules such as glutathione, lactate or N-acetylaspartyl glutamate (NAAG).
In the simulations, two factors were identified that tended to increase the relative intensity of the center peak in the J-difference edited GABA multiplet: the width of the refocusing pulse transition band and the refocusing pulse flip angle. Both ‘less rectangular’ slice selection and reduced refocusing flip angle tend to increase the relative intensity of the center peak. This information explains commonly observed differences between implementations of MEGA-PRESS on different scanners. For instance, the implementation commonly used on General Electric (GE) scanners (10–20) has reduced slice-selective refocusing pulse flip angles, explaining the more prominent center peak seen in phantom experiments (see Figure 2 of {Mullins PG et al. Current Practice in the use of MEGA-PRESS spectroscopy for the detection of GABA. Neuroimage 2012; under review}). Reduced flip angle refocusing allows increased refocusing bandwidth for a given peak B1 and pulse duration, and is therefore sometime used in the short-TE PRESS experiment on which MEGA-PRESS is built. For small flip angle reductions, the loss in SNR which occurs as a result of imperfect refocusing is relatively low, and in the case of MEGA-PRESS editing of GABA, is further mitigated by reduced losses due to the bandwidth effects shown in Figure 3. One additional factor that can modify the relative center-peak signal is seen in Figure 2 of (21)–off-resonance application of editing pulses. Although not explicitly simulated here, this is consistent with expectations, since off-resonance application is also expected to result in a flip angle of less than 180° being applied to the 1.9 ppm spins. Another factor that is expected to change the multiplet pattern is the TE, as seen in Figure 2b of (22). Finally, a further difference between sequences (again not addressed in these simulations) that will affect the multiplet pattern is the timing of editing pulses.
As stated above, the more prominent center peak in the transition-band and reduced flip angle simulations arises because of reduced signal in the OFF spectrum. This is likely to occur because an intermediate flip angle pulse transfers anti-phase product operator terms into non-observable zero- and multiple-quantum coherence. In contrast, in the ON experiment the timing is such that the first editing pulse refocuses evolution of the coupling exactly at the point of the second refocusing pulse, and so there are no anti-phase terms present at this point. Therefore no signal is lost to unobservable operators.
The main value of these simulations, beyond an improved understanding of how minor pulse sequence changes can impact the observed GABA signals, is in the interpretation of in vivo spectra. When the simulated spectra shown in Figure 5b are broadened to simulate increased linewidths in vivo, it can be seen that the linewidth at which one no longer expects to see a doublet splitting varies depending on the extent to which the center peak ‘fills in the splitting’. It has been observed elsewhere {Mullins PG et al. Current Practice in the use of MEGA-PRESS spectroscopy for the detection of GABA. Neuroimage 2012; under review} that the ‘doublet’ splitting is less frequently observed in vivo in the GE implementation than other implementations, as would be predicted based on its reduced flip angle implementation.
The observation of a doublet splitting has been proposed as a benchmark for data quality (5). As the current study shows, even with identical field homogeneity and subject compliance, a splitting might be observed in one experiment and not in another depending on the pulse sequence used, so the value of the benchmark is rather limited for comparing data between studies (although it may have merits for comparisons within studies). Knowledge of the multiplet pattern associated with a particular editing implementation, which can be gained from simulations and phantom spectra, is important for gauging expectations of in vivo multiplet shape, and for the correct identification of artifacts.
These simulations have been based upon a set of coupling constant values derived from fitting high-resolution NMR spectra of GABA (4). These differ significantly from the values proposed in (6) and (8), in that they include values for geminal (two-bond) coupling constants, but also in the values of vicinal (three-bond) coupling constants. Although the precise values of GABA coupling constants are the subject of continued discussion, any set of coupling constant values with unequal couplings between the inequivalent protons (such as would predict triplet character) will give qualitatively similar results to those of the current simulations. It is also appropriate to be mindful of the approximations made in the simulations. Excitation was assumed to be perfect. Slice-selective refocusing was ensured by a two-step phase cycle, rather than a full four-step EXORCYCLE. Editing pulses were implemented as simple rotations. Flip-angle simulations were only performed for one spatial location. Each of these steps was taken to reduce the computational demand of the simulations, however they probably only have a minor effect on the results presented here.
One reason why the MEGA-PRESS method has emerged as the most widely used method for the in vivo detection of GABA is the relative ease with which the sequence can be programmed starting from a vendor’s stock PRESS sequence. As a result, several differences between MEGA-PRESS implementations are inherited from these PRESS sequences, especially the bandwidth, slice profile and flip angle of slice-selective refocusing pulses. The impact of these differences is largely cosmetic, but does bias the likelihood of observing a ‘pseudo-doublet’ splitting in in vivo experiments. Therefore, the observation of the pseudo-doublet in itself is not a good metric for the ‘quality’ of an edited spectrum.
Acknowledgments
This work was funded in part by NIH grants P41 EB015909 and R21 NS077300. We would like to thank Robin Simpson for supplying the MATLAB simulation code. NAJP holds an Autism Speaks Translational Postdoctoral Fellowship.
References
- 1.Rothman DL, Petroff OA, Behar KL, Mattson RH. Localized 1H NMR measurements of gamma-aminobutyric acid in human brain in vivo. Proc Natl Acad Sci U S A. 1993;90(12):5662–5666. doi: 10.1073/pnas.90.12.5662. [DOI] [PMC free article] [PubMed] [Google Scholar]
- 2.Puts NAJ, Edden RAE. In vivo magnetic resonance spectroscopy of GABA: A methodological review. Prog NMR Spect. 2012;60:29–41. doi: 10.1016/j.pnmrs.2011.06.001. [DOI] [PMC free article] [PubMed] [Google Scholar]
- 3.Mescher M, Merkle H, Kirsch J, Garwood M, Gruetter R. Simultaneous in vivo spectral editing and water suppression. NMR Biomed. 1998;11(6):266–272. doi: 10.1002/(sici)1099-1492(199810)11:6<266::aid-nbm530>3.0.co;2-j. [DOI] [PubMed] [Google Scholar]
- 4.Near J, Leung I, Claridge T, Cowen P, Jezzard P. Chemical shifts and coupling constants of the GABA spin system. Proc Intl Soc Magn Reson Med. 2012:4386. [Google Scholar]
- 5.Waddell KW, Avison MJ, Joers JM, Gore JC. A practical guide to robust detection of GABA in human brain by J-difference spectroscopy at 3 T using a standard volume coil. Magn Reson Imaging. 2007;25(7):1032–1038. doi: 10.1016/j.mri.2006.11.026. [DOI] [PMC free article] [PubMed] [Google Scholar]
- 6.Govindaraju V, Young K, Maudsley AA. Proton NMR chemical shifts and coupling constants for brain metabolites. NMR Biomed. 2000;13(3):129–153. doi: 10.1002/1099-1492(200005)13:3<129::aid-nbm619>3.0.co;2-v. [DOI] [PubMed] [Google Scholar]
- 7.Allouche AR, Aubert-Frecon M, Graveron-Demilly D. Quantum chemistry-based NMR spin Hamiltonian parameters of GABA for quantitation in magnetic resonance spectroscopy. Phys Chem Chem Phys. 2007;9(24):3098–3103. doi: 10.1039/b700631d. [DOI] [PubMed] [Google Scholar]
- 8.Kaiser LG, Young K, Meyerhoff DJ, Mueller SG, Matson GB. A detailed analysis of localized J-difference GABA editing: theoretical and experimental study at 4 T. NMR Biomed. 2008;21(1):22–32. doi: 10.1002/nbm.1150. [DOI] [PubMed] [Google Scholar]
- 9.Edden RA, Barker PB. Spatial effects in the detection of gamma-aminobutyric acid: improved sensitivity at high fields using inner volume saturation. Magn Reson Med. 2007;58(6):1276–1282. doi: 10.1002/mrm.21383. [DOI] [PubMed] [Google Scholar]
- 10.Sumner P, Edden RA, Bompas A, Evans CJ, Singh KD. More GABA, less distraction: a neurochemical predictor of motor decision speed. Nat Neurosci. 2010;13(7):825–827. doi: 10.1038/nn.2559. [DOI] [PubMed] [Google Scholar]
- 11.Boy F, Evans CJ, Edden RA, Lawrence AD, Singh KD, Husain M, Sumner P. Dorsolateral prefrontal gamma-aminobutyric acid in men predicts individual differences in rash impulsivity. Biol Psychiatry. 2011;70(9):866–872. doi: 10.1016/j.biopsych.2011.05.030. [DOI] [PMC free article] [PubMed] [Google Scholar]
- 12.Boy F, Evans CJ, Edden RA, Singh KD, Husain M, Sumner P. Individual differences in subconscious motor control predicted by GABA concentration in SMA. Curr Biol. 2011;20(19):1779–1785. doi: 10.1016/j.cub.2010.09.003. [DOI] [PMC free article] [PubMed] [Google Scholar]
- 13.Edden RA, Muthukumaraswamy SD, Freeman TC, Singh KD. Orientation discrimination performance is predicted by GABA concentration and gamma oscillation frequency in human primary visual cortex. J Neurosci. 2009;29(50):15721–15726. doi: 10.1523/JNEUROSCI.4426-09.2009. [DOI] [PMC free article] [PubMed] [Google Scholar]
- 14.Muthukumaraswamy SD, Edden RA, Jones DK, Swettenham JB, Singh KD. Resting GABA concentration predicts peak gamma frequency and fMRI amplitude in response to visual stimulation in humans. Proc Natl Acad Sci U S A. 2009;106(20):8356–8361. doi: 10.1073/pnas.0900728106. [DOI] [PMC free article] [PubMed] [Google Scholar]
- 15.Muthukumaraswamy SD, Evans CJ, Edden RA, Wise RG, Singh KD. Individual variability in the shape and amplitude of the BOLD-HRF correlates with endogenous GABAergic inhibition. Hum Brain Mapp. 2012;33(2):455–465. doi: 10.1002/hbm.21223. [DOI] [PMC free article] [PubMed] [Google Scholar]
- 16.Puts NA, Edden RA, Evans CJ, McGlone F, McGonigle DJ. Regionally specific human GABA concentration correlates with tactile discrimination thresholds. J Neurosci. 2011;31(46):16556–16560. doi: 10.1523/JNEUROSCI.4489-11.2011. [DOI] [PMC free article] [PubMed] [Google Scholar]
- 17.O’Gorman RL, Michels L, Edden RA, Murdoch JB, Martin E. In vivo detection of GABA and glutamate with MEGA-PRESS: reproducibility and gender effects. J Magn Reson Imaging. 2011;33(5):1262–1267. doi: 10.1002/jmri.22520. [DOI] [PMC free article] [PubMed] [Google Scholar]
- 18.Evans CJ, McGonigle DJ, Edden RA. Diurnal stability of gamma-aminobutyric acid concentration in visual and sensorimotor cortex. J Magn Reson Imaging. 2010;31(1):204–209. doi: 10.1002/jmri.21996. [DOI] [PubMed] [Google Scholar]
- 19.Stone JM, Dietrich C, Edden R, Mehta MA, De Simoni S, Reed LJ, Krystal JH, Nutt D, Barker GJ. Ketamine effects on brain GABA and glutamate levels with 1H-MRS: relationship to ketamine-induced psychopathology. Mol Psychiatry. 2012;17(7):664–5. doi: 10.1038/mp.2011.171. [DOI] [PMC free article] [PubMed] [Google Scholar]
- 20.Michels L, Martin E, Klaver P, Edden R, Zelaya F, Lythgoe DJ, Luchinger R, Brandeis D, O’Gorman RL. Frontal GABA levels change during working memory. PLoS One. 2012;7(4):e31933. doi: 10.1371/journal.pone.0031933. [DOI] [PMC free article] [PubMed] [Google Scholar]
- 21.Edden RA, Puts NA, Barker PB. Macromolecule-suppressed GABA-edited magnetic resonance spectroscopy at 3T. Magn Reson Med. 2012;68(3):657–61. doi: 10.1002/mrm.24391. [DOI] [PMC free article] [PubMed] [Google Scholar]
- 22.Edden RA, Intrapiromkul J, Zhu H, Cheng Y, Barker PB. Measuring T(2) in vivo with J-difference editing: Application to GABA at 3 tesla. J Magn Reson Imaging. 2011;35(1):229–234. doi: 10.1002/jmri.22865. [DOI] [PMC free article] [PubMed] [Google Scholar]


