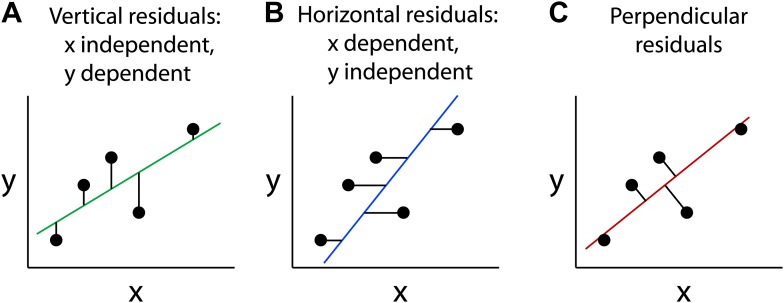
Figure 1. Different types of best-fitting straight lines.
These graphs show the best-fitting straight lines through the same five data points as calculated by minimizing the sum of the squares of the vertical residuals, which assumes that x is the independent variable (A); horizontal residuals, which assumes that y is the independent variable (B); and perpendicular residuals which involves no assumptions about the variables (C).

