

Abstract
We have prepared SAMs containing 8-mercaptooctyl α-D-mannopyranoside, either as a single component or in mixed SAMs with n-octanethiol on flat gold surfaces and on nanoporous gold. Electrochemical impedance spectroscopy showed that the mixed SAMs on flat gold surfaces showed the highest Con A binding near 1:9 solution molar ratio of thiolatedα-mannoside to n-octanethiol whereas those on NPG showed the highest response at 1:19 solution molar ratio of thiolated α-mannoside to n-octanethiol. Atomic force microscopy was employed to image the monolayers, and also to image the bound Con A protein.
Keywords: Nanoporous gold, Self-assembled monolayer, 8-mercaptooctylα-D-mannopyranoside, Lectin, Concanavalin A, Electrochemical Impedance Spectroscopy, Atomic Force Microscopy, Scanning Electron Microscopy
INTRODUCTION
Carbohydrates are among the most complex and prevalent biomolecules in living organisms. Cell surfaces are highly decorated with carbohydrates presented in the form of different glycoconjugates including glycolipids, glycoproteins, glycosaminoglycans and proteoglycans.[1] Glycosylation patterns differ according to cell type, stage of cell development, growth, and differentiation.[2] Abnormal patterns of glycosylation are associated with both the malignancy and metastasis of cancer cells.[3] Carbohydrates are involved in several biological processes such as cell-cell communication, cell recognition, cell adhesion in inflammation and metastasis, recognition in bacterial and viral infections, immune response, fertilization, and they also affect the conformation and stability of proteins.[4, 5] The malignant transformation of cells and the corresponding changes in glycotopes (carbohydrate epitopes) has made carbohydrates valuable targets for diagnostics and therapeutics.[6] Lectins are non-enzymatic proteins of non-immune origins that bind to mono- or oligosaccharides with high specificity.[7] Most lectins have multiple carbohydrate binding sites; therefore, when they interact with cell surface carbohydrates they interact with multiple cells and hence can cause cell precipitation, as occurs when lectins are used in the haemagglutination assay.[8] Because of their carbohydrate specificity and the scarcity of carbohydrate specific antibodies, lectins have become an important tool for the study of carbohydrate-protein interactions and have been utilized in the study of structural and functional roles of complex carbohydrates, cell surface carbohydrates,[9] cell sorting,[10] the study of protein glycosylation patterns,[11] and other applications that rely on advances in glycobiology for biomedical and biotechnological applications.[12, 13] One of the obstacles to the better understanding of carbohydrate-protein interactions is the weak nature of the interaction between carbohydrates and proteins. The attachment of carbohydrates to solid surfaces, polymer surfaces or to dendrimers results in a significant increase in the binding affinity; most probably due to the cluster glycoside effect, which facilitates multivalent interactions.[14, 15]
Biomolecule immobilization onto solid surfaces is an important aspect of the current state of the art technology in proteomics[16] and genomics.[17] Gene chips or DNA microarrays and protein microarrays have greatly facilitated the current understanding of processes involving protein and DNA molecules.[17, 18] When compared to these proteomic and genomic technologies, carbohydrate arrays are still in the early phases of development. Assays conducted in an immobilized format simplify the steps needed for the isolation and characterization of biomolecules. Cell-cell interactions often involve binding of a protein from one cell to the carbohydrates on an adjacent cell. Therefore, modifying solid supports with carbohydrate moieties can provide an appropriate model system for studying carbohydrate-protein interactions. Immobilization and functional display of carbohydrates on solid surfaces represents a great achievement in this direction.[19, 20] Gold has attracted tremendous interest as a solid support because of the interaction of gold and sulfur through which gold surfaces can be modified with thiolated species presenting the desired functionalities[21–25], and to which biomolecules can be conjugated.[23–26] The display of carbohydrate ligands on solid surfaces at appropriate density can favor the multivalent interactions of carbohydrates with lectins and increase the affinity.[14] The interfacial properties of self-assembled monolayers (SAMs) containing carbohydrates can be varied by preparing mixed SAMs.[27, 28]
The interaction of lectins with carbohydrate presenting SAMs has been the subject of a range of studies, and many have focused on the mannose – Con A interaction. The usage of mixed SAMs of a carbohydrate terminated alkanethiol and a diluting alkanethiol can reduce steric hindrance between neighboring sugar units and allow for multivalent protein binding.[14, 29] In some studies, both the carbohydrate presenting derivative and the diluting alkanethiol are synthesized in advance and then assembled onto the gold surface from a mixed solution of the components;[30–34] in these cases, the relation between the composition on the surface and that in solution is an important question.[28, 33, 35] In other studies, ‘click chemistry’ reactions have been applied to attach the carbohydrate, modified, for example, with a terminal azido group to react with an alkyne terminated molecule, onto the mixed SAM followed by capping of un-reacted groups.[36, 37] The diluting alkanethiol is most often terminated by a poly(ethylene glycol) group, as the ability of such groups to resist the non-specific adsorption of proteins has been widely studied and applied.[38, 39] SAMs presenting carbohydrates have been prepared in which a poly(ethylene glycol) chain terminated alkanethiol that is shorter is present between the longer chains of the sugar presenting molecules. Binding occurs more readily if the carbohydrate terminated species is taller than the diluting species in the mixed SAM.[40] Methods employed in these studies have included surface plasmon resonance,[14, 31–33, 41–44] using both propagating surface plasmons on flat gold films and also localized surface plasmon resonance on gold nanoparticles supported on solid substrates,[45, 46] electrochemical impedance studies,[47] microgravimetric analysis,[48] and anodic stripping of nanoparticle labels using square-wave voltammetry.[49] In the case of mixed SAMs on gold nanoparticles on screen-printed electrodes, use of 3-mercapto-1-propanesulfonate as the diluent was successful at limiting non-specific protein adsorption and providing a good impedance response to Con A binding to a short chain mannose derivative.[47] SAMs have been used to form microarrays for probing glycan-protein interactions,[50–53] which can be detected by fluorescence for sufficiently long SAMs that can limit quenching.[54–58] The application of SAMs to forming carbohydrate arrays is a promising technology. The interaction between mannose and Con A in SAMs has been probed at the molecular level by chemical force microscopy, using AFM tips modified either with mannose or with Con A and with the binding partner present in the SAM on the gold surface.[59] The ratio of carbohydrate derivative to diluting molecule in the SAM giving optimal binding has not often been examined in great detail. A number of studies using mixed SAMs have focused on their application to detection of bacteria, and in these studies fairly low ratios of carbohydrate derivative to diluent such as 1:1000 or 1:40 have been used.[34, 50] Boron-doped diamond electrodes are another surface successfully modified with mannose using click chemistry and these modified electrodes were found to show an impedimetric response to Con A binding, with the response saturating at a mannose surface fraction of 60%.[37]
Nanoporous gold (NPG) is a nanomaterial currently under intensive investigation due to its high surface area[24, 60] and possession of a localized surface plasmon resonance response[61] that is useful for sensor and assay applications.[62] NPG provides a high gold surface area at a relatively low cost per square centimeter.[63] NPG is prepared by the selective dissolution of less noble metal(s) from alloys containing 20 – 50% gold. The NPG structure consists of a bicontinuous network of pores and ligaments. These pores and ligaments can be tuned within a size range from tens to a few hundreds of nanometers by simply heating the prepared NPG.[64] NPG has been used as a surface for immobilization of proteins, for the development of immunoassays,[62] as a catalyst for selective oxidative coupling of methanol to methyl formate,[65] for immobilizing enzymes,[66] in a biofuel cell,[67, 68] and in other applications.[68, 69]
There is an increasing interest in label-free techniques for studying molecular interactions because of the inherent greater complexity associated with labeling techniques such as fluorescent and radio-labeling techniques.[70] Electrochemical impedance spectroscopy (EIS) is a label-free and sensitive technique for characterizing redox behavior at the electrode-electrolyte interface and the changes in this behavior occurring at the interface as a result of SAM formation and subsequent protein binding.[71] A small sinusoidal potential perturbation is applied to the system and current response is recorded over a range of frequencies. Impedance data at the selected frequencies is then fit to an equivalent circuit model that resembles the physical interface and the system under study.[72] Among the parameters extracted from this analysis, the double layer capacitance and the charge transfer resistance are the most common and are sensitive to interfacial changes. Charge transfer resistance is more sensitive to protein binding than double layer capacitance and hence it is the most widely used in analytical measurements. The increased surface area and capacitance of NPG appears attractive for increasing the sensitivity and detection limits of EIS studies.[47] NPG provides an environment of interconnected ligaments with positive curvatures in the 50–200 nm range, which could be argued to better approximate the curved environments found on the surfaces of liposomes or many intracellular organelles. As such, differences in the binding behavior of proteins to carbohydrates presented on these curved ligaments versus the behavior on flat or only slightly rough gold surfaces is of interest for study. The large surface area and porosity of NPG also presents a very different environment for impedance studies, the effect of which on responses to SAM formation and protein binding we wished to begin to explore. Herein, we report the application of impedimetric methods to study carbohydrate-lectin interactions on NPG and on gold wire surfaces and to compare the response to lectin binding on these two surfaces modified with mannose presenting SAMs. Several techniques have been devised for the attachment of carbohydrates to solid surfaces, including biotin-streptavidin based affinity attachment,[73] incorporation into SAMs formed on gold surfaces,[45] and click chemistry reactions onto appropriately functionalized surfaces.[74] The SAM based immobilization is the most straightforward technique for obtaining carbohydrate modified surfaces using thiolated glycosides. Thus, our carbohydrate modified electrodes were fabricated by the self-assembly of n-octanethiol (OCT) and 8-mercaptooctylα-D-mannopyranoside (thiolated α-mannoside, αMan-C8-SH) from ethanol solutions. αMan-C8-SH was mixed with OCT in the desired ratios in order to determine the ratio that gave the maximum increase in charge transfer resistance, due to Con A binding to mannose, on the electrode surface. Even though there are many reports of utilization of mixed SAMs for carbohydrate-lectin binding studies, to our knowledge, there has not been a comparison over a full range of composition to determine the optimal SAM mixture for binding. Prior studies, with the exception of those performed on Au nanoparticles,[47, 75, 76] were performed on flat gold surfaces.[14, 77] The present study seeks to compare the binding of Con A to mannose, presented in SAMs on both flat gold and on NPG surfaces. Mannose was chosen as the carbohydrate target due to its well-known binding behavior with Con A and its biological relevance, such as its association with the virulence of pathogens.[78] In addition to electrochemical impedance data, we also present topographic images of the single component (αMan-C8-SH) and of the mixed component (αMan-C8-SH and OCT at 1:9 solution molar ratio) SAMs characterized using atomic force microscopy (AFM). Upon exposure to Con A, AFM topographs reveal the binding pattern and decoration of lectin on the SAM surfaces (of single or mixed components) for both flat gold and NPG.
RESULTS AND DISCUSSION
Preparation and characterization of gold surfaces
Gold wire, side view (Figure 1a) and top view (Figure 1b), was used as a support for nanoporous gold formation. The gold wires used are 0.2 mm in diameter and have a typical length of 5.0 mm. Nanoporous gold was prepared by a two-step procedure of electrodeposition followed by acid dealloying. The resulting structure, as acquired by field-emission scanning electron microscopy (Figure 1c), is shown for NPG prepared by electrodepositing an alloy of 30% Au and 70% Ag from a solution of 15 mM K[Au(CN)2] and 35 mM K[Ag(CN)2] in 0.25 M Na2CO3 for 10 minutes at −1.0 V (vs. Ag|AgCl) and then dealloying for 24 hours in nitric acid. The SEM image shows the basic morphological features of NPG, consisting of interconnected pores and ligaments with dimensions of tens to few hundreds of nanometers (Figure 1d). The NPG covered wires generated were then used as working electrodes. The electrochemical surface area of the NPG was determined by the gold oxide stripping method. Figure 2 shows the cyclic voltammograms measured on NPG and gold wire obtained in 0.5 M H2SO4 upon scanning between 0 and 1.5 V at a scan rate of 100 mV sec−1. The charge passed under the reduction peak was integrated and the total electrochemical surface area was determined using the reported equivalency of 450 μC cm−2 for the reduction of gold oxide.[79–81] The electrochemical surface area of the gold wire was also determined in the same way. The electrochemical surface area of the NPG covered gold wire (12.5 ± 1.3 cm2, n = 3) was significantly higher than that of the gold wire itself (0.0408 ± 0.0004 cm2), and both of these wires have the same geometric surface area 0.032 cm2. The surface area of the NPG covered wires is thus approximately 300 times greater than that of the unmodified gold wire. The gold wires alone are estimated to have a roughness factor of 1.3, similar to that reported for Au foil.[82]
Figure 1.
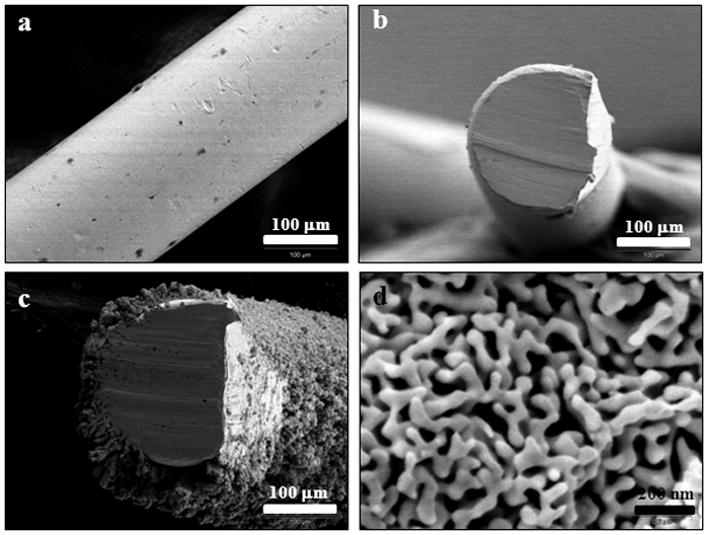
(a) Side view of a typical bare gold wire before modification. Top view of a bare gold wire before (b) and after (c) 10 min electrodeposition of 15 mM K[Au(CN)2]and 35 mM K[Ag(CN)2] in 0.25 M Na2CO3. The evenly coated nanoporous gold was revealed after dealloying using concentrated nitric acid. The defects on the right hand side of figures (b) and (c) are caused by clipping before mounting the wire on the SEM sample holder. The ligament network and pores of the nanoporous gold are shown in (d).
Figure 2.
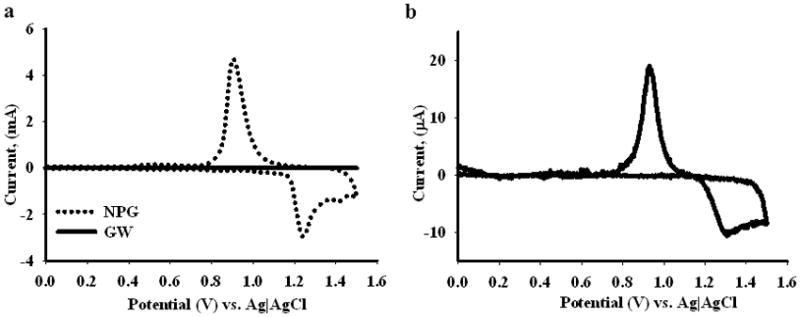
Cyclic voltammograms of bare gold wire (solid line) and nanoporous gold coated wire (dotted line) recorded in 0.5 M H2SO4. In (a), both the voltammograms are shown, and in (b) the voltammogram for the bare gold wire is shown.
Electrochemical impedance characterization of pure mannoside SAMs and their interaction with Con A
EIS data for the pure αMan-C8-SH SAM on a gold wire surface shows a well-defined semicircle (Figure 3a), representing charge transfer resistance and a small straight line, a consequence of the Warburg diffusion. In contrast, the αMan-C8-SH SAM on NPG is characterized by a much smaller semicircle and a straight line (Figure 3b). The larger surface area of NPG has reduced the charge transfer resistance.
Figure 3.
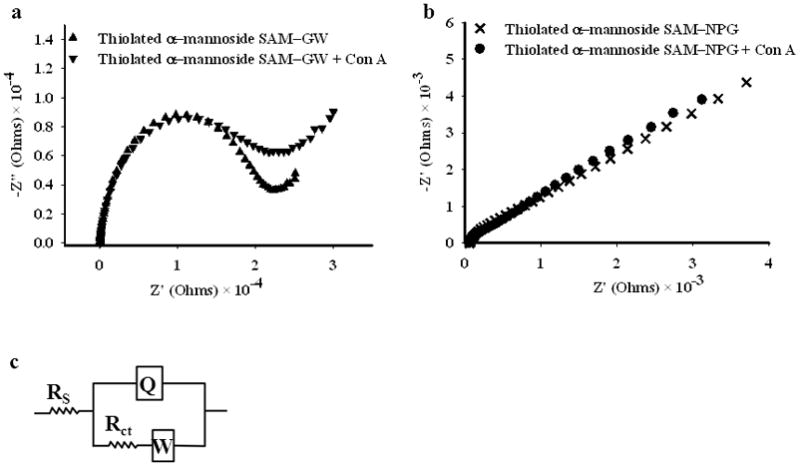
Electrochemical impedance spectroscopy data for SAMs of αMan-C8-SH on gold wire (a) and on NPG (b). The Nyquist plot is shown in each case before and after exposure to 0.5 μM Con A for 2 hours. The modified Randle’s equivalent circuit used for fitting the data, incorporating solution resistance (Rs), constant phase element (Q), charge transfer resistance (Rct) and Warburg impedance (W), is shown in (c).
NPG and gold wires with the pureαMan-C8-SH monolayers were then incubated for 2 hours with 0.5 μM Con A in the presence of 1 mM Ca2+ and 0.5 mM Mn2+, which are both required as cofactors. The EIS measurements on the gold surfaces presenting the pure αMan-C8-SH monolayers did not show a significant increase in charge transfer resistance after Con A binding. As reported in other studies, it is likely that the mannose surface density on the gold surface in a pure monolayer was too high, creating steric hindrance to the binding of Con A.
Mrksich et al. reported that the activity of the N-glycosyltransferase enzyme was very low on high density N-acetyl glucosamine terminated SAMs. When the surface density was diluted at the interface by preparing a mixed SAM of the N-acetylglucosamine terminated species and alkanethiolates bearing triethylene glycol terminal groups, an increase in enzymatic activity was seen.[29] In another study performed by Van Duyne et al., mannose-Con A binding on the gold surface, measured by SPR, was observed using only 5% mannose in the mixed SAM.[45] A similar study was done recently by Loaiza et al. who applied EIS to thiolatedα-mannoside on five carbon chain linker modified gold nanoparticles assembled on screen printed electrodes, on which they saw a response comparable to the background using the pure mannose SAM, but saw a large response upon lectin binding when they prepared mixed SAMs with 3-mercapto-1-propane sulfonate.[47]
Electrochemical impedance characterization of mixed SAMs of thiolated α-mannoside and octanethiol
Alkanethiols with terminal methyl groups can assemble and form well packed resistive monolayers on both NPG and on glat gold, as evidenced by observing a prominent semicircle in Nyquist plots (data to be published elsewhere). Mixed monolayers of OCT and αMan-C8-SH were examined by EIS and their binding of Con A was studied. A well-defined semicircle in the Nyquist plot was seen for every ratio of αMan-C8-SH to OCT on gold wire surfaces, suggesting formation of an organized and resistive monolayer at all compositions (see Figure S1 in supplementary information). In contrast, on NPG surface, resistive and hence presumably well organized monolayers were not seen at all composition ratios. A semicircle was not seen for the 1:1 and 1:2 molar ratio mixed SAMs of αMan-C8-SH/OCT on NPG. When the αMan-C8-SH content was decreased in the SAM solution, a clear semicircle in the Nyquist plot became evident which should indicate a resistive interface modified by an organized monolayer (see Figure S1 supplementary information).
Electrochemical impedance characterization of Con A binding to mixed SAMs of thiolated α-mannoside and octanethiol
Given the failure to observe Con A binding to the pure SAMs, and in light of the numerous literature reports of improved lectin binding mixed SAMs containing glycosides, a mixed SAM of αMan-C8-SH and OCT was investigated using EIS. A solution molar ratio of 1:9αMan-C8-SH/OCT was chosen. The EIS data obtained for this mixed SAM on both NPG and gold wire surfaces is shown in Figure 4. Incubation of these SAMs in the 0.5 μM Con A solution resulted in a significant increase in charge transfer resistance as indicated by the increase in diameter of the semicircle in the Nyquist plots. This result clearly shows that there is a layer of Con A molecules being added at the interface. In accordance with the literature reports, a better response for carbohydrate-lectin binding is seen upon dilution of ligand density on the surface.[47] This result was true for both the gold wire surfaces, as well as the NPG surface. The relative contributions of non-specific binding of Con A to either any exposed areas of bare Au, or to the OCT regions of the SAM is described in greater detail in the next section.
Figure 4.
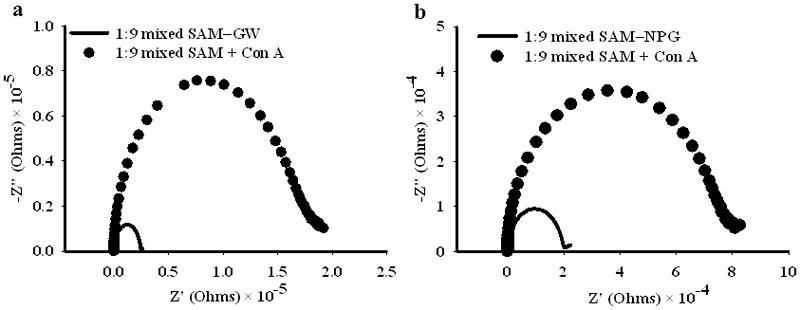
Electrochemical impedance spectroscopy data for mixed SAMs of αMan-C8-SH and OCT on both gold wire and on NPG surfaces. a) Nyquist plot for the SAM prepared from 1:9 solution molar ratio αMan-C8-SH/OCT on gold wire, before and after incubation for 2 hours with 0.5 μM Con A. b) Nyquist plot for the SAM prepared from 1:9 solution molar ratio on NPG coated gold wire, also before and after incubation for 2 hours with 0.5 μM Con A.
A series of experiments were then performed to determine the optimal ratio of αMan-C8-SH/OCT for observing Con A binding to these SAMs on NPG and gold wire surfaces. Figure 5 shows a plot of percentage change in Rct resulting from incubation with Con A on both NPG and gold wire for SAMs prepared from different ratios of the two components in solution (1:1, 1:2, 1:5, 1:7, 1:9, 1:19, 1:50). On gold wire surfaces, the greatest response to Con A binding was obtained near 1:9 αMan-C8-SH/OCT. A clear semicircle was observed on NPG formed from αMan-C8-SH of 1:5 or less. The highest Rct response ratio on NPG was obtained approximately near 1:19 αMan-C8-SH/OCT. This difference in optimal ratio could arise because of the difference in the in the mannose ligand display associated with the curved nature of the NPG surface and its effect on SAM structure. At lower mole ratios of mannoside, the mannose units in the SAM should be spaced further apart, and less sterically hindered in their interaction with Con A. However, as the density of mannoside becomes very low, multivalent interactions and overall binding will ultimately diminish.
Figure 5.
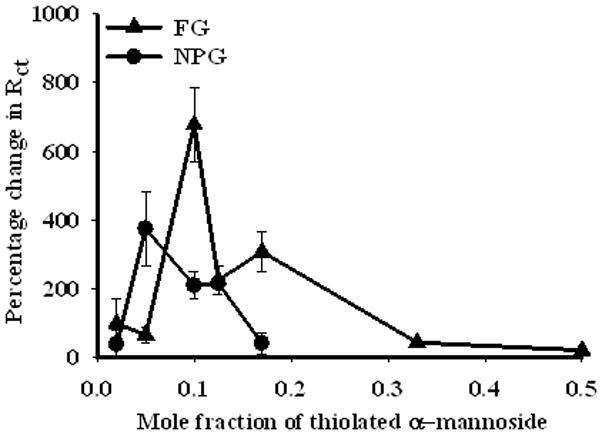
Variation of the response of the charge transfer resistance (before and after incubation with Con A) versus the solution molar fraction ofαMan-C8-SH in the solution from which the SAMs were prepared. EIS data were collected for the SAMs before and after incubation with 0.5 μM Con A for 2 hours. Rct values were obtained by fitting EIS data to the equivalent circuit in Figure 3(c). Percentage change in response, defined as (Rct,(protein)− Rct,(SAM)/Rct,(SAM)) ×100, is shown on gold wire (triangles) and on NPG coated gold wire (circles). Each measurement was repeated 3 times.
Con A binding to bare gold surfaces and to octanethiol modified gold surface and comparison with binding to mixed SAMs
The impedance response of bare gold wire to Con A binding shows evidence for non-specific protein adsorption. The Nyquist plot for bare Au wire shows a small semicircle giving an Rct value of 200 Ω which increases to 1500 Ω upon exposure to Con A (0.5 μM, 2 hours), as seen in Figure 6. In contrast, the Nyquist plot for the bare NPG is dominated by a large slightly curved line, characteristic of a porous electrode, that shifts slightly after similar exposure to Con A, and for which Rct values cannot be determined either before or after Con A binding.
Figure 6.
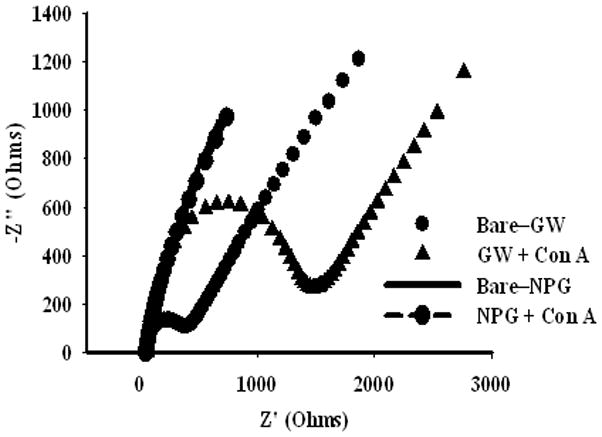
Nyquist plots for bare Au before and after exposure to 0.5 μM Con A, and for bare NPG before and after exposure to 0.5 μM Con A for 2 hours.
The Rct values found for a number of the relevant interfaces of unmodified and modified gold wire or NPG interacting with Con A are shown in Figure 7, in the form of bar charts for ease of comparison. Modification of the gold wire with a SAM of OCT results in an Rct value of 32 kΩ, which upon incubation with Con A increases to 50 kΩ, and indicates that protein adsorption occurs onto the hydrophobic surface. The results for Rct for the 1:9 and 1:19 αMan-C8-SH/OCT SAMs both before and after Con A binding are shown for comparison. Figure 7a shows that the increase in Rct upon Con A binding to the 1:9 αMan-C8-SH/OCT SAMs on gold wire is much greater than that due to Con A binding on the OCT monolayer. Figure 7a also shows that the increase in Rct for the 1:19 αMan-C8-SH/OCT SAM is much greater than that due to Con A binding to an OCT monolayer. In Figure 7a, the Rct values on bare Au are too small to register on the plot compared with the other values. Figure 7b shows the analogous data on NPG, with the exception of bare NPG and bare NPG interacting with Con A, for which Rct values cannot be determined. The value of Rct for OCT modified NPG, while greater than that of the 1:9 or 1:19 αMan-C8-SH/OCT SAMs, does not shift noticeably as a consequence of Con A binding. The impedance behavior of the high surface area NPG electrode modified with a hydrophobic SAM is apparently less affected by nonspecific adsorption of Con A in terms of the value of Rct. The response of the 1:19 αMan-C8-SH/OCT SAM is seen as greater than that of the 1:9 αMan-C8-SH/OCT SAM on NPG. While some measure of non-specific binding of Con A on a hydrophobic surface such as OCT is clearly expected, it does not appear to contribute as much as one might expect to the shift in Rct values on these SAM modified NPG electrodes.
Figure 7.
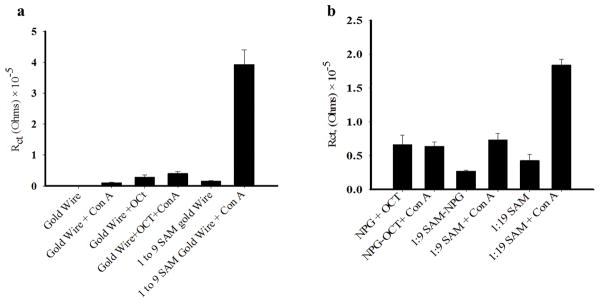
Bar plots of charge transfer resistance for bare and modified gold wire (GW) in (a) and for bare and modified NPG surfaces in (b). The surfaces were incubated with 0.5 μM Con A for 2 hours. The value of Rct on bare NPG before and after incubation with Con A could not be determined. The standard error in each Rct value is for the average of measurements on three different wires.
Binding affinity of Concanavalin A to mixed SAMs of thiolated α-mannose and octanethiol on gold wire and on NPG surfaces
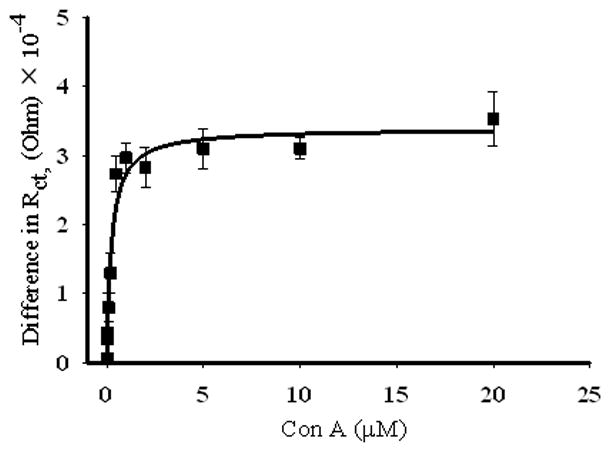
The binding of Con A to the mixed SAMs found to give the greatest response in Rct to Con A binding was then studied as a function of Con A concentration. Figure 8 shows the binding isotherms for Con A to mannose, in both 1:9 and 1:19 αMan-C8-SH/OCT SAMs, on NPG and gold wire surfaces. The difference in charge transfer resistance (ΔRct = Rct,(protein) −Rct,(SAM)) is plotted versus the Con A concentration. Binding of the Con A to mannose on the gold wire surface is stronger for both ratios, the binding affinities calculated from this study by fitting data to a one site ligand binding model are 15.0 ± 4 nM and 13.0 ± 7 nM for the 1:9 and 1:19 αMan-C8-SH/OCT SAMs, respectively. It should also be noted that magnitude of Rct achieved at saturation is different for these two different ratios. Gold wires with the 1:9 molar ratio mixed SAM have almost a two-fold higher Rct value at saturation compared to the Rct value for the 1:19 molar ratio wires. There have been different reports for the binding affinity of Con A to mannose depending upon the method of study and surface composition. In a study based on SPR imaging on gold surface, with 50% mannose diluted with pyridyl groups at the interface, a Kd value of 178 nM was reported.[14] Even though this report showed fairly constant Kd value for different mole fractions of mannose at the interface, the difference in the nature of the diluting molecules, and hence the nature of the interface might be one factor responsible for the observed variation in binding affinity in our case. In another study by Liang et al. a variation in surface dissociation constant of Con A to α-mannoside modified glass slides was reported that depended upon the printing concentrations of α-mannoside on N-hydroxysuccinimide activated glass slides. They reported an average surface dissociation constant of 83 nM.[57] A high binding affinity (Kd = 4.3 nM) for Con A to p-aminophenyl α-D-mannopyranoside immobilized on a dextran modified sensor chip (CM5) was reported by Nahalkova et al.[83] We also studied the binding of Con A to mannoside on the gold wire prepared from higher mannoside concentrations in the SAM formation solution. We could see changes in Rct, after Con A binding, at 1:2 αMan-C8-SH/OCT, but for NPG there was not a very well organized SAM at this ratio, and we did not observe any change in Rct. The binding affinity of Con A to mannoside on gold wire, at this ratio, was 244 nM (Figure 9). This is fairly similar to the literature report of Con A - mannoside binding affinity, at similar ratio of mixed SAM, of 178 nM.[14]
Figure 8.
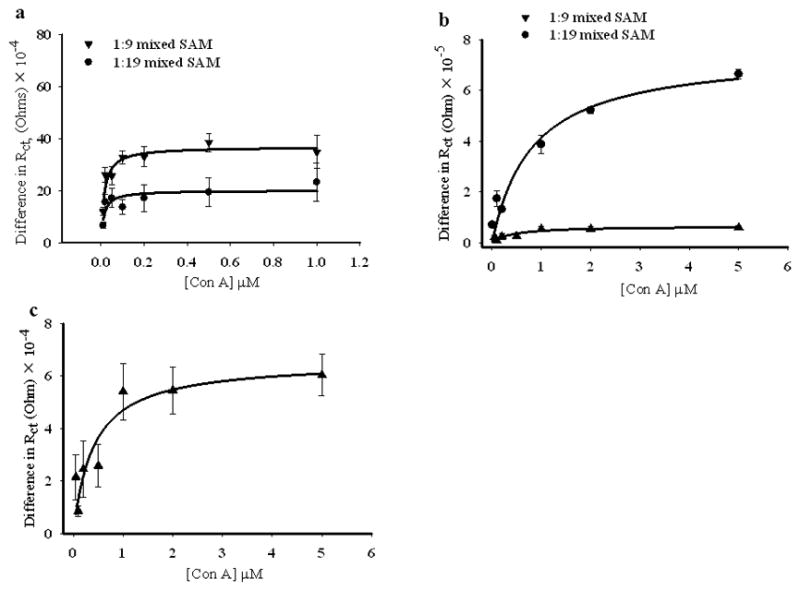
Con A - mannose binding isotherms for mixed SAMs prepared from 1:9 and 1:19 solution molar ratios of αMan-C8-SH/OCT on NPG coated gold wire, and on gold wire. (a) Gold wire, 1:9 molar ratio (down triangles) and 1:19 molar ratio (circles). (b) NPG coated gold wire surface, 1:9 molar ratio (down triangles) and 1:19 molar ratio (circles), (c) enlarged view of the difference in Rct vs. Con A concentrations for 1:9 molar ratio SAM on NPG. The NPG coated gold wire and gold wire surfaces modified with the SAMs were incubated for 2 hours with different concentrations of Con A. The difference in ΔRct, Rct = Rct, (protein)−Rct,(SAM). The error bars represent the standard deviation for 5 measurements.
Figure 9.
Binding isotherm (ΔRct versus concentration) for Con A-mannose on gold wire modified with SAM of 1:2 solution molar ratio αMan-C8-SH/OCT. The error bars represent the standard error for 5 measurements.
The data on NPG shows that the affinity of Con A to αMan-C8-SH varies with the fraction of αMan-C8-SH used to form the SAM: the binding affinity of Con A to mannose on NPG gives Kd = 400 ± 190 nM and Kd = 815 ± 280 nM at 1:9 and 1:19αMan-C8-SH/OCT, respectively. One of the reasons for the difference in Kd on NPG versus on the gold wire, and between different ratios on NPG could be differences in ligand display at the NPG and gold wire surfaces. Differences in the accessibility of ligand to the Con A molecules at two surfaces might create differences in apparent binding affinity. Ligand accessibility for Con A molecules could be limited in some of the more constricted and narrow NPG pores. The decreased on-rate of biomolecular interactions in a porous matrix because of the diffusion controlled interaction inside the pores might be another possible reason for the observed lower affinity of Con A to mannose in SAMs on NPG.[84, 85]
Comparison of Concanavalin A binding kinetics on gold wire and on NPG surfaces
Due to the restricted diffusion of Con A within the complex network morphology of nanoporous gold, all of the mannose molecules might not be equally accessible and the lectin-carbohydrate binding kinetics might be different compared to that on the gold wire surface. To test this hypothesis, we studied the change in charge transfer resistance as a function of Con A incubation time for NPG and gold wire surfaces. Figure 10 shows the kinetic data for Con A binding to both 1:9 and 1:19 αMan-C8-SH/OCT SAMs on both NPG and on gold wire. With increasing incubation period, there is a clear increase in charge transfer resistance indicating an increase in surface coverage of Con A, bound to mannose at the interface. The gold wire surface reaches saturation more quickly compared to the nanoporous gold in each case. It takes about twice as long for saturation to be achieved on the NPG surface, which can certainly be partly attributed to the longer incubation times required for Con A to diffuse into the NPG pores and bind to the mannoses on the interior surfaces. For the 1:9 αMan-C8-SH/OCT SAM, the higher saturation value of Rct is reached on flat gold, and for the 1:19 αMan-C8-SH/OCT SAM, the higher saturation value of Rct is reached on NPG.
Figure 10.
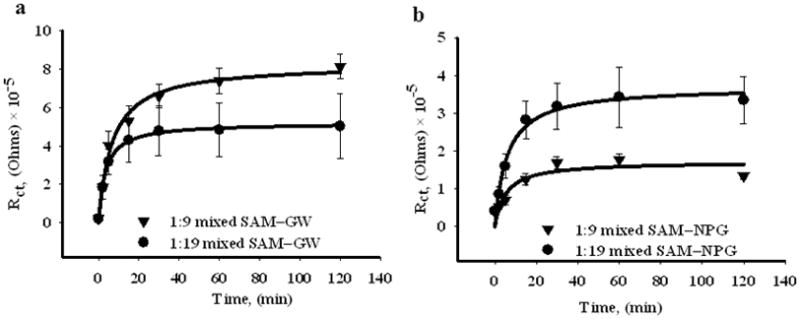
Binding kinetics of Con A to mixed SAMs of αMan-C8-SH and OCT on gold wire in 10(a), and on NPG coated gold wire, 10(b). The charge transfer resistance is obtained by fitting impedance data for different incubation times to the equivalent circuit given in Figure 3(c). The data are shown for both the 1:9 and 1:19 solution molar ratios for each surface. The error bars represent the standard error for 3 measurements.
Electrochemical characterization of the SAMs on NPG and on gold wire
Electrochemical methods were used to probe the integrity of the pure and mixed SAMs. CV scans were performed in 0.5 M H2SO4, in order to assess the ability of the SAM to hinder the process of gold oxide formation and reduction, and thereby provide a measure of the integrity or completeness of the monolayer. Given that the gold oxide formation and stripping approach probes a process taking place on the internal surfaces of NPG, we pursued it as an alternate approach to the more common strategy of measuring the ability of SAMs to block the redox potential of a diffusing probe, which may not reach the interior structure of the NPG and likely only probes the outer diffusion layer bordering the solution. A small number of studies of this process, referred to as oxidative desorption, have been reported. Esplandiu et al. found that scanning to 1.5 V (vs Ag|AgCl) in 0.1 M sulfuric acid resulted in complete oxidation and removal of the SAMs of a number of alkanethiols during the first scan carried out at 10 mV sec−1.[86] The removal of ethanethiol SAMs from Au(111) under the same conditions was found to be complete after one scan, with an enhanced oxidative current due to oxidation of ethanethiol, possibly to ethanesulfonic acid.[87] In contrast, SAMs of decanethiol subjected to CV scans to 1.1 V (vs. mercury|mercurous sulfate) at 20 mV sec−1 in 0.01 M sulfuric acid were found to reduce the initial magnitude of the gold oxide reduction peak by about 80%, with 12 full scans required to oxidatively remove all of the thiol.[88] The oxidative removal of the SAM is a complex multi-electron process initiated at defects and hence should be favored by incomplete surface coverage.
Figure 11 shows the cyclic voltammetry (CV) scans for gold oxide formation and reduction on both αMan-C8-SH and αMan-C8-SH/OCT modified NPG and gold wire electrodes. The CVs on gold wire showed one peak starting at 1.3 V and extending up to 1.5 V as a flat plateau, on the positive scan, characteristics of gold oxide formation on the surface. The reverse scan showed a reduction peak at around 0.93 V, for the reduction of gold oxide. The αMan-C8-SH modified gold wire showed a peak around 1.48–1.50 V, at a larger overpotential, but of greater current. It is possible that the enhanced current represents a contribution from oxidation of αMan-C8-SH, and that the higher overpotential represents the monolayer hindering the onset of gold oxide formation. The reduction peak was observed at around 0.96 V. The mixed SAM (1:9 αMan-C8-SH/OCT) modified gold wires show reduced oxidative current and onset at a higher overpotential, suggesting that this monolayer is more complete and presents fewer defects or bare spots, and hence is better at hindering the formation of gold oxide that the monolayer of pure αMan-C8-SH. The reduction peak is slightly positively shifted in potential and appears near 0.98 V. The percentage decrease in the charge passed under the oxide reduction peak after modification of the surface was modest for αMan-C8-SH modified gold wire (20–23%) whereas the drop in charge passed under the oxide reduction peak was around 78–83% for the mixed SAM modified gold wire.
Figure 11.
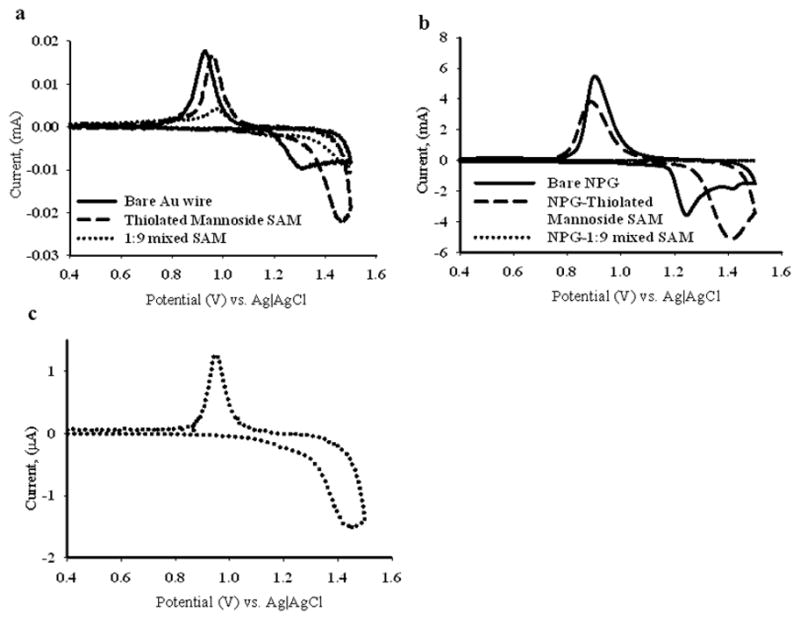
Cyclic voltammograms measured on NPG coated gold wire (both bare and SAM modified) and gold wire (both bare and SAM modified) in 0.5 M H2SO4. Figure 11(a) shows the cyclic voltammograms on bare gold wire (solid line), αMan-C8-SH modified gold wire (dashed line) and 1:9 αMan-C8-SH/OCT modified gold wire (dotted line). Figure 11(b) shows the CVs on NPG:bare NPG (solid line), αMan-C8-SH modified NPG (dashed line) and 1:9 αMan-C8-SH/OCT modified NPG (dotted line), Figure 11(c) is an enlarged view of CV on the 1:9 αMan-C8-SH/OCT SAM modified NPG.
The CV scan on bare NPG in 0.5 M H2SO4 is characterized by two peaks at around 1.25 V and 1.42 V prior to the scan reversal peak at 1.5 V. The gold oxide reduction peak appears near 0.91–0.93 V. αMan-C8-SH modified NPG shows one broad peak at around 1.4 V with larger currents than those observed on the bare NPG. The reduction peak was observed around 0.88–0.90 V. The mixed SAM modified NPG shows a peak at around 1.47 V and the onset of oxidation is shifted here to higher overpotentials as was observed on gold wire modified with the mixed SAM. The gold oxide reduction peak was observed near 0.96–0.98 V. The percentage drop in charge passed under the gold oxide reduction peak was modest, around 11–15% compared to that on the bare NPG, for the pure αMan-C8-SH modified NPG. In contrast, the percentage drop in charge passed under the reduction peak for the mixed SAM modified NPG was 99.0%. This almost complete loss of the oxide reduction peak for the mixed SAM modified NPG compared to the mixed SAM modified gold wire is noteworthy and could be influenced by any aspect of the oxidation reaction inside NPG involving a diffusing species. Our goal in monitoring gold oxide formation and stripping scans on SAM modified NPG was to assess the integrity and coverage of the pure αMan-C8-SH SAMs vs. the mixed SAMs of αMan-C8-SH and OCT. It is clear from the data acquired on both gold wire and NPG surfaces that mixed monolayers are more effective at hindering the process of gold oxide formation and reduction. This observation suggests that the mixed monolayers are of higher surface coverage and possess fewer defect sites at which gold oxidation and reduction can readily occur, and at which the ultimate oxidative removal of the SAM can initiate.
The integrity and coverage of the SAMs was also assessed by performing CV scans in the presence of the widely used redox probe Fe(CN)6 3−/4−.[89, 90] Figure 12a shows the cyclic voltammograms for three different electrodes: bare gold wire, gold wire with αMan-C8-SH and gold wire with the 1:9 αMan-C8-SH/OCT SAM measured in 10 mM K3[Fe(CN)6]. There are two clear and distinct characteristic peaks for the oxidation and reduction of Fe(CN)63−/4− on gold wire, whereas these peaks completely disappear on both αMan-C8-SH and on mixed SAM modified wires (Figure 12b). CV scans on these SAM modified wires showed very little remaining charging current, indicating effective blocking behavior on both modified surfaces towards electron transfer to or from Fe(CN)63−/4−. The current is reduced more for the pure αMan-C8-SH SAM than for the 1:9 αMan-C8-SH/OCT SAM, although both to very low levels. CV scans on bare NPG is similar to that on the bare gold wire except a much larger charging current was observed for the NPG wire, because of the comparatively higher surface area of NPG. The peak current is nearly 30 times greater on NPG and the electrode capacitance is much larger. On the other hand, modified NPG behaves differently when modified with pureαMan-C8-SH or modified with a mixed SAM. Oxidation and reduction peaks are not seen for the redox probe on either modified NPG surface. The αMan-C8-SH modified wires still have some charging current, as seen in the CV scan, indicating some bare areas on the electrode. The mixed SAM modified NPG has a characteristic S-shaped CV curve, indicating a highly resistive interface with very little redox current being passed. It could be the case that the mixed SAM on NPG has fewer bare spots at which electron transfer could readily occur. The pure αMan-C8-SH SAM on the gold wire has an overall lower current profile for the CV of the redox probe than does the mixed SAM. The greater bulk of the mannose groups, even if disordered, thus may be a significant consideration in terms of ability to block the electron transfer reactions of the diffusing redox probe.
Figure 12.
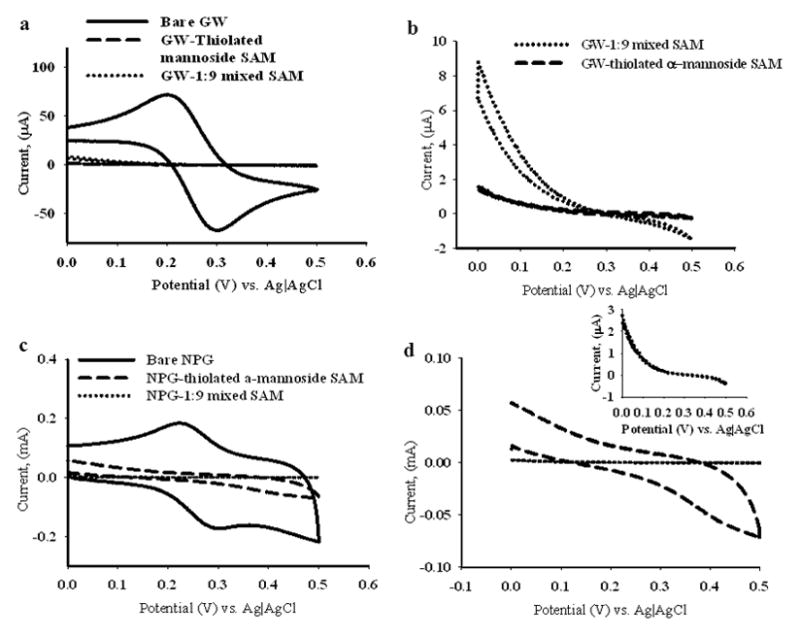
Cyclic voltammograms measured on NPG coated gold wire (both bare and SAM modified) and gold wire (both bare and SAM modified) in the presence of 10 mM K3[Fe(CN)6]. Figure 12(a) shows bare gold wire (solid line), αMan-C8-SH modified gold wire (dashed line) and 1:9 mixed SAM modified gold wire (dotted line). Figure 12(b), is the enlarged view of the CVs of the αMan-C8-SH and 1:9 αMan-C8-SH/OCT mixed SAM modified gold wire from 12(a), in the same line scheme, shown for clarity. Figure 12(c) shows CVs on bare NPG coated gold wire (solid line), αMan-C8-SH modified NPG coated gold wire (dashed line) and 1:9 mixed SAM of αMan-C8-SH and OCT modified NPG coated gold wire (dotted line). Figure 12(d), is the enlarged view of the CVs of the αMan-C8-SH and the 1:9 mixed SAM modified NPG coated gold wire, from 12(c), shown for clarity. The inset in 12(d), is an enlarged view of the 1:9 mixed SAM modified NPG coated gold wire.
Atomic force microscopy imaging of Concanavalin A on carbohydrate functionalized ultraflat gold
Atomic force microscopy (AFM) was employed with the goal of imaging the binding of Con A to the mannose containing SAMs in order to both verify lectin binding and to compare the distribution of individual bound proteins on these SAMs on flat gold and on NPG. Ultraflat gold surfaces were first modified with SAMs of pure αMan-C8-SH and those formed from 1:9 αMan-C8-SH/OCT solutions (total concentration of 10 mM). These SAMs were then exposed to Con A solutions. The ultraflat gold surface was chosen as being suitable for AFM imaging and should be closer to representing what occurs on the gold wires, which are not suitable structures for AFM imaging due to their curvature and inherent difficult of landing an AFM tip on them.[23, 24, 91] Figure 13a shows a typical AFM image of the pure α-mannose terminated SAMs on ultraflat gold. The rough corrugation of the thiolated α-mannoside molecules is expected due to the bulky size of their mannose end-groups, for which steric hindrance and weak molecular interactions (van der Waals forces) between the alkyl chains prevent them from forming ordered domains. A similar topography was also observed for αMan-C8-SH/OCT SAMs, as shown in Figure 13c, in which the lateral clustering of either OCT or αMan-C8-SH is similar in dimension. This strongly suggests that interdigitated mixing of the OCT and αMan-C8-SH occurs. With sufficient time (over days or weeks), the local structure of the mixed SAM may evolve to reflect the interplay between the kinetics and thermodynamics of adsorption.[92] Thus, care must be taken to ensure consistency of reaction conditions such as concentration, component ratio, reaction time, and interaction energy among thiols (chain-length and functionality), for reproducible results. At higher imaging resolution, 500 nm × 500 nm area, the disordered clusters of the single (Figure 13e) and mixed (Figure 13g) component SAMs was revealed. The cursor profiles of these clusters are indicated in Figure 13i (αMan-C8-SH) and 13k (αMan-C8-SH/OCT), with height profiles ranging from 0.5 to 0.8 nm, and 0.7 to 1.2 nm, respectively. The smaller height profile for single component SAMs of αMan-C8-SH when compared to the mixed SAMs strongly suggests that αMan-C8-SH has not adopted the fully standing orientation. From a theoretical calculation, the length of αMan-C8-SH is 1.61 nm (or 1.39 nm accounting for a 30° tilt angle), and therefore the AFM height profiles of the αMan-C8-SH SAM do not support formation of a well-packed monolayer. For the αMan-C8-SH/OCT SAMs, the cursor profile suggests some degree of mixing of OCT and αMan-C8-SH. The theoretical OCT length is 1.0 nm (or 0.88 nm when consider the 30° tilt angle). Thus some of the OCT may be in a standing orientation and interdigitated with αMan-C8-SH, and thus the AFM height profile suggests an average monolayer arrangement that is between that of a well packed OCT configuration (0.88 nm with 30° tilt) and a standing αMan-C8-SH configuration (1.39 nm with 30° tilt).
Figure 13.

Con A binding to the SAM surfaces. (A) and (C), 1 μm × 1 μm, show the topographies of single and mixed component SAMs formed on an ultraflat gold surface, respectively. The single component SAMs were prepared from 5.0 mM solutions of αMan-C8-SH in ethanol. For the binary SAMs, a mixture of αMan-C8-SH/OCT (1:9, 10 mM, ethanol) was used to modify the gold surface for 24 hours at room temperature. At higher AFM imaging resolution, 500 nm × 500 nm, the disordered arrangement of αMan-C8-SH and the domains of these mixed SAMs were revealed (E) and (G), respectively. (B) and (D) show the SAMs surfaces (pure and mixed SAMs, respectively) after exposure to 52.0 μg/ml of Con A for 2 hours at room temperature. Higher Con A coverage was observed on the mixed component SAM surface than on the pure αMan-C8-SH SAMs. (F) and (H) are higher AFM imaging resolution, 500 nm × 500 nm for Figure (B) and (D), respectively. The cursor profiles shown in (I) – (L) correspond to the red lines in (E) – (H), respectively.
After exposure to Con A, the topographies of the αMan-C8-SH/OCT SAMs were distinctly altered, due to the adsorption of protein onto the mannose moieties. Figure 13b and 13d show the adsorbed Con A on the pure and mixed SAM surfaces, respectively. At higher imaging resolution, 500 nm × 500 nm, the Con A aggregates can be seen, with a height up to 2.3 nm on the pure and mixed SAMs surfaces. The lateral dimensions of Con A on the αMan-C8-SH and αMan-C8-SH/OCT SAMs surface are different based on AFM cursor analysis. We attribute this to the different packing of the αMan-C8-SH and the αMan-C8-SH/OCT SAMs. In the case of the pure αMan-C8-SH SAM, the thiolated α-mannoside (1) has not fully adopted a standing up orientation and probably has some mannose end groups pointing parallel to or even towards the gold surface, and (2) the lack of order of the mannose clusters, creates a less sterically hindered environment for Con A adsorption. In this manner, all the available mannose moieties (pointing away from the gold surface) on the surface that are accessible to Con A will attempt to interact with Con A for binding. Thus the bright features in Figure 13f, could indicate that a few of the Con A proteins have aggregated together when interacting with αMan-C8-SH on the SAM surfaces. Conversely, when the mannose in the mixed SAMs is well segregated and the mannose domain is only a few tens of nanometers, this domain in theory may only feasibly accommodate binding of one to two Con A molecules (tetramers with dimensions of 6.3 nm × 8.7 nm × 8.9 nm, PDB ID: 3CNA). At pH > 7, Con A is known to exist as a tetramer, and since all of our Con A incubations were conducted at pH 7.4, the tetrameric form of the specific Con A-mannose interaction is expected.[93, 94] However, the αMan-C8-SH/OCT SAMs surfaces are highly favorable for Con A adsorption because the alkyl chain of the OCT can act as a support to assistαMan-C8-SH to adopt a standing up orientation and present the α-mannose termini to Con A. The higher Con A coverage in Figure 13h when compared to Figure 13f, supports our hypothesis that OCT assists the thiolated α-mannoside to achieve a standing up orientation and make more mannose termini available for lectin binding. Due to the high coverage of the Con A on the SAM surfaces, the dimensions (both lateral and vertical) may not reflect individual Con A proteins adsorbed on the surface, because AFM can probe only the surfaces geometrically accessible to the tip. Thus, the height profile in Figure 13j and l, only indicates the portion of protein accessible to the AFM tip (a few nanometers in height), rather than the true dimensions of Con A.
The scheme on the left side of Figure 14, represents the packing of the single component SAM of αMan-C8-SH functionalized on the ultraflat and then on the nanoporous gold surface. The bulky αMan-C8-SH end groups hinder the ability for the alkyl chains within αMan-C8-SH to reach close proximity with the alkyl chains of their neighboring molecules to experience the require intermolecular forces for close packing. The decreased van der Waals interactions among the αMan-C8-SH molecules promotes disorder in these SAMs, with the mannose end groups adopting a wide range of orientations including being pointed towards the gold surface, away from the gold surface, or with αMan-C8-SH adopting a flat configuration, laying down on the surface and making the mannose unit inaccessible for Con A binding. Such orientations will significantly hinder the lectin-carbohydrate binding ability. Similar phenomena may be expected for the NPG with a typical ligand dimension and pore size in the range of 50 – 200 nm. At this dimension, the local radius of curvature of the porous gold surface is expected to be low along the length of the ligaments, although there are some highly curved regions near ligament intersections. Therefore, the disordered SAM layer may also be presented on the NPG surface, because the low radius of curvature should also serve to decrease van der Waals interactions between neighboring alkyl chains.
Figure 14.

Schematic representation of αMan-C8-SH and αMan-C8-SH/OCT on ultraflat and nanoporous gold surfaces. Left column: A disorderedαMan-C8-SH monolayer is expected to form on flat and porous gold surfaces, due to the minimum interaction of the neighboring molecules for close packing of αMan-C8-SH domain to form. The lack of van der Waals interactions to assure the αMan-C8-SH adopting a standing up orientation may promote mobility of the bulky end groups, and its failure to present itself to Con A for binding. Right column: the alkyl chain of the OCT helps promote formation of a closer packed domain of OCT and αMan-C8-SH. The OCT domain should serve as a pillar to support αMan-C8-SH and assist a majority of αMan-C8-SH present to adopt standing up orientations.
The addition of OCT into the αMan-C8-SH SAMs may be acting as a support to promote the thiolated α-mannoside adopting a standing up orientation that makes mannose more accessible to Con A. As depicted on the right side of Figure 14, the eight-carbon alkyl chain has the same spacer length as αMan-C8-SH. The OCT should easily adopt a standing up orientation and formed a close packed domain on gold. From the AFM data, Figure 13c and 13g, showing the segregated domains of the mixed SAMs, this led us to believe that the alkyl chain of OCT serves as a supporting pillar to assist αMan-C8-SH to adopt a standing up orientation. This argument is reasonable, since the alkyl chains from the OCT and αMan-C8-SH can interact closely and this will increase the van der Waals forces needed for close packing or domain formation. In this regard, the mannose may be presenting on the surface at a different rotation angle, but a majority of the αMan-C8-SH molecules should be located between n-octanethiols. The higher Con A coverage on mixed SAMs compared to the single component SAMs, supports our hypothesis, as seen in Figure 13g.
The low radius of curvature of the NPG ligaments does not hinder the ability of OCT to form close packed domains. Thus, the clustered morphology of the mixed SAMs on a flat gold surface should also be present on NPG, with the exception that the rough corrugation of NPG may hinder the direct observation of the clustered morphology under the AFM characterization method. Further, the lateral and tip convolution effect that is naturally present in this characterization method may be amplified by the rough corrugation of NPG.
Immobilization of Concanavalin A on thiolated α-mannoside functionalized nanoporous gold
The utilization of the ultraflat gold substrates for lectin immobilization and characterization using tapping mode AFM (TM-AFM) served to set a foundation, to provide a proof of concept, and enable optimization of experimental conditions prior to the exploration of lectin immobilization on NPG. The procedures and reaction conditions were then transferred to the studies on NPG.
Figure 15a and 15c, show NPG after functionalization with a pure αMan-C8-SH SAM and αMan-C8-SH/OCT mixed SAM, respectively. Due to the surface roughness, the lateral cluster formation by the αMan-C8-SH and αMan-C8-SH/OCT SAMs is hindered and difficult to resolve. Based on AFM characterization, the corrugation of ultraflat gold prepared by using a template-stripped gold surface has a roughness of 0.4 ± 0.1 nm (root-mean-square measurement of surface roughness determined from AFM images), on areas of at least 10 × 10 μm2 when compared to the roughness factor of 13.8 ± 4.8 nm (root-mean-square measurement of surface roughness determined from AFM images) for the surface of NPG. Therefore, it is apparent that the roughness of NPG hinders the observation of clustered domains of OCT and αMan-C8-SH. Although the packing of the self-assembled monolayer is complicated by the surface corrugation of NPG, the protein adsorbed on the NPG surface can be seen. Figure 15b and 15d represents the Con A adsorbed onto the NPG functionalized with αMan-C8-SHand αMan-C8-SH/OCT mixed SAMs. At higher imaging resolution, Figure 15f at 500 nm × 500 nm, the immobilized Con A molecules on the surface of αMan-C8-SH/NPG were obvious, where the irregularly shaped features of the order of tens of nanometers are seen decorated randomly on the surface. Similar observations can also be seen in Figure 15h, where Con A also adsorbed onto the mannose termini on the NPG pre-modified with a αMan-C8-SH/OCT mixed SAM. Although Con A can be adsorbed on the disordered αMan-C8-SH molecules on the irregularly shaped ligaments of NPG, these mannose groups lack the support of added OCT, and thus the efficiency for Con A adsorption is not as favorable when compared to that for the mixed SAMs on NPG. For NPG functionalized with the pure αMan-C8-SH SAM, we hypothesize that the curvature of NPG impacts, and does not favor,αMan-C8-SH adopting the standing up orientation. Some αMan-C8-SH may also be in a laying down conformation, thus the mannose end group is less likely to present itself for lectin binding. This hypothesis is reasonable especially when the local radius of curvature of the gold surface is low, the curvature should also serve to decrease van der Waals interactions between neighboring alkyl-spacers of the αMan-C8-SH molecules and disrupt the molecular packing, serving to make the reactive end-groups more disordered with the bulky mannose termini laying down on the surface of gold.
Figure 15.

Con A binding to SAM modified NPG surfaces. Topographs (A) and (C), 1 μm × 1μm, are the topographies of single and mixed component SAMs formed on NPG surface, respectively. The disordered domains of αMan-C8-SH and of the 1:9 αMan-C8-SH/OCT SAM were less evident due to roughness of the NPG surface. (E) and (G) are higher resolution AFM images, at 500 nm × 500 nm, of (A) and (C), respectively. (B) and (D) (or (F) and (H) are higher resolution images, respectively) are the topographic images of Con A adsorbed on these SAMs on NPG. The topography after exposure to Con A (52 μg/ml of Con A for 2 hours at room temperature) is drastically different from that of NPG passivated only with a SAM. The cursor line scans ((I) – (L)) of these topographic images, (E) to (H) respectively, are presented below each image.
In the case of mixed components SAMs of αMan-C8-SH/OCT, with the similar local radius of curvature of the gold surface, the density of the OCT molecules should be higher in coverage on surface of NPG and allow them to easily adopt standing orientations due to the small methyl functional end group and short alkyl carbon backbone. These OCT will act as space holders to promote the mannose units adopting a standing up orientation. The mannose moieties in the mixed SAMs formed on the curved surface are significantly less steric hindered when compared to mannose in the pure SAMs. Thus, the van der Waals interaction between the OCT and alkyl-spacer of the thiolated α-mannoside molecules serves to make the reactive mannose end group more mobile, experience less steric hindrance and be more easily accessible to the lectin for binding.
EXPERIMENTAL
General Materials and Methods
Compounds for SAM formation and activation
Gold wire, 0.2 mm diameter (99.99%, Electron Microscopy Sciences, Fort Washington, PA), K[Ag(CN)2] (99.96%) and K[Au(CN)2] (99.98%), Sodium carbonate (Fisher Scientific, Pittsburg, PA, 99%), n-octanethiol (98%), calcium chloride dehydrate (Sigma-Aldrich, 99.5%), manganese chloride tetrahydrate (Sigma-Aldrich, 99%), Concanavalin A (Sigma-Aldrich, from Jack Bean, type VI, lyophilized powder), potassium ferrocyanide (Sigma-Aldrich, 99%), potassium ferricyanide (Sigma-Aldrich, 99%), ethanol (HPLC/spectrophotometric grade, Sigma-Aldrich), phosphate buffered saline (Sigma-Aldrich, St. Louis, MO), sulfuric acid (certified ACS plus), nitric acid (trace metal grade), and 30% hydrogen peroxide were all from Fisher Scientific (Pittsburg, PA). All reagents were used without further purification. Milli-Q water, 18.2 MΩ, was used for preparation of all aqueous solutions.
The synthesis of 8-mercaptooctyl α-D-mannopyranoside (αMan-C8-SH) is described in detail in the supporting information file.
Preparation of nanoporous gold
Preparation of alloy of gold and silver: an alloy of gold and silver was electrodeposited on the gold wire surfaces of 0.2 mm diameter and 0.5 cm length. The solution used for electrodeposition was prepared by combining 4.9 ml of 50 mM K[Ag(CN)2] and 2.1 ml of 50 mM K[Au(CN)2] (each in 0.25 M sodium carbonate) to give a composition of 70% Ag and 30% Au in the 7.0 mL deposition solution used in the electrochemical cell. The deposition was carried out at a potential of −1.0 V (versus Ag|AgCl) for 10 minutes. Electrodeposition was carried out in three electrode cell arrangement with gold wire as a working electrode, platinum wire as a counter-electrode and Ag/AgCl/KCl (saturated) as a reference electrode using a PARSTAT 2273 potentiostat and the Powersuite software.
Preparation of ultraflat gold surfaces
The ultraflat gold surface was functionalized with the thiolated moieties to form self-assembled monolayers. The ultimate goal of preparing the ω-functionalized bioreactive SAMs on this ultraflat gold was to allow a side-by-side comparison of immobilized biological structures with those on nanoporous gold by AFM. We have prepared ultraflat gold by using a template-stripped gold surface. The gold was first grown epitaxially onto mica (which is among the flattest surfaces known), the gold layer was then glued onto a glass coverslip, 1 cm × 1 cm, and the mica (Ted Pella, INC., Redding, CA) was stripped off. The uncovered layer is the very first atomic layer of gold deposited onto the mica and is nearly as flat as mica with a typical roughness range from 2 to 5 Å, over areas of at least 10 × 10 μm2. This atomically flat gold layer has similar favorable chemical properties of gold as compared to the porous gold prepared as per the description above and the thermally evaporated gold on mica reported elsewhere.[23, 25]
Dealloying
Thus prepared alloys were dealloyed by submerging alloy coated gold wires into concentrated nitric acid solution (trace metal grade) for 24 hours in a sealed container. These dealloyed wires were rinsed several times with Milli-Q water (18.2 MΩ) and then stored in Milli-Q water for at least 30 min to get rid of any HNO3 trapped into the pores and then rinsed again. These wires were dipped into the ethanol for 30 min to reduce any gold oxide on the surface before further use.[95] Gold wires were cleaned by dipping them in piranha solution (H2SO4: H2O2 (30%), 4:1 for 10 minutes and rinsed with plenty of water and then with HPLC grade ethanol (Piranha solution reacts vigorously with organic substances so caution should be taken while preparing and handling).
Characterization of NPG
Surface morphology and general structure of NPG was studied by Scanning Electron Microscopy (JEOL JSM-6320F field emission SEM). Electrochemical surface area was determined by the gold oxide stripping method by scanning between 0 and 1.5 V at a scan rate of 100 mV sec−1. The charge under the oxide reduction peak was integrated to estimate the surface area of the gold wires used in this study, using the reported conversion factor of 450 μC cm−2.[79–81]
Preparation of self-assembled monolayers
The SAM preparation used in this study follows established procedures[23, 25, 60] Regardless of whether nanoporous gold, gold wires, or ultraflat gold was used, these gold surfaces were immersed in either single component solutions of αMan-C8-SH (5 mM) or mixed component thiol solution of αMan-C8-SH/OCT of total concentration 10 mM for 24 hours at room temperature. For simplicity, 8-mercaptooctyl α-D-mannopyranoside will be referred to as thiolated α-mannoside or as αMan-C8-SH, and n-octanethiol will be referred to as OCT, throughout this paper. The resulting SAMs on the gold surfaces were copiously rinsed with ethanol, water and PBS buffer before studying their binding to proteins.
Electrochemical impedance spectroscopic measurement
EIS measurements were done in a three-electrode cell of 3 ml solution volume containing 5 mM K3[Fe(CN)6] and 5 mMK4[Fe(CN)6] at the formal potential of the redox probe, and at frequencies from 105 Hz to 100 mHz, at 12 points per decade. A PARSTAT2273 potentiostat/galvanostat/FRA was used for the EIS measurement and the Powersine software was used for data collection. Data analysis was done by using Zsimpwin 3.21 software (Princeton Applied Research, Oak Ridge, TN), by fitting to the modified Randles equivalent circuit shown in Figure 2b, in which the double layer capacitor has been replaced by the constant phase element (Q) to account for the non-ideal behavior associated with the roughness of the electrode. This circuit has been applied for fitting EIS data obtained on both modified NPG and gold wire surfaces. Charge transfer resistance was used as a measure of the resistance at the interface created by the addition of a layer of molecules because of lectin-carbohydrate binding. EIS measurements to assess binding kinetics were performed by incubating the electrode in the protein solution for the desired time followed by removal and acquisition of EIS data in the Fe(CN)63−/4− redox probe solution.
Cyclic voltammetry
The surface area of the gold electrodes was determined using the oxide stripping method. Cyclic voltammetry (CV) scans between 0 V and 1.5 V (vs. Ag|AgCl) were conducted at a scan rate of 100 mV sec−1 in 0.5 M H2SO4 that was degassed with argon. Additional CV scans to probe SAM integrity on gold wire and on NPG coated gold wire electrodes were conducted between 0 and 0.5 V (vs. Ag|AgCl) in 10 mM K3[Fe(CN)6] at a scan rate of 100 mV sec−1. Each determination of surface area was repeated ten times. Each CV measurement on SAM modified surfaces in sulfuric acid or in the presence of K3[Fe(CN)6] was repeated for three different electrodes, and representative curves are shown in each case.
Atomic force microscopy imaging and analysis
The AFM imaging was performed in Tapping Mode™ with a Multimode™ AFM (Veeco, Santa Barbara, California, USA) operating with a NanoscopeIIIa™ controller. We used TAP300G (Budget Sensors, Sofia, Bulgaria) silicon cantilevers with a resonance frequency of about 300 kHz. The scan frequency was typically between 1.0 to 1.5Hz per line and the modulation amplitude was a few nanometers. We used a first or second order polynomial function to remove the background slope. The AFM scanner was calibrated (under contact mode condition) laterally via the periodicity of a mica (0001) surface (0.518 nm) and vertically using mica etch pits as a height calibration source. The etch pits are produced by wet etching the mica substrates in concentrated hydrofluoric acid and are formed with a specific geometry. Along the long axis of the etch pits, steps of approximately 1 nm are observed which correspond to the molecular planes of mica and permit for height calibration. The immobilized proteins were measured quantitatively from more than 30 cursor profiles per image to obtain sufficient statistics.
Protein solutions
The lyophilized powder of Concanavalin A (Con A) from Canavalia ensiformis (Jack Bean), of greater than 95.0 % purity was purchased from Sigma Aldrich (St. Louis, Missouri, USA) and used as received. The Con A protein solution, 52.0μg/ml (equivalent to 0.5 μM), was prepared in sodium phosphate buffer (pH 7.4,) supplemented with 1.0 mM Calcium chloride and 0.5 mM manganese chloride.
In order to achieve protein immobilization, the relatively high concentrations of Con A (as listed above) were used so as to provide an excess of protein in solution available to react with the thiolated α-mannoside moieties functional groups on the gold surfaces. Protein incubation time was 2 h at room temperature.
Furthermore, αMan-C8-SH functionalized ultra-flat gold and nanoporous gold was characterized using AFM without protein as a control experiment. No bright features were observed in this blank test, confirming that the spots of greater intensity in the AFM topographs are due to protein attachment.
Lectin carbohydrate interaction studies
Gold surfaces with self-assembled monolayers of αMan-C8-SH or αMan-C8-SH/OCT were prepared on NPG and gold wire surfaces and impedance spectra recorded on these wires. After rinsing with copious amounts of PBS buffer the same wires were incubated with Concanavalin A solution in PBS buffer supplemented with 1.0 mM Ca2+ and 0.5 mM Mn2+. These wires were then removed from the incubation solution and rinsed with copious amounts of PBS buffer and EIS measurement was then performed.
CONCLUSIONS
Our results point out similarities and differences in the behavior of SAMs containing a mannose-terminated alkanethiol on gold wire surfaces versus the surfaces of nanoporous gold. On both flat gold and NPG, the addition of a diluting alkanethiol improves monolayer integrity and packing order. The mixed SAM presents a more effective interface for presentation of mannose for binding of Con A, presumably due to improved orientation in the presentation of mannose units and a lower surface density of mannose units that reduces steric hindrance and allows for the multivalent binding of Con A. However, the optimal mole fraction of mannose for Con A binding is lower in SAMs on NPG than on flat gold, with the mixed SAMs of αMan-C8-SH/OCT of 1:19 molar ratio providing the optimal response on NPG as compared with a ratio of 1:9 providing an optimal response on gold wire. These ratios are based on the concentrations in the solution from which the SAMs were prepared. It is known that for mixed SAMs, the composition of the two species on the gold surface can differ from that in the solution from which the SAM is prepared, especially if one of the two species is more surface active. The most widely used method for estimating the composition of a mixed SAM at the gold surface is x-ray photoelectron spectroscopy (XPS) which can provide elemental ratios at the gold surface, such as the carbon/oxygen ratio; however, this method is not widely accessible. Given that dilution of a carbohydrate containing SAM with an poly(ethylene glycol) species may decrease the utility of analyzing the intensity ratio of the C/O peaks alone, high resolution data and use of the unique acetal signal from the sugar unit has been exploited for analyzing such SAMs.[33] A few papers have reported electrochemical methods for determining mixed SAM composition, such as for mixed SAM in which electrochemical desorption can distinguish unique thiolated reduction peaks for the two species,[32] which is not the case for the molecules used in the present study (data not shown). Sato and coworkers used 10% 12-mercaptododecyl β-maltoside in a mixed SAM with a series of short poly(ethylene glycol) derivatives for SPR studies of lectin binding, and reported that the glycoside fraction in the monolayer was closer to 30% on the basis of desorption data. A capacitance based method was also reported,[96] but we were unsuccessful in applying it to our system. There should be a consistent relation between compositions of the SAMs on the gold surface, and that of the two components in the solution from which they form.[33] It has been reported by Stellaci and coworkers that the structure of mixed SAMs can be dependent on surface curvature on nanoparticles,[97] and it is thus possible that a different SAM organization on NPG versus on gold wire in some manner which remains to be determined alters the binding response.
In the present study, the second component of the SAM is octanethiol (OCT) as opposed to a more widely used poly(ethylene glycol) terminated thiol species.[98, 99] The EIS data on gold wires show that while there is a clearly measureable response due to non-specific adsorption of Con A on OCT SAMs, the magnitude of the response of the charge transfer resistance due to the binding of Con A to mannose in the mixed SAMs is much greater than that due to Con A binding to OCT SAMs alone. It is also much greater than that due to Con A binding to bare Au. It has been reported that the adsorption of Con A on bare gold is less when the cofactors Ca2+ and Mn2+ are present.[100] It has also been reported that Con A is denatured upon interaction with bare Au surfaces. While our mixed monolayer are resistive and show well-formed semicircles in the Nyquist plots, the presence of some patches of bare Au cannot be ruled out. An appropriate length oligo(ethylene oxide) terminated thiol species for forming mixed SAMs with the present mannoside derivative would be 1-mercapto triethylene glycol, which has been reported as effective at preventing non-specific protein adsorption in SAMs,[98] and has also been used together with short chain glycosides to modify gold nanoparticles. This molecule should have a length of 1.2 nm, and would be short enough to not interfere with the mannose units of C8-SH-αMan, estimated to have a length of 1.61 nm. A comparison of the present results with the use of 1-mercapto triethylene glycol as the diluting species in the mixed SAMs will be part of a future investigation. It is expected that usage of an poly(ethylene glycol) derivative can reduce the non-specific adsorption of Con A on the surface to a fully negligible level. However, our results suggest that even with octanethiol as a diluting species, the effect of Con A adsorption dominates the EIS data in terms of response in the charge transfer resistance.
The binding affinity of Con A to mannose presented in SAMs on NPG is reduced, as evidenced by the greater values of Kd for binding of Con A to the mixed SAMs on NPG. Within the NPG structure, there are intersections of ligaments at which the curvature is both negative and very high. It is possible that thiolated mannose species in these regions are less accessible to Con A due to geometric congestion. It is also possible that some of the smaller pores inside the structure may present mannose such that it is less accessible to Con A, or that some pathways within the material may become blocked. The interconnected porous structure can potentially increase the diffusion time required for proteins to access mannose units on these interior surfaces, reducing the on-rate and hence effectively increasing the value of Kd.[85, 101, 102]
The AFM images of the SAMs before and after lectin Con A binding reveal that Con A bound to the surface is clearly seen as additional topographic features. The heights of the features due to Con A are less than the dimensional profile of Con A. For widely dispersed individual Con A molecules, this profile of 9.0 nm has been observed.[103] However, Con A bound to the SAMs inhibits the AFM tip from accessing the full protein profile, and hence the Con A proteins appear as features of lesser height in the AFM scans. Con A adsorption is favored on the mixed SAMs surfaces, and the added OCT serves as a supporting pillar to assist the thiolated α-mannoside to adopt a standing up orientation. The mannose end group in the mixed SAMs will be more available for interaction with Con A. At high imaging resolution, the clusters of the OCT and thiolated α-mannoside are hard to distinguish, this can be attributed to the similarity in domain size of these two moieties. The interdigitated mixing of the OCT and αMan-C8-SH favorsαMan-C8-SH adopting a standing orientation. The rough corrugation of NPG added additional complexity in affecting the mixed SAMs packing, however, the ligaments of the nanoporous gold may be sufficiently large (ten to hundredth of nm in dimension), for the local packing of SAMs to be similar, but diverse globally in different regions.
The present results indicate that NPG provides a useful surface upon which glycoside derivatives can be immobilized in mixed SAMs for EIS studies of protein binding. The response characteristics of the surface appear to be different than those of closer to flat gold surfaces. The versatility of NPG as a nanostructure, in terms of variability of pore size, surface area, and format (thin films, wires, monoliths) suggest that it can find a range of applications in analytical chemistry related to glycoscience.
Supplementary Material
Acknowledgments
The authors thank Professor Fraundorf, Dr. David Osborn and Dr. Dan Zhou of the UM-St. Louis Center for Nanoscience for usage and discussion of the AFM and SEM. We also acknowledge Dr. Rudolph Winter and Mr. Joe Kramer for mass spectroscopic analysis of the thiolated α-mannoside derivatives and Dr. Rensheng Luo for NMR. This work was supported by UM-St. Louis and by the NIGMS award R01-GM090254.
Footnotes
Supporting Information Available: Synthetic procedure and NMR spectra for compounds 1–3. EIS data for mixed SAMs of varying composition on gold wire and on NPG surfaces. This information is available free of charge from the publisher’s website or from the author.
References
- 1.Saxon E, Bertozzi CR. Chemical and biological strategies for engineering cell surface glycosylation. Annu Rev Cell Dev Biol. 2001;17(1):1–23. doi: 10.1146/annurev.cellbio.17.1.1. [DOI] [PubMed] [Google Scholar]
- 2.Muramatsu T. Developmentally regulated expression of cell surface carbohydrates during mouse embryogenesis. J Cell Biochem. 1988;36(1):1–14. doi: 10.1002/jcb.240360102. [DOI] [PubMed] [Google Scholar]
- 3.Dabelsteen E. Cell surface carbohydrates as prognostic markers in human carcinomas. J Pathol. 1996;179(4):358–369. doi: 10.1002/(SICI)1096-9896(199608)179:4<358::AID-PATH564>3.0.CO;2-T. [DOI] [PubMed] [Google Scholar]
- 4.Brandley B, Schnaar R. Cell-surface carbohydrates in cell recognition and response. J Leukoc Biol. 1986;40(1):97–111. doi: 10.1002/jlb.40.1.97. [DOI] [PubMed] [Google Scholar]
- 5.Varki A. Biological roles of oligosaccharides: All of the theories are correct. Glycobiology. 1993;3(2):97–130. doi: 10.1093/glycob/3.2.97. [DOI] [PMC free article] [PubMed] [Google Scholar]
- 6.Dube DH, Bertozzi CR. Glycans in cancer and inflammation -potential for therapeutics and diagnostics. Nat Rev Drug Discov. 2005;4(6):477–488. doi: 10.1038/nrd1751. [DOI] [PubMed] [Google Scholar]
- 7.Sharon N. Lectins: Carbohydrate-specific reagents and biological recognition molecules. J Biol Chem. 2007;282(5):2753–2764. doi: 10.1074/jbc.X600004200. [DOI] [PubMed] [Google Scholar]
- 8.Sharon N, Lis H. History of lectins: From hemagglutinins to biological recognition molecules. Glycobiology. 2004;14(11):53R–62R. doi: 10.1093/glycob/cwh122. [DOI] [PubMed] [Google Scholar]
- 9.Sharon N, Lis H. Lectins as cell recognition molecules. Science. 1989;246(4927):227–234. doi: 10.1126/science.2552581. [DOI] [PubMed] [Google Scholar]
- 10.Porter, Robinson, Pickup, Edwards An evaluation of lectin-mediated magnetic bead cell sorting for the targeted separation of enteric bacteria. J Appl Microbiol. 1998;84(5):722–732. doi: 10.1046/j.1365-2672.1998.00403.x. [DOI] [PubMed] [Google Scholar]
- 11.Pilobello KT, Krishnamoorthy L, Slawek D, Mahal LK. Development of a lectin microarray for the rapid analysis of protein glycopatterns. ChemBioChem. 2005;6(6):985–989. doi: 10.1002/cbic.200400403. [DOI] [PubMed] [Google Scholar]
- 12.Lis H, Sharon N. Lectins as molecules and as tools. Annu Rev Biochem. 1986;55(1):35–67. doi: 10.1146/annurev.bi.55.070186.000343. [DOI] [PubMed] [Google Scholar]
- 13.Ambrosi M, Cameron NR, Davis BG. Lectins: Tools for the molecular understanding of the glycocode. Org Biomol Chem. 2005;3(9):1593–1608. doi: 10.1039/b414350g. [DOI] [PubMed] [Google Scholar]
- 14.Smith EA, Thomas WD, Kiessling LL, Corn RM. Surface plasmon resonance imaging studies of protein-carbohydrate interactions. J Am Chem Soc. 2003;125(20):6140–6148. doi: 10.1021/ja034165u. [DOI] [PubMed] [Google Scholar]
- 15.Lee RT, Lee YC. Affinity enhancement by multivalent lectin–carbohydrate interaction. Glycoconj J. 2000;17(7):543–551. doi: 10.1023/a:1011070425430. [DOI] [PubMed] [Google Scholar]
- 16.Wilson DS, Nock S. Recent developments in protein microarray technology. Angew Chem Int Ed. 2003;42(5):494–500. doi: 10.1002/anie.200390150. [DOI] [PubMed] [Google Scholar]
- 17.Kurella M, Hsiao LL, Yoshida T, Randall JD, Chow G, Sarang SS, Jensen RV, Gullans SR. DNA microarray analysis of complex biologic processes. J Am Soc Nephrol. 2001;12(5):1072–8. doi: 10.1681/ASN.V1251072. [DOI] [PubMed] [Google Scholar]
- 18.Schena M, Shalon D, Davis RW, Brown PO. Quantitative monitoring of gene expression patterns with a complementary DNA microarray. Science. 1995;270(5235):467–470. doi: 10.1126/science.270.5235.467. [DOI] [PubMed] [Google Scholar]
- 19.Jelinek R, Kolusheva S. Carbohydrate biosensors. Chem Rev. 2004;104(12):5987–6016. doi: 10.1021/cr0300284. [DOI] [PubMed] [Google Scholar]
- 20.Kiessling LL, Cairo CW. Hitting the sweet spot. Nat Biotech. 2002;20(3):234–235. doi: 10.1038/nbt0302-234. [DOI] [PubMed] [Google Scholar]
- 21.Ulman A. Formation and structure of self-assembled monolayers. Chem Rev. 1996;96(4):1533–1554. doi: 10.1021/cr9502357. [DOI] [PubMed] [Google Scholar]
- 22.Tan YH, Pandey B, Sharma A, Bhattarai J, Stine KJ. Bioconjugation reactions for covalent coupling of proteins to gold surfaces. Global J Biochem. 2012;3:6. [Google Scholar]
- 23.Tan YH, Liu M, Nolting B, Go JG, Gervay-Hague J, Liu G-y. A nanoengineering approach for investigation and regulation of protein immobilization. ACS Nano. 2008;2(11):2374–2384. doi: 10.1021/nn800508f. [DOI] [PMC free article] [PubMed] [Google Scholar]
- 24.Tan YH, Schallom JR, Ganesh NV, Fujikawa K, Demchenko AV, Stine KJ. Characterization of protein immobilization on nanoporous gold using atomic force microscopy and scanning electron microscopy. Nanoscale. 2011;3(8):3395–3407. doi: 10.1039/c1nr10427f. [DOI] [PMC free article] [PubMed] [Google Scholar]
- 25.Yu J-j, Tan YH, Li X, Kuo P-K, Liu G-y. A nanoengineering approach to regulate the lateral heterogeneity of self-assembled monolayers. J Am Chem Soc. 2006;128(35):11574–11581. doi: 10.1021/ja0631403. [DOI] [PubMed] [Google Scholar]
- 26.Strong L, Whitesides GM. Structures of self-assembled monolayer films of organosulfur compounds adsorbed on gold single crystals: Electron diffraction studies. Langmuir. 1988;4(3):546–558. [Google Scholar]
- 27.Patel N, Davies MC, Hartshorne M, Heaton RJ, Roberts CJ, Tendler SJB, Williams PM. Immobilization of protein molecules onto homogeneous and mixed carboxylate-terminated self-assembled monolayers. Langmuir. 1997;13(24):6485–6490. [Google Scholar]
- 28.Love JC, Estroff LA, Kriebel JK, Nuzzo RG, Whitesides GM. Self-assembled monolayers of thiolates on metals as a form of nanotechnology. Chem Rev. 2005;105(4):1103–1170. doi: 10.1021/cr0300789. [DOI] [PubMed] [Google Scholar]
- 29.Houseman BT, Mrksich M. The role of ligand density in the enzymatic glycosylation of carbohydrates presented on self-assembled monolayers of alkanethiolates on gold. Angew Chem Int Ed. 1999;38(6):782–785. doi: 10.1002/(SICI)1521-3773(19990315)38:6<782::AID-ANIE782>3.0.CO;2-N. [DOI] [PubMed] [Google Scholar]
- 30.Nyquist RM, Eberhardt AS, Silks LA, Li Z, Yang X, Swanson BI. Characterization of self-assembled monolayers for biosensor applications. Langmuir. 2000;16(4):1793–1800. [Google Scholar]
- 31.Lin CC, Yeh YC, Yang CY, Chen GF, Chen YC, Wu YC, Chen CC. Quantitative analysis of multivalent interactions of carbohydrate-encapsulated gold nanoparticles with concanavalin a. Chem Commun. 2003;23:2920–2921. doi: 10.1039/b308995a. [DOI] [PubMed] [Google Scholar]
- 32.Sato Y, Yoshioka K, Tanaka M, Murakami T, Ishida MN, Niwa O. Recognition of lectin with a high signal to noise ratio: Carbohydrate-tri(ethylene glycol)-alkanethiol co-adsorbed monolayer. Chem Commun. 2008;40:4909–4911. doi: 10.1039/b809481k. [DOI] [PubMed] [Google Scholar]
- 33.Dhayal M, Ratner DM. Xps and spr analysis of glycoarray surface density. Langmuir. 2009;25(4):2181–2187. doi: 10.1021/la8031122. [DOI] [PMC free article] [PubMed] [Google Scholar]
- 34.Guo X, Kulkarni A, Doepke A, Halsall HB, Iyer S, Heineman WR. Carbohydrate-based label-free detection of escherichia coli orn 178 using electrochemical impedance spectroscopy. Anal Chem. 2011;84(1):241–246. doi: 10.1021/ac202419u. [DOI] [PubMed] [Google Scholar]
- 35.Horan N, Yan L, Isobe H, Whitesides GM, Kahne D. Nonstatistical binding of a protein to clustered carbohydrates. Proc Natl Acad Sci USA. 1999;96(21):11782–11786. doi: 10.1073/pnas.96.21.11782. [DOI] [PMC free article] [PubMed] [Google Scholar]
- 36.Zhang Y, Luo S, Tang Y, Yu L, Hou K-Y, Cheng J-P, Zeng X, Wang PG. Carbohydrate protein interactions by “clicked” carbohydrate self-assembled monolayers. Anal Chem. 2006;78(6):2001–2008. doi: 10.1021/ac051919+. [DOI] [PubMed] [Google Scholar]
- 37.Szunerits S, Niedziǒłka-Jönsson J, Boukherroub R, Woisel P, Baumann J-Sb, Siriwardena A. Label-free detection of lectins on carbohydrate-modified boron-doped diamond surfaces. Anal Chem. 2010;82(19):8203–8210. doi: 10.1021/ac1016387. [DOI] [PubMed] [Google Scholar]
- 38.Prime KL, Whitesides GM. Adsorption of proteins onto surfaces containing end-attached oligo(ethylene oxide): A model system using self-assembled monolayers. J Am Chem Soc. 1993;115(23):10714–10721. [Google Scholar]
- 39.Ostuni E, Chapman RG, Holmlin RE, Takayama S, Whitesides GM. A survey of structure property relationships of surfaces that resist the adsorption of protein. Langmuir. 2001;17(18):5605–5620. doi: 10.1021/la0015258. [DOI] [PubMed] [Google Scholar]
- 40.Liang MN, Smith SP, Metallo SJ, Choi IS, Prentiss M, Whitesides GM. Measuring the forces involved in polyvalent adhesion of uropathogenic escherichia coli to mannose-presenting surfaces. Proc Natl Acad Sci USA. 2000;97(24):13092–13096. doi: 10.1073/pnas.230451697. [DOI] [PMC free article] [PubMed] [Google Scholar]
- 41.Mann DA, Kanai M, Maly DJ, Kiessling LL. Probing low affinity and multivalent interactions with surface plasmon resonance: Ligands for concanavalin a. J Am Chem Soc. 1998;120(41):10575–10582. [Google Scholar]
- 42.Revell DJ, Knight JR, Blyth DJ, Haines AH, Russell DA. Self-assembled carbohydrate monolayers: Formation and surface selective molecular recognition. Langmuir. 1998;14(16):4517–4524. [Google Scholar]
- 43.Zheng H, Du X. Enhanced binding and biosensing of carbohydrate-functionalized monolayers to target proteins by surface molecular imprinting. J Phys Chem B. 2009;113(32):11330–11337. doi: 10.1021/jp9060279. [DOI] [PubMed] [Google Scholar]
- 44.Schlick KH, Cloninger MJ. Inhibition binding studies of glycodendrimer/lectin interactions using surface plasmon resonance. Tetrahedron. 2010;66(29):5305–5310. doi: 10.1016/j.tet.2010.05.038. [DOI] [PMC free article] [PubMed] [Google Scholar]
- 45.Yonzon CR, Jeoung E, Zou S, Schatz GC, Mrksich M, Van Duyne RP. A comparative analysis of localized and propagating surface plasmon resonance sensors: The binding of concanavalin a to a monosaccharide functionalized self-assembled monolayer. J Am Chem Soc. 2004;126(39):12669–12676. doi: 10.1021/ja047118q. [DOI] [PubMed] [Google Scholar]
- 46.Mizukami K, Takakura H, Matsunaga T, Kitano H. Binding of ricinus communis agglutinin to a galactose-carrying polymer brush on a colloidal gold monolayer. Colloids Surf B Biointerfaces. 2008;66(1):110–118. doi: 10.1016/j.colsurfb.2008.05.018. [DOI] [PubMed] [Google Scholar]
- 47.Loaiza OA, Lamas-Ardisana PJ, Jubete E, Ochoteco E, Loinaz I, Cabañero Gn, García I, Penadés S. Nanostructured disposable impedimetric sensors as tools for specific biomolecular interactions: Sensitive recognition of concanavalin a. Anal Chem. 2011;83(8):2987–2995. doi: 10.1021/ac103108m. [DOI] [PubMed] [Google Scholar]
- 48.Lyu YK, Lim KR, Lee BY, Kim KS, Lee WY. Microgravimetric lectin biosensor based on signal amplification using carbohydrate-stabilized gold nanoparticles. Chem Commun. 2008;39:4771–4773. doi: 10.1039/b807438k. [DOI] [PubMed] [Google Scholar]
- 49.Min I-H, Choi L, Ahn K-S, Kim BK, Lee BY, Kim KS, Choi HN, Lee W-Y. Electrochemical determination of carbohydrate-binding proteins using carbohydrate-stabilized gold nanoparticles and silver enhancement. Biosens Bioelectron. 2010;26(4):1326–1331. doi: 10.1016/j.bios.2010.07.038. [DOI] [PubMed] [Google Scholar]
- 50.Qian X, Metallo SJ, Choi IS, Wu H, Liang MN, Whitesides GM. Arrays of self-assembled monolayers for studying inhibition of bacterial adhesion. Anal Chem. 2002;74(8):1805–1810. doi: 10.1021/ac011042o. [DOI] [PubMed] [Google Scholar]
- 51.Zhi Z-L, Laurent N, Powell AK, Karamanska R, Fais M, Voglmeir J, Wright A, Blackburn JM, Crocker PR, Russell DA, Flitsch S, Field RA, Turnbull JE. A versatile gold surface approach for fabrication and interrogation of glycoarrays. ChemBioChem. 2008;9(10):1568–1575. doi: 10.1002/cbic.200700788. [DOI] [PubMed] [Google Scholar]
- 52.Zhi Z-L, Powell AK, Turnbull JE. Fabrication of carbohydrate microarrays on gold surfaces: Direct attachment of nonderivatized oligosaccharides to hydrazide -modified self-assembled monolayers. Anal Chem. 2006;78(14):4786–4793. doi: 10.1021/ac060084f. [DOI] [PubMed] [Google Scholar]
- 53.Cheng F, Ratner DM. Carbohydrate microarrays. Secaucus, NJ: 2011. Glycosylated self-assembled monolayers for arrays and surface analysis; pp. 87–101. [DOI] [PMC free article] [PubMed] [Google Scholar]
- 54.Lee M-R, Park S, Shin I. Protein microarrays to study carbohydrate-recognition events. Bioorg Med Chem Lett. 2006;16(19):5132–5135. doi: 10.1016/j.bmcl.2006.07.028. [DOI] [PubMed] [Google Scholar]
- 55.Park S, Lee M-r, Pyo S-J, Shin I. Carbohydrate chips for studying high-throughput carbohydrate protein interactions. J Am Chem Soc. 2004;126(15):4812–4819. doi: 10.1021/ja0391661. [DOI] [PubMed] [Google Scholar]
- 56.Ratner DM, Adams EW, Su J, O’Keefe BR, Mrksich M, Seeberger PH. Probing protein–carbohydrate interactions with microarrays of synthetic oligosaccharides. ChemBioChem. 2004;5(3):379–383. doi: 10.1002/cbic.200300804. [DOI] [PubMed] [Google Scholar]
- 57.Liang P-H, Wang S-K, Wong C-H. Quantitative analysis of carbohydrate protein interactions using glycan microarrays: Determination of surface and solution dissociation constants. J Am Chem Soc. 2007;129(36):11177–11184. doi: 10.1021/ja072931h. [DOI] [PubMed] [Google Scholar]
- 58.Laurent N, Voglmeir J, Flitsch SL. Glycoarrays-tools for determining protein-carbohydrate interactions and glycoenzyme specificity. Chem Commun. 2008;37:4400–4412. doi: 10.1039/b806983m. [DOI] [PubMed] [Google Scholar]
- 59.Zhang X, Yadavalli VK. Functionalized self-assembled monolayers for measuring single molecule lectin carbohydrate interactions. Anal Chim Acta. 2009;649(1):1–7. doi: 10.1016/j.aca.2009.07.027. [DOI] [PubMed] [Google Scholar]
- 60.Stine KJ, Jefferson K, Shulga OV. In: Nanoporous gold for enzyme immobilization enzyme stabilization and immobilization. Minteer SD, editor. Humana Press; Secaucus, NJ: 2011. pp. 67–83. [Google Scholar]
- 61.Lang X, Qian L, Guan P, Zi J, Chen M. Localized surface plasmon resonance of nanoporous gold. Appl Phys Lett. 2011;98(9):093701–3. [Google Scholar]
- 62.Shulga OV, Zhou D, Demchenko AV, Stine KJ. Detection of free prostate specific antigen (fpsa) on a nanoporous gold platform. Analyst. 2008;133(3):319–322. doi: 10.1039/b712760j. [DOI] [PubMed] [Google Scholar]
- 63.Ciesielski PN, Scott AM, Faulkner CJ, Berron BJ, Cliffel DE, Jennings GK. Functionalized nanoporous gold leaf electrode films for the immobilization of photosystem I. ACS Nano. 2008;2(12):2465–2472. doi: 10.1021/nn800389k. [DOI] [PubMed] [Google Scholar]
- 64.Hodge AM, Hayes JR, Caro JA, Biener J, Hamza AV. Characterization and mechanical behavior of nanoporous gold. Adv Eng Mater. 2006;8(9):853–857. [Google Scholar]
- 65.Wittstock A, Zielasek V, Biener J, Friend CM, Bäumer M. Nanoporous gold catalysts for selective gas-phase oxidative coupling of methanol at low temperature. Science. 2010;327(5963):319–322. doi: 10.1126/science.1183591. [DOI] [PubMed] [Google Scholar]
- 66.Shulga OV, Jefferson K, Khan AR, D’Souza VT, Liu J, Demchenko AV, Stine KJ. Preparation and characterization of porous gold and its application as a platform for immobilization of acetylcholine esterase. Chem Mater. 2007;19(16):3902–3911. doi: 10.1021/cm070238n. [DOI] [PMC free article] [PubMed] [Google Scholar]
- 67.Ge X, Wang R, Liu P, Ding Y. Platinum-decorated nanoporous gold leaf for methanol electrooxidation. Chem Mater. 2007;19(24):5827–5829. [Google Scholar]
- 68.Scanlon MD, Salaj-Kosla U, Belochapkine S, MacAodha D, Leech D, Ding Y, Magner E. Characterization of nanoporous gold electrodes for bioelectrochemical applications. Langmuir. 2011 doi: 10.1021/la202945s. [DOI] [PubMed] [Google Scholar]
- 69.Xia Y, Huang W, Zheng J, Niu Z, Li Z. Nonenzymatic amperometric response of glucose on a nanoporous gold film electrode fabricated by a rapid and simple electrochemical method. Biosens Bioelectron. 2011;26(8):3555–3561. doi: 10.1016/j.bios.2011.01.044. [DOI] [PubMed] [Google Scholar]
- 70.Ray S, Mehta G, Srivastava S. Label-free detection techniques for protein microarrays: Prospects, merits and challenges. Proteomics. 2010;10(4):731–748. doi: 10.1002/pmic.200900458. [DOI] [PMC free article] [PubMed] [Google Scholar]
- 71.Ruan C, Yang L, Li Y. Immunobiosensor chips for detection of escherichia coli o157:H7 using electrochemical impedance spectroscopy. Anal Chem. 2002;74(18):4814–4820. doi: 10.1021/ac025647b. [DOI] [PubMed] [Google Scholar]
- 72.Chang B-Y, Park S-M. Electrochemical impedance spectroscopy. Ann Rev Anal Chem. 2010;3(1):207–229. doi: 10.1146/annurev.anchem.012809.102211. [DOI] [PubMed] [Google Scholar]
- 73.Leteux C, Childs RA, Chai W, Stoll MS, Kogelberg H, Feizi T. Biotinyl-l-3-(2-naphthyl)-alanine hydrazide derivatives of n-glycans: Versatile solid-phase probes for carbohydrate-recognition studies. Glycobiology. 1998;8(3):227–236. doi: 10.1093/glycob/8.3.227. [DOI] [PubMed] [Google Scholar]
- 74.Sun X-L, Stabler CL, Cazalis CS, Chaikof EL. Carbohydrate and protein immobilization onto solid surfaces by sequential diels alder and azide alkyne cycloadditions. Bioconjug Chem. 2005;17(1):52–57. doi: 10.1021/bc0502311. [DOI] [PubMed] [Google Scholar]
- 75.Hone DC, Haines AH, Russell DA. Rapid, quantitative colorimetric detection of a lectin using mannose-stabilized gold nanoparticles. Langmuir. 2003;19(17):7141–7144. [Google Scholar]
- 76.Nolting B, Yu J-J, Liu G-y, Cho S-J, Kauzlarich S, Gervay-Hague J. Synthesis of gold glyconanoparticles and biological evaluation of recombinant gp120 interactions. Langmuir. 2003;19(16):6465–6473. [Google Scholar]
- 77.Seo JH, Adachi K, Lee BK, Kang DG, Kim YK, Kim KR, Lee HY, Kawai T, Cha HJ. Facile and rapid direct gold surface immobilization with controlled orientation for carbohydrates. Bioconjug Chem. 2007;18(6):2197–2201. doi: 10.1021/bc700288z. [DOI] [PubMed] [Google Scholar]
- 78.Schlesinger L. Macrophage phagocytosis of virulent but not attenuated strains of mycobacterium tuberculosis is mediated by mannose receptors in addition to complement receptors. J Immunol. 1993;150(7):2920–2930. [PubMed] [Google Scholar]
- 79.Finklea HO, Snider DA, Fedyk J. Passivation of pinholes in octadecanethiol monolayers on gold electrodes by electrochemical polymerization of phenol. Langmuir. 1990;6(2):371–376. [Google Scholar]
- 80.Guo Y-G, Zhang H-M, Hu J-S, Wan L-J, Bai C-L. Nanoarchitectured metal film electrodes with high electroactive surface areas. Thin Solid Films. 2005;484(1–2):341–345. [Google Scholar]
- 81.Cao L, Yan P, Sun K, Kirk DW. Gold 3d brush nanoelectrode ensembles with enlarged active area for the direct voltammetry of daunorubicin. Electroanalysis. 2009;21(10):1183–1188. [Google Scholar]
- 82.Leopold MC, Bowden EF. Influence of gold substrate topography on the voltammetry of cytochrome c adsorbed on carboxylic acid terminated self-assembled monolayers. Langmuir. 2002;18(6):2239–2245. [Google Scholar]
- 83.Nahálková J, Švitel J, Gemeiner P, Danielsson B, Pribulová B, Petruš L. Affinity analysis of lectin interaction with immobilized c-and o-gylcosides studied by surface plasmon resonance assay. J Biochem Biophys Methods. 2002;52(1):11–18. doi: 10.1016/s0165-022x(02)00016-7. [DOI] [PubMed] [Google Scholar]
- 84.Vijayendran RA, Leckband DE. A quantitative assessment of heterogeneity for surface-immobilized proteins. Anal Chem. 2000;73(3):471–480. doi: 10.1021/ac000523p. [DOI] [PubMed] [Google Scholar]
- 85.Schuck P. Kinetics of ligand binding to receptor immobilized in a polymer matrix, as detected with an evanescent wave biosensor. I. A computer simulation of the influence of mass transport. Biophys J. 1996;70(3):1230–1249. doi: 10.1016/S0006-3495(96)79681-9. [DOI] [PMC free article] [PubMed] [Google Scholar]
- 86.Esplandiú MJ, Hagenström H, Kolb DM. Functionalized self-assembled alkanethiol monolayers on au(111) electrodes: 1. Surface structure and electrochemistry. Langmuir. 2001;17(3):828–838. [Google Scholar]
- 87.Hagenström H, Schneeweiss MA, Kolb DM. Modification of a au(111) electrode with ethanethiol. 1. Adlayer structure and electrochemistry. Langmuir. 1999;15(7):2435–2443. [Google Scholar]
- 88.Sheridan AK, Ngamukot P, Bartlett PN, Wilkinson JS. Waveguide surface plasmon resonance sensing: Electrochemical desorption ofalkane thiol monolayers. Sensors Actuators B: Chem. 2006;117(1):253–260. [Google Scholar]
- 89.Losic D, Shapter JG, Gooding JJ. Influence of surface topography on alkanethiol sams assembled from solution and by microcontact printing. Langmuir. 2001;17(11):3307–3316. [Google Scholar]
- 90.Flynn NT, Tran TNT, Cima MJ, Langer R. Long-term stability of self-assembled monolayers in biological media. Langmuir. 2003;19(26):10909–10915. [Google Scholar]
- 91.Yu J-J, Nolting B, Tan YH, Li X, Gervay-Hague J, Liu G-y. Polyvalent interactions of hiv-gp120 protein and nanostructures of carbohydrate ligands. Nanobiotechnology. 2005;1(2):201–210. [Google Scholar]
- 92.Terrill RH, Tanzer TA, Bohn PW. Structural evolution of hexadecanethiol monolayers on gold during assembly: Substrate and concentration dependence of monolayer structure and crystallinity. Langmuir. 1998;14(4):845–854. [Google Scholar]
- 93.Hardman KD, Wood MK, Schiffer M, Edmundson AB, Clinton FA. Structure of concanavalin a at 4.25-angstrom resolution. Proc Natl Acad Sci U S A. 1971;68(7):1393–1397. doi: 10.1073/pnas.68.7.1393. [DOI] [PMC free article] [PubMed] [Google Scholar]
- 94.Senear DF, Teller DC. Thermodynamics of concanavalin a dimer-tetramer self-association: Sedimentation equilibrium studies. Biochemistry (Mosc) 1981;20(11):3076–3083. doi: 10.1021/bi00514a014. [DOI] [PubMed] [Google Scholar]
- 95.Ron H, Matlis S, Rubinstein I. Self-assembled monolayers on oxidized metals. 2. Gold surface oxidative pretreatment, monolayer properties, and depression formation. Langmuir. 1998;14(5):1116–1121. [Google Scholar]
- 96.Xing YF, Li SFY, Lau AKH, O’Shea SJ. Electrochemical impedance spectroscopy study of mixed thiol monolayers on gold. J Electroanal Chem. 2005;583(1):124–132. [Google Scholar]
- 97.Jackson AM, Myerson JW, Stellacci F. Spontaneous assembly of subnanometre-ordered domains in the ligand shell of monolayer-protected nanoparticles. Nat Mater. 2004;3(5):330–336. doi: 10.1038/nmat1116. [DOI] [PubMed] [Google Scholar]
- 98.Schofield CL, Mukhopadhyay B, Hardy SM, McDonnell MB, Field RA, Russell DA. Colorimetric detection of ricinus communis agglutinin 120 using optimally presented carbohydrate-stabilised gold nanoparticles. Analyst. 2008;133:5. doi: 10.1039/b715250g. [DOI] [PubMed] [Google Scholar]
- 99.Tan YH, Davis JA, Fujikawa K, Ganesh NV, Demchenko AV, Stine KJ. Surface area and pore size characteristics of nanoporous gold subjected to thermal, mechanical, or surface modification studied using gas adsorption isotherms, cyclic voltammetry, thermogravimetric analysis, and scanning electron microscopy. J Mater Chem. 2012;22(14):6733–6745. doi: 10.1039/C2JM16633J. [DOI] [PMC free article] [PubMed] [Google Scholar]
- 100.DeBono RF, Krull UJ, Rounaghi G. Biosensor design and application. American Chemical Society; Washington, DC: 1992. Concanavalin a and polysaccharide on gold surfaces; pp. 121–136. [Google Scholar]
- 101.Schuck P, Minton AP. Analysis of mass transport-limited binding kinetics in evanescent wave biosensors. Anal Biochem. 1996;240(2):262–272. doi: 10.1006/abio.1996.0356. [DOI] [PubMed] [Google Scholar]
- 102.Sikavitsas V, Nitsche JM, Mountziaris TJ. Transport and kinetic processes underlying biomolecular interactions in the biacore optical biosensor. Biotechnol Prog. 2002;18(4):885–897. doi: 10.1021/bp020045z. [DOI] [PubMed] [Google Scholar]
- 103.Kateryna L, Grażyna P-F, Joanna R, Małgorzata L, Jan S. Binding activity of patterned concanavalin a studied by atomic force microscopy. J Phys: Condens Matter. 2005;17(18):S1447. [Google Scholar]
Associated Data
This section collects any data citations, data availability statements, or supplementary materials included in this article.