Abstract
A new light illumination scheme to increase imaging depth in photoacoustic (PA) imaging was designed and evaluated by in silico simulations and tested by in vitro experiments. A relatively large portion of the light energy shining into the body of a human reflects off the skin surfaces. Collecting the reflected light and redirecting it onto skin surfaces will increase the effective input energy, resulting in an increase of light penetration depth for the same light source. Its performance in PA imaging was evaluated using a finite element (FE)-based numerical simulation model composed of four modules. In the in vitro experiments with the light catcher, PA image of multiple targets at different locations exhibited an enhancement both in uniformity and in depth of the light illumination.
OCIS codes: (170.3660) Light propagation in tissues, (170.5120) Photoacoustic imaging
1. Introduction
One of the important challenges in photoacoustic (PA) imaging for in vivo animal study and eventual clinical translation is the limited penetration depth of the source light [1]. The PA imaging depth is mainly limited by the attenuation of the source laser light at NIR ranges propagating through the soft tissues, and an optimal design of the light source and energy delivery method is pivotal for the deep tissue PA imaging. The effective penetration depth of the light is determined by the scattering and absorption coefficients of the tissues, the aperture of the incident beam, and the pigmentation of the skin [2, 3]. Efforts have been made by several groups with some success and limitations. In his work, Kwon et al [4] analyzed the light propagation through the multiple layers of skin comparing three mathematical modeling methods (finite element method, Monte Carlo method, and analytic solution method), and showed that the penetration depth of the light can be enhanced if the incident beam power and diameter, the amount of hyperosmotic chemical agent, or whole or partial skin compression is applied. They also developed a compression-controlled low-level laser probe utilizing the mechanical negative compression to increase the photon density in soft tissues [5]. A large portion of light energy shining into the body of a human is reflected and lost at the skin surfaces. The amount of the reflected light increases with increasing the incidence angle, with that the least reflection occurs when the laser beam is directed perpendicular to the skin [6]. If the incidence angle is 20˚, the percentage of the reflectance at 800 nm is about 22~29% [7]. As the thickness of the skin increases from 0.43 mm to 1.6 mm, the percentage of the reflectance at 800 nm also increases from 19% to 32% [8]. Collecting the reflected light energy and redirecting it onto the skin surfaces will increase the effective input energy, resulting in an increase of light penetration depth for the same light source without increasing the source power. The light catcher will also prevent the exposure of the scattered light to both the subject and the PA imaging operator, which otherwise will introduce safety concerns. Multiple random reflections inside the light catcher will also help distribute light energy more evenly to the skin surface, henceforth more uniform light distribution at depth is expected. In this way using a compact light catcher, input source light for PA imaging can be delivered over the extended area of imaging with higher efficiency, uniformity, and safety compared to other conventional methods such as direct illumination onto the skin using an expanded beam with higher source power. This concept to enhance the light propagation depth was previously proposed and evaluated only by in silico simulation under limited conditions [9].
To design and fully evaluate a new light illumination scheme in PA imaging, it requires a comprehensive and reliable simulation model, integrating the multiple disciplines such as the laser light source, the light propagation in tissues, the PA signal generation and its propagation in soft tissues. Several mathematical models have been applied to describe the PA physics. In the work by Sheu and Li [10], the heat conduction theory and the continuity, Navier-Stokes, and state equations were used to characterize the PA wave generated by thermal expansion of the target. Several numerical approaches, such as the finite-difference time domain (FDTD) method, the finite element (FE) method, and the pseudospectral (PS) method had also been used to simulate PA in different applications. In efforts to provide a fast and accurate prediction of the PA pressure field, a k-space method was proposed [11]. The thermal-pressure equation [12] was also employed to show the close relationship between the electromagnetic absorption and acoustic wave, but it did not fully describe the cause-end effect among several physical phenomena of PA. In our earlier study [9, 13], an initial version of finite element (FE)-based in silico simulation model was built for the design parameter analysis of PA imaging, simulating light propagation in tissues and thermo-acoustic property of the imaging target. It is composed of four modules of 1) light energy transmission through background tissues from the laser source to the imaging target described by diffusion equation, 2) the absorption of light energy and its conversion to heat by the imaging target using bio-heat equation, 3) acoustic pressure created by the surface displacement of the imaging target through the stress and strain changes caused by heat, 4) propagation of the created wide-band acoustic pressure to the ultrasound transducer, which is governed by acoustic wave equation. Although some parts of the simulation results compared well with the Monte-Carlo simulation with some limitations, the simulation modules were not fully integrated and verified by the experiments. The physical dimensions were not realistic for typical PA imaging settings and some parameters such as the anisotropic coefficient, and the appropriate boundary conditions in the models also were not fully incorporated.
In this study, the proposed light catcher was further evaluated by in silico simulation in full scale and the simulation results were compared with in vitro experiments using a single element ultrasound transducer. 2D PA imaging using a commercially available ultrasound array transducer integrated with the light catcher was also presented to demonstrate the practicality of the light catcher. A noticeable enhancement of the light illumination both in depth and spatial uniformity was observed.
2. Methods
The designed light catcher was evaluated in silico using a FE-based simulation model for PA imaging, which is built based on a commercial FE-simulation package, COMSOL MultiphysicsTM (COMSOL Inc., USA). The simulation results were compared with in vitro experiments using a target inclusion embedded in a tissue mimicking phantom. The light catcher was also integrated into a commercial ultrasound array transducer to obtain 2D PA image on the multiple point targets embedded in a tissue mimicking phantom with improved depth and uniformity of the light illumination. In this study, to show the feasibility of using the light catcher in PA imaging at NIR ranges, 800 nm of the laser wavelength was selected.
2.1 In silico simulation
To simulate the PA imaging processes of the light illumination, the PA signal generation, and the sound propagation in water and tissues, four transient application modes, including PDE mode, bioheat mode, solid stress and strain mode, and pressure acoustic mode were employed and integrated together in COMSOL. Both optical and acoustical parameters such as the coefficients of scattering, absorption, and thermal expansion are incorporated in tissue and target models.
Light source and propagation model
The laser source is modeled as a short Gaussian pulse with a typical fluence for PA imaging in vivo, Wp = 4 mJ/cm2, and pulse length, τp = 5 ns, with beam diameter of 4 mm. All the material parameters are chosen for the range of NIR. It was shown in our previous work [13] that Monte Carlo simulation for laser light propagation can be approximated by diffusion equation. The governing equation for the time-dependent light diffusion is [14, 15]
| (1) |
| (2) |
where φ is the fluence rate in W∙m−2, μa is the absorption coefficient, D is the diffusion coefficient, μs' is the modified scattering coefficient, c is the light speed in vacuum (3e8 m/s), n is the refractive index, r0 is the spatial position of the laser point source, r is the 3D spatial coordinates, δ(r-r0) represents a laser source at r0 (on the circular flat) with a peak value at time t = τcenter, P0 is the circular flat beam, g is the anisotropic coefficient.
The boundary condition (BC) of the interface between two media of water and tissue is set as the standard Neumann BC [16].
| (3) |
where Reff = −1.4399n−2 + 0.7099n−1 + 0.6681 + 0.0636n, n is the refractive index of the material, is the unit normal vector pointing outward from the surface.
Photoacoustic signal generation and sound propagation model
The light energy deposit to the target and its conversion into heat is described by the time dependent bio-heat equation.
| (4) |
where C is the specific heat capacity, k is the thermal conductivity. The yield factor Y is set less than 1 (0.7) to reflect that only part of the absorbed energy serves as the source term in the equation.
The relation between the change of the strain (Δε) and the stress in the target can be described using the solid stress-strain model.
| (5) |
where αvec is the thermal expansion coefficient, Tref is the reference temperature, T is the temperature (in °K).
The displacement u of the target surface due to the stress and the resulting strain change (strain-displacement equations in [17]) serves as the acoustic pressure source.
| (6) |
where p is the acoustic pressure, ρ0 is the mass density of the medium.
The propagation of the generated PA signal is governed by acoustic wave equation:
| (7) |
where cs is the sound speed.
Geometry and parameters
The light illumination model (Fig. 1 ) is composed of a laser source surrounded by the designed concave-shape light catcher, the acoustic coupling water column, and the soft background tissues (skin and muscle). The source laser light is modeled as a circular plane source (diameter of 4 mm) that emits a short Gaussian pulse (duration of 5 ns) with the maximum value at 30 ns, where the edge of the effective time period (20 ns) is smoothed by heavy side function to minimize the numerical errors and computational times near the edges of the pulse. The inner diameter of the concave-shape light catcher is set for 71 mm, and the outer diameter is set for 76 mm. A hole with diameter of 20 mm at the center of the light catcher was created for the position of the transducer, while the circular flat laser beam was introduced through another hole with diameter of 22 mm created at one side of the light catcher. The laser source is positioned at 48 mm away from the target (diameter of 8 mm) with an incidence angle of 30˚ to the water-skin interface. Standard Neumann BCs are applied to the boundaries of each component. The surfaces of the designed concave-shape light catcher are modeled as a totally reflecting mirror. For a reasonable computation time, the maximum element size (triangle meshes) is set for 1.8 mm (in length of each side), then a total of 1.46M elements are created for the case with the light catcher and 1.52M elements for the case without the light catcher. As the created PA signal is a very short pulse, a much smaller mesh size of 2 µm is applied in a small area near the target to capture the instantaneous event of PA generation and propagation.
Fig. 1.
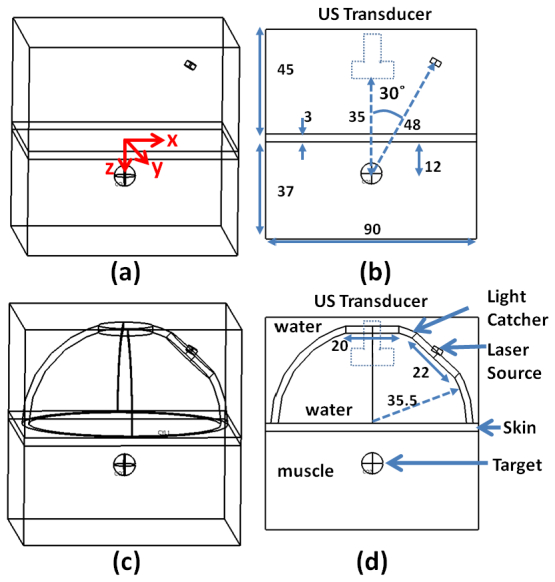
Geometry of in silico simulation. (a) and (b) are the schematic diagrams of the simulation without the light catcher. (c) and (d) are for the case with the light catcher. The source light and its propagation models are composed of the water, skin, muscle, designed light catcher, and laser source. The origin of the coordinates is at the center of the water-skin interface. The laser source is placed 48 mm away from the target above the water-skin interface with an incidence angle of 30˚, surrounded by the concave-shape light catcher, of which the inner surface acts like a totally reflecting mirror. The dashed rectangle in (b) and (d) represents the ultrasound transducer.
The resulting PA signal generation from the target inclusion and its propagation in the homogenous tissues were successfully simulated using the parameters listed in Table 1 . All the optical properties of the materials were found at or near 800 nm. Some material properties of the tissue and target used in the simulation can be slightly different from the experiments, but the results, which are the relative enhancement of the light illumination and resulting PA signal intensity when the light catcher being used compared to the case with no light catcher, remain the same. In the simulation model, the two-layer turbid media of tissue is composed of rabbit skin with thickness of 3 mm and muscle with thickness of 37 mm (their optical properties at 790 nm were used for simulation at 800 nm, expecting no significant difference between those parameters at 800nm and at 790nm), and the material of the target is assumed rubber (radius of 4 mm) [19] to mimic the materials used in the in vitro experiments. In the simulation, the anisotropic coefficient of the water is set for 0.866 for the incidence angle (30˚) of the source light to the water-skin interface. For the target inclusion, Young's modulus is set for 0.1 GPa, and Poisson's ratio is set for 0.45. Note for the purpose of evaluating the distribution of light fluence in tissue, the target inclusion is not considered.
Table 1. Properties of the Materials Used in the Simulation Models.
| Parameters | water | skin | muscle | target inclusion |
|---|---|---|---|---|
| μa [m−1] | 3 | 70 [18] | 230 [18] | 260 |
| μs [m−1] | 0.3 | 32100 [18] | 15700 [18] | 220 [19] |
| n | 1.33 | 1.42 | 1.4 | 1.51 [19] |
| g | 0.866 | 0.94 [18] | 0.95 [18] | 0.95 |
| C [J/(kg*K] | - | - | - | 480 |
| k [W/(m*K)] | - | - | - | 0.16 |
| ρ0 [kg/m3] | 998 | 850 | 1030 | - |
-Not relevant parameters
2.2 In vitro experiment
A laser pulse (energy of 4 mJ/cm2, pulse duration of 5 ns) was produced by the optical parametric oscillator (Vibrant HE532I, OpoTek, USA) pumped by Q-switch Nd:YAG pulsed Laser (Brilliant, Quantel, France) at 10 Hz in the wavelength ranges of 680 to 950 nm. Near infrared light of 800 nm was used for the experiment. A concave-shape reflector (the same diameter as simulation) of a commercial flash light was properly machined and adopted as the light catcher, of which the inner surface is coated with aluminum with the reflection efficiency of ~88% (at 800 nm).
Figure 2(a) depicts the schematics of the experimental setup using a single element transducer (Panametric-NDT V303 centered at 1 MHz, Olympus, USA). The single element transducer was positioned through the hole at the center of the light catcher, while the laser pulse was illuminated through another hole created at the side of the light catcher for the incidence angle of 30°. Two-layer rabbit tissue was composed of skin and muscle. A spherical rubber inclusion with diameter of 8 mm was embedded in the rabbit muscle. The rabbit tissue was submerged in a small water tank for PA imaging (see also Fig. 7(a)). The Q-switch signal from the laser source triggers the ultrasound pulser/receiver and oscilloscope. The PA signal received by the single element transducer is amplified by the pulser/receiver (5900PR, Olympus, MA, USA), recorded and transferred to the computer through a digital oscilloscope (WaveSurfer 452, LeCroy Corp., NY, USA).
Fig. 2.
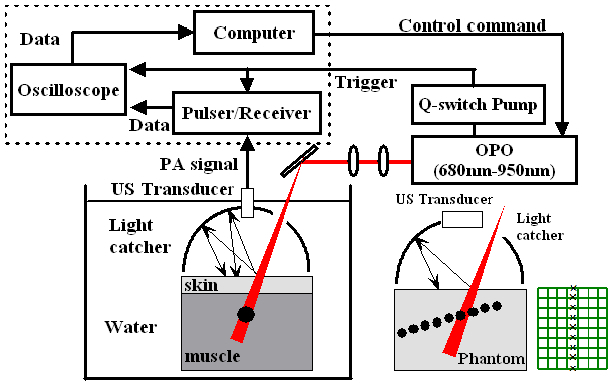
Experimental setup for in vitro photoacoustic imaging. (a) is the experimental setup using a single element transducer. (b) For 2D PA imaging, the dashed box in the block diagram was replaced with a commercial ultrasound scanner, a single element US transducer was replaced with a linear array transducer, and a black sheet of mesh was embedded in a gelatin phantom as a multiple point targets. Note a separate light catcher machined for the linear array transducer was used for 2D PA imaging.
For the experiment using a linear array transducer (L14-5, centered at 6 MHz), all the experimental setups are the same as the experiment using a single element transducer except the parts in the dashed box are replaced with a commercial ultrasound scanner (SonixTouch, Ultrasonics, Canada) in Fig. 2(a). The source laser triggers directly the ultrasound imaging scanner. In Fig. 2(b), the linear array transducer was placed through the slit made at the top of the light catcher, while the laser light was introduced through a gap created next to the transducer. For the purpose of demonstrating the feasibility of improved PA imaging using the light catcher integrated with a commercial ultrasound linear array transducer and in favor of convenience of placing multiple targets systematically in the phantom, one layer phantom was used for this experiment. A black sheet of mesh made of monocryl with a uniform mesh size of 2.5 mm was embedded in the tissue mimicking phantom made of 9% gelatin and 1% milk. The ultrasound transducer was aligned with the center line of the mesh. The side of each mesh normal to the ultrasound imaging plane is shown as a sequence of point targets separated by 2.5 mm in PA image.
3. Results and discussion
Light propagation, reflection, scattering, absorption and its conversion to heat by a target inclusion, and resulting PA signal generation from the target inclusion and its propagation in homogenous tissues were successfully simulated using the developed FE-based simulation models. The developed simulation models reflect the physical principles of photoacoustics step by step, and this in silico simulation can help design and optimize the PA imaging systems. The designed light catcher significantly increases the light penetration depth and the uniformity of the light illumination in soft tissues, which are critical for the deep tissue PA imaging applications.
3.1 Enhancement of light illumination depth and uniformity: in silico simulation
The light fluence rate along the propagation direction (z direction) was calculated from the simulation results. The percent increase of fluence rate at certain depth by the designed concave-shape light catcher was calculated as defined below:
| (8) |
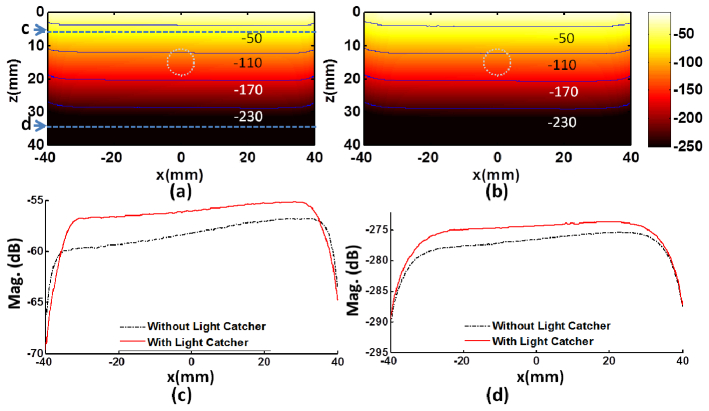
The light reflected off the water-skin boundary will be bounced back from the surrounding inner surface with a highly reflective coating of the light catcher, and the multiple reflections between the inner surface of light catcher and the water-skin boundary will eventually increase total effective input energy to the tissue and redistribute light fluence more uniformly over the extended area. In Fig. 3 , it is shown that the light penetrates deeper in tissues with the designed light catcher (b) compared to the case without the light catcher (a). The light intensity is presented in dB referenced to the maximum value and the equivalent contours were overlaid for a quantitative comparison. In Fig. 3(c) and (d), to examine the uniformity of the light fluence rate, the fluence rate profiles along horizontal axis (x-axis) at two separate depths, 5 mm (c) and 35 mm (d), are presented. If using the light catcher, at 5 mm below the water-skin surface, inside the area illuminated by the light catcher, the light fluence rate is higher and the light distribution becomes more uniform (solid red line in (c)) compared to the case without using the light catcher (dash-dot black line in (c)); at the depth near the bottom of the phantom (35 mm), the light distribution exhibits similar uniformity with increased fluence rate (solid red line in (d)) compared to the case without using the light catcher (dash-dot black line in (d)). In (c), about 33.6% of fluence increase is observed at the center line, while the maximum increase of the fluence rate is about 43% (3.1 dB) near the edge of the light catcher.
Fig. 3.
Increase of the magnitude and penetration depth of the light fluence rate by using the light catcher. Panels (a) and (b) depict the distribution of the fluence rate in dB [-250, −10] at 30 ns without and with the light catcher, respectively. The contours of the magnitude are overlaid on the figures to provide a quantitative comparison. The white dash-dotted circle presents the position of the target. Panels c and d are the fluence rate profiles along x-axis at (0, 0, 5) mm and (0, 0, 35) mm, respectively. Note the top parts of the images in (a) and (b) indicate the boundary between water and tissue at 0 mm.
The collected light by the light catcher illuminates an extended area of the skin with the increased effective total input energy, therefore, resulting in an increased fluence rate, growing along the depth near the center are in X-Y plane. In Fig. 4(a) , the percent increase of fluence rate (Eq. (1)) along the tissue depth (z direction) at center (x = 0, y = 0) is plotted. The laser light illumination into the deep tissues can be significantly improved by 33.5% (at the water-skin interface) to 33.9% (at the bottom of phantom), with almost linear increase with the depth. The fluence rate increase of 33.6% can be achieved at the depth of 11 mm where the target inclusion is located if the designed light catcher is used. In Fig. 4(b), it is shown that the peak fluence rate measured at (0, 0, 11) mm (at the top surface of the target inclusion) when the light catcher being used is about 1.34 times (33.6%) the peak fluence rate without the light catcher. Note that the laser pulse reaches the peak at 30 ns, and its effective period is about 20 ns.
Fig. 4.
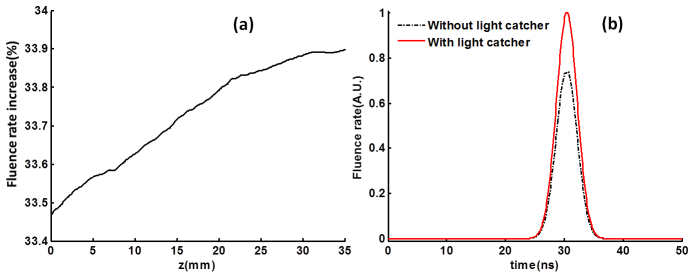
Increase of the peak fluence rate. (a) Inside the tissue along depth (z direction) at center (x = 0, y = 0), the peak fluence rate increase due to the light catcher in dB along z axis (x = 0, y = 0) is plotted. (b) The light pulse measured at the position (0, 0, 11) mm with/without light catcher. The peak fluence rate increase is about 33.6% at the top surface of the target (z = 11 mm).
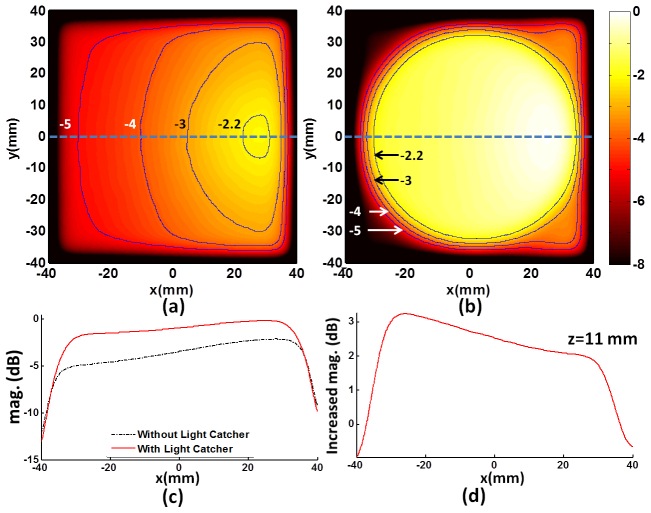
In Figs. 5(a) and 5(b), to compare the spatial uniformity of the light fluence rate when using the light catcher (a) with the case with no light catcher, the fluence rate profiles in x-y plane tangent to the top surface of the target are presented. The overall increase of the light illuminating area is apparent. For example, if using the light catcher, the illuminated area circled by −3 dB contour becomes significantly larger and the light distribution becomes more uniform compared to the case without using the light catcher. In Figs. 5(c) and 5(d), the flence rate increase along the x axis (dotted blue line) in the illuminated area ranges from 2 dB (25.9%) to 3.3 dB (46.2%). The fluence rate increase close to the edge of light catcher is higher than that in the center area. This is expected from the orientation of the incoming source light from the side of the concave-shape reflector with a non-zero incidence angle. Depending on the targeted area the combination of the orientation of the light and the shape of the light catcher can be adjusted and optimized for the purpose of the experiments.
Fig. 5.
Increase of the magnitude and uniformity of the light fluence rate by using the light catcher. Panels (a) and (b) depict the distribution of the fluence rate in x-y plane at z = 11 mm, where the top surface of the target is located, in dB [-8, 0] at 30 ns without and with the light catcher, respectively. The contours of the magnitude are overlaid on the figures to provide a quantitative comparison. Panel (c) is the fluence rate profiles along x-axis through the top surface of the target with (solid) and without (dash-dot) light catcher, and (d) represents the difference between them.
3.2 Enhancement of PA signal: in silico simulation
When the target inclusion receives the laser light energy, the resulting ultrasound wave is created from the surface of target. As our modeling system is linear, the enhanced fluence rate presented above with the use of the light catcher should increase the corresponding PA signal by the same rate. The fluence rate increase at the target is about 33.6% (shown in Fig. 4(b) and in Fig. 5(d)). In Fig. 6(a) , the PA signal obtained near the target is examined in time (a) and frequency (b). The peak signal occurs at 30 ns, synchronizing with the light source (with peak at 30 ns in Fig. 4(b)). The peak-to-peak value of PA signal is increased about 33.6% if the light catcher is used. The full width half maximum (FWHM) of the spectrum of PA signal is about 64.1 MHz, centered around 64.1 MHz. In Fig. 6(b), the increment of PA magnitude below 300 MHz is almost the same, 2.5 dB (33.6%), for each frequency. The small discrepancy in the increase between the fluence rate and PA signal is within error tolerance.
Fig. 6.
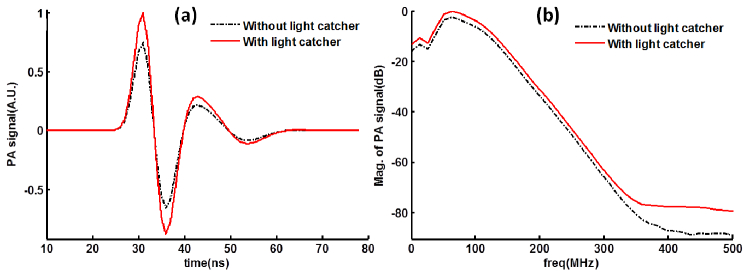
Wide-band PA signal with/without light catcher from in silico simulation. The simulated photoacoustic signals are examined in time (a) and frequency (b). The band width (FWHM) is about 64.1 MHz, centered around 64.1 MHz.
3.3 Enhancement of PA signal: in vitro experiments
The light catcher enhances the overall PA signal. For the experiment using a single element transducer (centered at 1 MHz), the PA signal increased by about 26.2% (Fig. 7(b) ) if light catcher was used. Accordingly, in Fig. 6(b), it is shown the increment of PA signal at 1 MHz is about 33.6% if the light catcher is used in simulation. If considered the reflection efficiency of the inner aluminum surface of the light catcher, which is 88%, the experiment results compare well with results from simulation using 100% reflection.
Fig. 7.
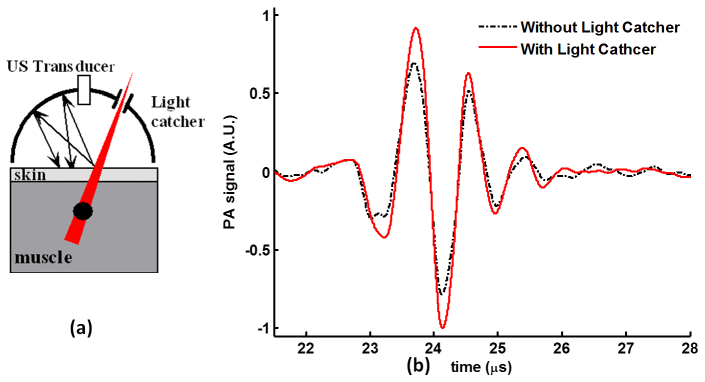
Wide-band PA signal with/without light catcher from in vitro experiments. (a) Schematic illustration of the experiment using a single element transducer (1 MHz). (b) The PA signal detected by the single element transducer with/without light catcher. With light catcher, the peak-to-peak value of the PA signal increases by 26.2%.
Using a linear array transducer, it is observed that the light catcher enhances both the uniformity of the light illumination and the penetration depth. For 2D PA image reconstruction, ultrasound radio frequency (RF) signal from each transducer element was band-pass filtered around 6 MHz for SNR enhancement, and a standard delay and sum beam-forming method was subsequently applied. Compared to that only six targets (mid-point of a side of each mesh) were detected (Fig. 8(a) ), if the light catcher was applied (insert in Fig. 8(c)), three additional targets were identified in PA image (Fig. 8(b)) at different locations in X-Z plane. In Fig. 8(c), the maximum intensity projection onto z axis is plotted. Note a significant enhancement of PA signal is observed only in the left side (7th, 8th and 9th mesh were seen) of the image in (b), as the light is more effectively reflected from the left side of the light catcher (see inlet in Fig. 8(c)) due to the orientation of the source light coming from the right side of the light catcher. This also reflects that the fluence rate increase in the area close to the edges (especially left side) of the light catcher is higher than that in the center area in the simulation (Fig. 3(c) and Fig. 5(d)).
Fig. 8.
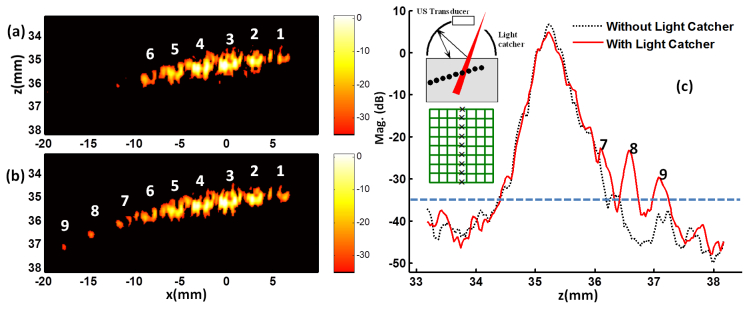
Enhancement of 2D PA image when the light catcher is used. The schematic illustration of the experiment using a linear array transducer is inserted in panel (c). A black mesh was embedded inside the phantom made of 9% gelatin and 1% milk, and the ultrasound transducer was aligned with the center line of the mesh. The side of each mesh normal to the ultrasound imaging plane were shown as a sequence of separate targets in PA image. (a) Only six mesh points were shown when light catcher was not used. (b) Three more points were detected when light catcher was applied. (c) The maximum intensity projection onto the depth (z axis) is plotted. The dashed line of −35dB in (c) corresponds to the black background in (a) and (b), representing the noise limit of the imaging system.
As the light catcher distributes light more evenly to the skin surface, it can reduce the risk of tissue damage due to undesired local overexposure of the skin to a collimated laser beam with high power. It also brings a safe environment to both the subject and the operator of PA scanning with minimal or no light scattering off from the illuminated sites.
4. Conclusions
A new design of the light illumination scheme is proposed and evaluated by in silico simulation for deep tissue PA imaging. The collected and redistributed light on to the skin surface by the designed light catcher provides a significantly increased total effective input light energy with enhanced uniformity of the fluence rate over the extended area, resulting in an increased imaging depth. If the light incidence angle is 30˚, the fluence rate is significantly increased by 33.5% to 33.9% along the center line for the same light source. This will allow PA imaging with an increased imaging depth and signal-to-noise ratio, which is critical for in vivo animal study and eventual translation to the clinical applications where the imaging targets are often placed in deep tissues. Importantly for safety, light catcher will prevent undesired exposure of the scattered laser light to both the subject and the PA scanning operator. The footprint of the light catcher can be designed no larger than a conventional ultrasound standoff pad with no complicated structure.
The developed FE-based in silico simulation model can be used for further optimal design of the PA imaging techniques and systems, quantitatively analyzing and generating the experimental evaluation protocols in vitro and in vivo. For further optimized design of the light catcher associated with the shape or/and height of the cone, optimal coating material, and light source location, are under investigation, especially for in vivo applications.
Acknowledgment
This work was supported by the grant from the Industrial Source Technology Development Program ( 2010-TD-500409-001) of the Ministry of Knowledge Economy (MKE) of Korea. This work also was partially supported by NIH R21HL093176 from the National Center for Research Resources (NCRR), a component of the National Institutes of Health (NIH) and NIH Roadmap for Medical Research, and its contents are solely the responsibility of the authors and do not necessarily represent the official view of NCRR or NIH.
References and links
- 1.Song K. H., Wang L. V., “Deep reflection-mode photoacoustic imaging of biological tissue,” J. Biomed. Opt. 12(6), 060503 (2007). 10.1117/1.2818045 [DOI] [PubMed] [Google Scholar]
- 2.Nilsson G. E., TENLAND T., Öberg P., “Evaluation of a laser Doppler flowmeter for measurement of tissue blood Flow,” IEEE T. Biomed. Eng. (N.Y.). BME 27(10), 597–604 (1980). [DOI] [PubMed] [Google Scholar]
- 3.Bachem A., Reed C. I., “The penetration of light through human skin,” Am. J. Physiol. 97, 86–91 (1931). [Google Scholar]
- 4.Kwon K., Son T., Lee K.-J., Jung B., “Enhancement of light propagation depth in skin: cross-validation of mathematical modeling methods,” Lasers Med. Sci. 24(4), 605–615 (2009). 10.1007/s10103-008-0625-4 [DOI] [PubMed] [Google Scholar]
- 5.Kwon K., Son T., Yeo C., Jung B., “Numerical modeling of compression-controlled low-level laser probe for increasing photon density in soft tissue,” J. Opt. Soc. Korea 15(4), 321–328 (2011). 10.3807/JOSK.2011.15.4.321 [DOI] [Google Scholar]
- 6.Carroll L., Humphreys T. R., “Laser-tissue interactions,” Clin. Dermatol. 24(1), 2–7 (2006). 10.1016/j.clindermatol.2005.10.019 [DOI] [PubMed] [Google Scholar]
- 7.Hardy J. D., Muschenheim C., “The radiation of heat from the human body. IV. the emission, reflection, and transmission of infra-red radiation by the human skin,” J. Clin. Invest. 13(5), 817–831 (1934). 10.1172/JCI100624 [DOI] [PMC free article] [PubMed] [Google Scholar]
- 8.Hammel H. T., Hardy J. D., Murgatroyd D., “Spectral transmittance and reflectance of excised human skin,” J. Appl. Physiol. 9(2), 257–264 (1956). [DOI] [PubMed] [Google Scholar]
- 9.Wang Z., Ha S., Kim K., “Photoacoustic design parameter optimization for deep tissue imaging by numerical simulation,” Proc. SPIE 8223, 822346–, 822346-8. (2012). 10.1117/12.912973 [DOI] [Google Scholar]
- 10.Sheu Y.-L., Li P.-C., “Simulation of thermally induced photoacoustic wave propagation using a pseudospectral time-domain method,” IEEE T. Ultrason. Ferr. 56(5), 1104–1112 (2009). 10.1109/TUFFC.2009.1144 [DOI] [PubMed] [Google Scholar]
- 11.Cox B. T., Beard P. C., “Fast calculation of pulsed photoacoustic fields in fluids using k-space methods,” J. Acoust. Soc. Am. 117(6), 3616–3627 (2005). 10.1121/1.1920227 [DOI] [PubMed] [Google Scholar]
- 12.Sun K., Wu N., Tian Y., Wang X.-W., “Simulation on photoacoustic conversion efficiency of optical fiber-based ultrasound generator using different absorbing film materials,” Proc. SPIE 7982, 798213 (2010). [Google Scholar]
- 13.Wang Z., Ha S., Kim K., “Evaluation of finite element based simulation model of photoacoustics in biological tissues,” Proc. SPIE 8320, 83201L–, 83201L-9. (2012). 10.1117/12.912152 [DOI] [Google Scholar]
- 14.A. Ishimaru, Wave Propagation and Scattering in Random Media (Academic Press, 1978), Chap. 9. [Google Scholar]
- 15.Groenhuis R. A. J., Ferwerda H. A., Bosch J. J. T., “Scattering and absorption of turbid materials determined from reflection measurements. 1: Theory,” Appl. Opt. 22(16), 2456–2462 (1983). 10.1364/AO.22.002456 [DOI] [PubMed] [Google Scholar]
- 16.Haskell R. C., Svaasand L. O., Tsay T.-T., Feng T.-C., McAdams M. S., Tromberg B. J., “Boundary conditions for the diffusion equation in radiative transfer,” J. Opt. Soc. Am. A 11(10), 2727–2741 (1994). 10.1364/JOSAA.11.002727 [DOI] [PubMed] [Google Scholar]
- 17.L. J. Segerlind, Applied Finite Element Analysis (Wiley, 1984), Chap. 22. [Google Scholar]
- 18.Bashkatov A. N., Genina E. A., Tuchin V. V., “Optical properties of skin, subcutaneous, and muscle tissues: a review,” J. Innov. Opt. Health Sci. 4(1), 9–38 (2011). 10.1142/S1793545811001319 [DOI] [Google Scholar]
- 19.Holoubek J., “Light scattering and reflectance of optically heterogeneous polymers in multiple scattering regime,” Polym. Commun. (Guildf.) 40(1), 277–280 (1999). 10.1016/S0032-3861(98)00209-2 [DOI] [Google Scholar]


