

Abstract
This paper describes a cell-exclusion patterning method facilitated by a polymeric aqueous two-phase system. The immersion aqueous phase (polyethylene glycol) containing cells rehydrates a dried disk of the denser phase (dextran) on the substrate to form a dextran droplet. With the right properties of the phase-forming polymers, the rehydrating droplet remains immiscible with the immersion phase. Proper formulation of the two-phase system ensures that the interfacial tension between the rehydrating droplet and the surrounding aqueous phase prevents cells from crossing the interface so that cells only adhere to the regions of the substrate around the dextran phase droplet. Washing out the patterning two-phase reagents reveals a cell monolayer containing a well-defined circular gap that serves as the migration niche for cells of the monolayer. Migration of cells into the cell-excluded area is readily visualized and quantified over time. A 96-well plate format of this “gap healing” migration assay demonstrates the ability to detect inhibition of cell migration by known cytoskeleton targeting agents. This straightforward method, which only requires a conventional liquid handler and readily prepared polymer solutions, opens new opportunities for high throughput cell migration assays.
Keywords: Polymeric aqueous two-phase system, interfacial tension, cell-exclusion patterning, cell migration
1. Introduction
Cell migration is a central physiologic process that choreographs developmental morphogenesis and regulates tissue homeostasis throughout life. Dysregulated cell movement is a hallmark of pathologic events including pulmonary diseases and cancer metastasis. Epithelial cells, which cover the surface of cavities and structures throughout the body, are particularly interesting because of the high rate of cancers with an epithelial origin;[1] epithelial cells migrate either collectively or individually both in normal and pathologic conditions.[2-6] A useful and widely used type of in vitro assay for collective migration of epithelial and other types of cells is the “wound” healing assay. In the typical wound healing assay, a cell monolayer is scratched or “wounded” to remove a stripe of cells and subsequent closure of the wound region is observed.[7-9] There are challenges for performing wound healing assays, however, in that the procedures can be complex due to the need for specialized tools to scratch the cell monolayer in high throughput settings, the scratching tool damages both cells and the underlying substrate, and migration results can inherently be variable because the “wound” size (or width) depends not only on the scratching tool and procedures but also on how the cells happen to get scratched off. This makes the quantification of the migration process complicated. To overcome such limitations, a number of alternative techniques to generate well-defined gaps within a cell monolayer have been developed. These include removal of a group of cells by a rotating soft silicon tip,[10, 11] electroporation,[12] use of microfabricated stencils,[13] mechanical confinement within microfabricated channels,[14] and release of cells patterned on microcontact printed substrates by electrically-triggered surface property changes.[15, 16] There are also commercialized migration assays that utilize silicon stoppers or dried hydrogels, stencils, or lasers to create an area empty of cells within a confluent cell monolayer. All these methods, however, still require using unconventional tools or substrates, and many are difficult and expensive to adapt to a high throughput format. We note that migration of cells in these platforms is initiated by presence of a discontinuity in the monolayer, distinguishing them from chemotactic migration stimulated by gradients of a chemokine.[17]
To generate a scratch-free cell migration assay, we utilize an aqueous two-phase system (ATPS) consisting of polyethylene glycol (PEG) and dextran (DEX) as the phase-forming polymers.[18] In this method, a submicroliter droplet of the DEX phase is spotted and dried on the floor of standard microwells. When the PEG phase containing suspended cells is added to these wells, the dried DEX spot rehydrates to form an immiscible droplet. The PEG-DEX biphasic system interfacial tension excludes cells from adhering to the part of the substrate covered by the rehydrating drop. This generates a well-defined circular cell-excluded area within a cell monolayer without the need for any special equipment or procedures other than standard pipetting equipment accessible at high throughput screening facilities. After washing away the ATPS medium, the rate and degree to which cells fill up the available space provides a measure of cell migration in a manner similar to wound healing assays. We further demonstrate the ability to adapt the technology to a 96-well plate format and show its efficacy for investigating basic cell migration dynamics and screening of migration-inhibiting chemical compounds. This high throughput cell-exclusion patterning creates migration niches without damaging cells and the substrate and offers new capabilities for the screening of libraries of potential cell motility regulating chemical compounds.
2. Results and Discussion
2.1 Principles of cell-exclusion patterning and cell migration in this assay
The migration assay is based on movement of cells from a confluent monolayer into a circular cell-excluded area within the monolayer. To develop this assay, we utilize a novel physical phenomenon involving aqueous two-phase systems. A droplet of the denser aqueous phase, DEX, printed on a tissue culture dish is allowed to dehydrate and form a solid disk (Figure 1a, left). Subsequent addition of the immersion PEG phase to the culture dish causes the dried DEX spot to rehydrate within a few minutes and form a droplet segregated from the surrounding PEG phase (Figure 1a, right). Once the dried droplet starts rehydrating, an interfacial tension is generated between the aqueous PEG phase and the rehydrating aqueous DEX phase. This liquid-liquid interfacial tension is largest at the initial stages of the rehydration process due to the high concentration of the DEX polymer in the rehydrating droplet and decreases as the process continues toward equilibrium. When the PEG phase contains cells, the interfacial force at the boundary of the PEG and DEX phases shields cells from crossing the interface between the two aqueous phases such that cells can only settle down around the droplet (Figure 1b). Once cells adhere to the surface of the culture dish, the two-phase media is gently washed out and replaced with regular media. The washing procedure does not damage adhered cells nor does it affect the shape of the gap region. This procedure generates a well-defined circular cell-excluded area within a lawn of adhered cells and incubation results in the migration of cells and eventual closure of the available space (Figure 1c). An appropriate automated liquid handler with precise dispensing of submicroliter volumes of the DEX phase droplet onto the surface can generate consistent gap sizes.
Figure 1.
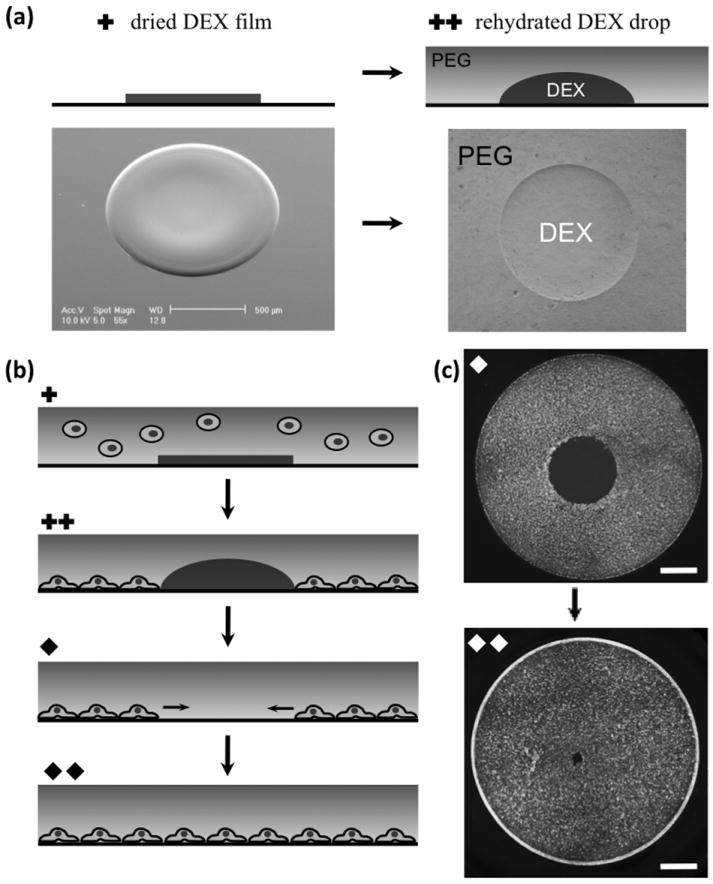
(a) Dehydrated DEX film rehydrates upon addition of the PEG phase, (b) schematics of cell patterning due to rehydration of the DEX droplet and migration of cells into the gap, (c) experimental images of cell-excluded patterning and subsequent migration of MDA-MB-231 breast cancer cells in 96-well plate configuration. Plus and diamond symbols correspond sections of panels (a-c). Scale bar 1 mm in (c)
We substantiated the importance of interfacial tension for this cell patterning procedure by comparing the efficacy of two biphasic systems with a similar PEG concentration of 2.5% but different DEX concentrations of 3.2% and 6.4%. The interfacial tension of an ATPS is determined by the concentration of the phase forming polymers. We constituted a phase diagram comprising of this polymer pair and determined the initial and final compositions of both systems (Figure 2). The composition of the former ATPS (2.5%PEG-3.2%DEX) is closer to the critical point and thus the interfacial tension of this phase system is closer to its minimum, which would correspond to the critical point of the two-phase system. By increasing the DEX phase concentration to 6.4%, the phase system is removed farther from the critical point and the interfacial tension increases. Since the interfacial tension of an ATPS is directly proportional to the tie line length,[19] we measured the length of the tie lines (AB and A′B′) for both ATPSs as TLLAB=15.5 (%w/w) and TLLA′B′=11.5 (%w/w) and estimated that the ATPS with the higher DEX concentration of 6.4% results in higher interfacial tension throughout the rehydration process with a ~26% increase in the interfacial tension in the fully hydrated state. From our previous work of direct measurement of the interfacial tension of the 2.5%PEG-3.2%DEX ATPS (10 μJ/m2)[20] and the above tie line lengths, an interfacial tension of ~13 μJ/m2 is expected for the 2.5%PEG-6.4%DEX ATPS. Figure SI-1 compares the patterns obtained with both phase systems confirming the influence of interfacial tension on pattern formation. Extreme sensitivity of partitioning properties of cells to changes in the interfacial tension of aqueous biphasic systems is consistent with our previous work that demonstrated a change of ~28% in the interfacial tension (10 μJ/m2 to 14 μJ/m2) significantly alters the fidelity of cellular patterns printed using ATPS microprinting technology.[20] The principle defined above is general and may be utilized with other polymeric two-phase systems. As a general rule of thumb, cell printing and patterning with ATPSs is very sensitive to the interfacial tension, and thus phase-forming polymer concentrations. The concentration of polymers should be kept as low as possible to minimally perturb the original media composition and decrease the time required for cell adhesion, yet generate an optimum force at the interface between the two phases to segregate cells.
Figure 2.
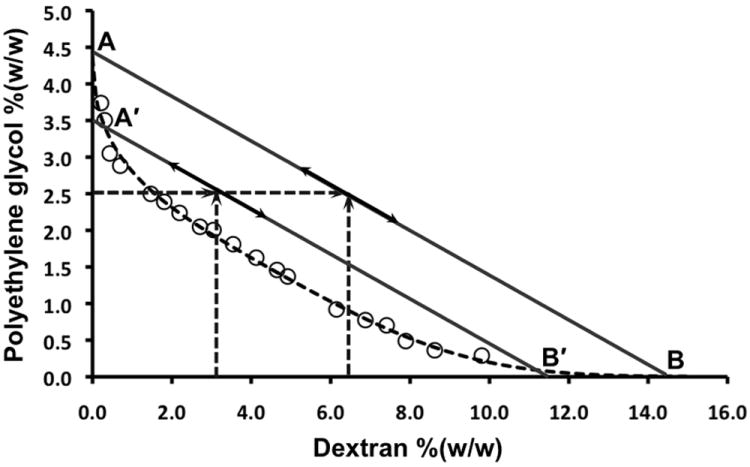
The phase diagram of PEG35K-DEX500K and tie lines corresponding to 2.5%PEG-6.4%DEX (AB) and 2.5%PEG-3.2%DEX (A′B′) two-phase systems.
Migration of MDA-MB-231 cells into the empty circular gap did not start until cells had completely spread and covered small intercellular spaces. Monitoring cells over time post printing showed that tight association of cells and the initiation of this process takes about 12 hrs. This is consistent with the finding that a threshold cell density is needed before the cellular gap closure process starts.[21] At this point, cells present at the free edge experience pressure from the monolayer side. The presence of the circular cell-excluded discontinuity within the epithelium creates a net force on the boundary cells to move in the path of least resistance into the free available space until it is fully occupied by migrating cells (Figure 1c). At the migrating front, cells spread out and formed fairly broad lamellipodial protrusions in the direction of migration (Figure 3a) and showed clear staining for cortical actin filaments consistent with collective cell migration (Figure 3b).[13] We did not observe formation of spike-like filopodia, which cells extend to sense chemical gradients,[22, 23] or expression of stress fibers that occurs during individual migration of transformed cancer cells.[24]
Figure 3.
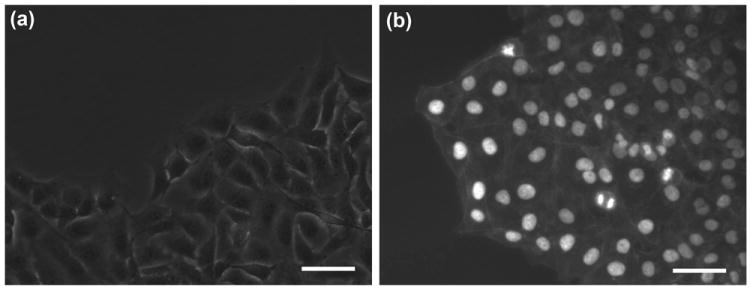
(a) MDA-MB-231 cells at the migrating front show lamellipodial extensions in the direction of migration, (b) actin and Hoechst (nucleus) staining of 231 cells at the migrating border shows expression of cortical actin. Scale bar 50 μm)
2.2 High throughput cell migration and image capture and analysis
We adapted this cell migration technology to a high throughput format by printing a single DEX droplet in each well of a 96-microwell plate. Subsequent addition of cells suspended in the PEG phase generated parallel migration assays. Figure 4a shows typical images of cells before and after migration in one well of a 96-well plate. A major challenge with the use of high-content cell migration platforms is image analysis and quantification of a large number of experiments. We quantified cell migration by calculating the percentage of closure of the cell-excluded area over a given time period before the gap is completely closed, i.e. %Area closure=[(A1-A2)/A1]*100, where A1 and A2 denote the area of cell-excluded region at the beginning and endpoint of an experiment confined within the red borderline in Figure 4a. To perform unbiased measurements of area on a large number of images, we devised an automatic protocol to process images and measure the void area within each image not occupied by migrating cells (see Experimental section for details).
Figure 4.
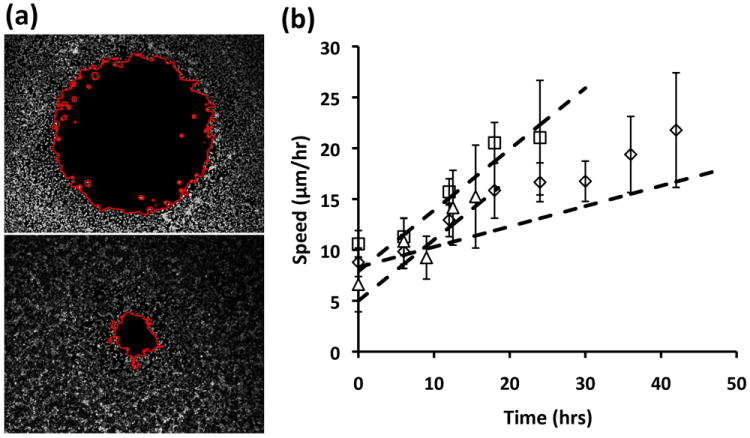
(a) Typical pre- and post-migration images of MDA-MB-231 cells used for image processing to determine cell-excluded area. The red borderline shows the gap region in each image, (b) experimental and theoretical speed profiles of cells migrating into gap regions of different sizes.
2.3 Dynamics of cell migration
We studied migration of MDA-MB-231 cells in microwell plates containing cell-excluded spots with three different diameters of 1.6 mm, 0.8 mm, and 0.5 mm. Cell seeding density was adjusted to give equal number of cells per unit area, i.e. ~1400 cells/mm2, in all three conditions. Imaging was carried out every 4-6 hrs until the initial gap was completely occupied by migrating cells. We observed a gap size-dependent closure rate of cell-excluded areas with the highest rate of cell migration into the smallest gap and the slowest rate into the largest gap (Figure SI-2a). Speed of cells was calculated as the average distance traversed by cells (i.e. change in radius) between each two imaging time points. We found that the speed of cells continuously increases with time over the entire course of the migration process (Figure 4b). We also performed curve fitting to the approximated radius data and found that radius decreases quadratically with time for all three cases (Figure SI-2b). Differentiating the resulting equations gave theoretical speed relations as a function of time. Plotting these equations in Figure 4b shows that the experimental data follow the theoretical curves and overall, cells seem to accelerate more in the cases with smaller gap sizes (0.5 and 0.8 mm). But within experimental error, we cannot distinguish between acceleration of cells in these three cases. Acceleration of cells with the closure time is consistent with previous reports based on both conventional wound healing assay and non-scratch migration assay [13, 21] and may in part be due to the contribution of cell proliferation within the monolayer to support forward movement of the migrating front.
2.4 Effect of blebbestatin on cell migration
The basic mechanism of cell motility is similar in many cases and involves polarization of the cell body accompanied by continuous reorganization of actin cytoskeleton, integrin-mediated adhesion to the underlying substrate, formation of membrane protrusions at the cell front, traction of cell body through actomyosin-mediated contraction, and disassembly of adhesion sites at the rear of the cell to enable cell translocation. As a test of our platform to assess cell migration, we treated cells with a potent inhibitor of machinery of cellular motility, blebbistatin. This compound interferes with rigid actomyosin cross-bridging and abates cell motility.[25, 26] MDA-MB-231 cells were treated with six different concentrations of blebbistatin ranging from 5-200 μM for 18 hrs. Cells showed a dose-dependent response to blebbistatin and their migration capacity decreased significantly with increasing concentration of the inhibitor, especially at concentrations greater than 50 μM (Figure 5a). With our experimental conditions, the data suggest an IC50 value of 31.8 μM (BioDataFit software). We also observed that cells at the free edge became more elongated and lost close associations after blebbistatin treatment (Figure 5b), similar to previous reports.[27] This set of experiments confirms that the biphasic cell-exclusion patterning provides a reliable cell migration platform for testing effects of compounds targeting cell motility. We also performed a statistical analysis to assess the quality of the migration assay and obtained a value of 0.62 for the Z′ factor using data from the 200 μM blebbistatin test as the positive control and no blebbistatin treatment as the negative control.[28] This value indicates the high quality and robustness of our cell-exclusion migration assay. The Z′ factor is a measure of the potential robustness of high throughput screens where values in the range of 0.5-1.0 are regarded as excellent assays.[28]
Figure 5.
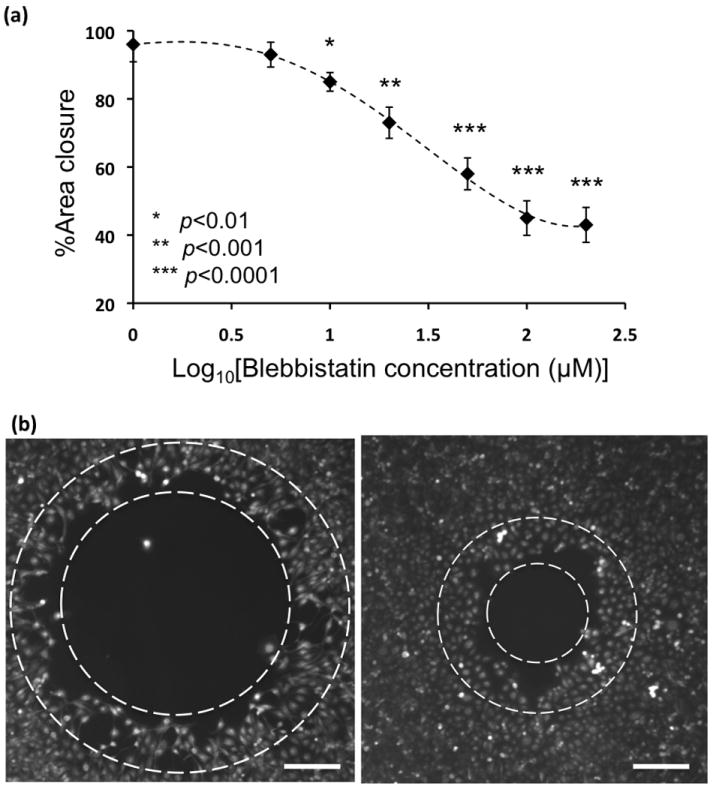
(a) Blebbistatin shows dose-dependent inhibition of motility of MDA-MB-231 breast cancer cells. The p values indicate t-test results of comparing each blebbistatin concentration with the control experiment of no blebbistatin treatment, (b) cells at the migrating front, between two dashed circles, dissociated and elongated after treatment with blebbistatin (left panel) compared to the control condition of no blebbistatin treatment (right panel). Scale bar 250 μm)
2.5 Screening multiple inhibitors of cell migration
We simultaneously screened the effect of three different compounds on the migration of MDA-MB-231 cells. We selected paclitaxel, colchicine, and nocodazole, each of which interferes with cell proliferation and normal dynamic function of microtubules. Paclitaxel is a potent cancer chemotherapeutic agent that stabilizes microtubules and prevents their depolymerization to tubulin monomers.[29, 30] Colchicine and nocodazole, on the other hand, inhibit polymerization of tubulin monomers to microtubules.[31, 32] Drugs were tested at four different orders of magnitude of concentration in the range of 1-1000 nM. We treated cells with compounds for a 2 hr period because it has been suggested that these agents can be effective even at short treatment times. Paclitaxel showed potency for inhibiting cell motility within the concentration range of 10-100 nM (Figure 6a, 6b-top row), in agreement with existing evidence that paclitaxel arrests microtubule dynamics in tumor cells at such low concentrations.[30] Colchicine reduced cell motility in a dose-dependent manner,[33] especially above 100 nM (Figure 6a, 6b-bottom row). This also supports previous reports that showed colchicine at 100 nM inhibits migration of different cell types.[29, 30, 34] Nocodazole was the least potent among these three drugs and reduced migration by less than 20% only (Figure 6a, 6b-middle row). Our data agrees with other reports that show that this compound does not effectively inhibit cell migration at this concentration range[35] and that higher concentrations are required to reduce cell motility[36]. We note that our conclusions are based on a short 2 hr drug treatment within a 30 hr migration analysis period. Longer drug incubation times will likely alter the efficient concentration range of the drugs. Importantly, this test demonstrates the suitability of our platform for high throughput simultaneous screening of multiple drug candidates to identify potent cell migration inhibiting agents for different dosages and treatment times.
Figure 6.
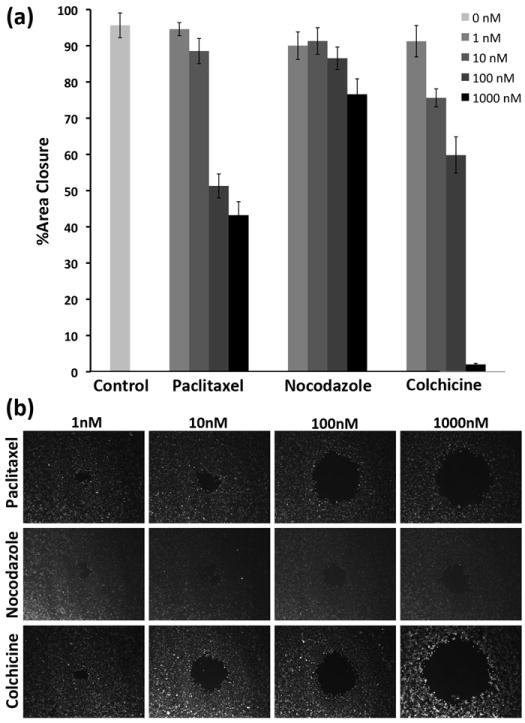
(a) The effect of three different drugs, paclitaxel, nocodazole, and colchicine, on the migration of MDA-MB-231 breast cancer cells, (b) experimental images of cells treated with four different concentrations of each compound.
2.6 Versatility and flexibility of the method
To demonstrate generality of our method for use with different cell types, we tested two other cancer cell lines in addition to the breast cancer cells (MDA-MB-231): A549 lung cancer cells and PC3 prostate cancer cells. The results in Figure 7a show that within 30 hrs of incubation, 231 cells migrated much faster than the other two cell lines and occupied 80% of the available space. Both A549 and PC-3 cells showed similar reduced migratory behavior closing about 25% of the cell-excluded gap within this timeframe. Although the incubation time needs to be adjusted to allow completion of migration of the slower moving cells, this experiment demonstrates the broad applicability of our method to multiple cell types. In addition, we demonstrated the capability of increasing the throughput of experiments by creating four cell-excluded regions within a single well of a 96-well format microplate (Figure 7b). Such multiple cell-exclusion patterning may efficiently enhance statistical confidence of assays. It also demonstrates the flexibility and versatility of the rehydration-mediated cell-exclusion patterning procedure.
Figure 7.
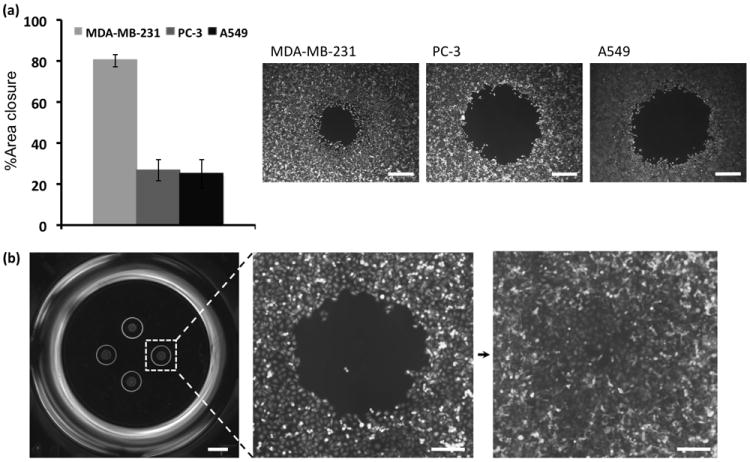
(a) Comparison between migration of MDA-MB-231 breast cancer, A549 lung cancer, and PC-3 prostate cancer cells during similar experimental timeframe, (b) multiplexing cell-exclusion areas by printing four DEX droplets in each well of a 96-well plate and a representative image of cell migration into one of the four gaps. Scale bar 500 μm in (a), 800 μm in (b-left panel), 200 μm in (b-right panels)
3. Conclusions
We describe local rehydration of dried biocompatible polymeric aqueous media and utilize this phenomenon to develop a new no-scratch cell gap healing assay. The interfacial tension of an optimized aqueous two-phase system formulation helps create circular cell-excluded regions surrounded by a confluent cell layer. Over time, cells migrate into the available free surface and occupy it. The procedure allows anyone with access to conventional liquid handlers to set up high throughput “wound closure” type assays without any additional equipment or specialized plates. Using a 96-well plate format, we validated the capability of this assay to study cell migration inhibitors using an actomyosin-inhibiting compound that reduced cell migration in a dose-dependent manner. We further screened the effect of three microtubule-targeting drugs on cell motility and determined concentration ranges to effectively reduce migration of cancer cells. This scratch-free aqueous biphasic cell migration technique is simple to perform and robustly applicable to multiple different cell types, requires only standard pipetting tools, and opens new possibilities for high throughput evaluation of drug candidates. We also note that aqueous biphasic system rehydration-mediated particle exclusion is a novel concept for use of polymer materials that may have micropatterning utility beyond just cells.
4. Experimental
Phase diagram formation
Stock solutions of PEG (20% w/w, Mw:35K, Fluka) and (20% w/w DEX, Mw:500K, Pharmacosmos) were prepared in dH20. In 10 ml conicals, 19 ATPSs of differing compositions ranging from PEG (0.56% w/w) - DEX (19% w/w) to PEG (16% w/w) - DEX (0.94% w/w) were prepared using the stock phase solutions. The weight of each conical with the ATPS was recorded. Each ATPS was titrated drop-wise with dH20 until a single phase was obtained. The conical was centrifuged (2000g, 3 min) to ensure formation of a single phase. The final weight of the conical with the one-phase system was recorded and used to calculate the weight of diluent added for one-phase formation. The binodal was determined through plotting the final composition of each system. A relationship derived by Merchuk et al. was fitted to the data using a non-linear least squares regression.[37]
Printing of cell-excluding DEX droplets in 96-well plates
Solutions of the DEX phase (6.4% w/w, Mw:500K) were prepared in culture media and kept at 4°C until use. The tip magazine of an automated liquid handler (CyBi-Well, CyBio) was loaded with 96 sterile pipette tips (25 μl, CyBio). A defined volume (75 μl) of the DEX solution was pipetted into each well of a 96-well microplate (Corning), which was then placed on the stage of the liquid handler. To load pipette tips with the DEX solution, the stage was slowly raised until the pipette tips were slightly inside the DEX solution. The DEX solution (10 μl) was aspirated into the tips at a rate of 5 μl/s. The loaded tips were brought within the proximity (200 μm) of the bottom of the wells of an empty microplate and a small amount (0.8 μl) of the DEX solution was dispensed onto the surface at a rate of 0.5 μl/s to form circular droplets. The microplate was kept in a culture hood for at least 24 hrs to allow the droplets to dry. Images of the dried droplets were captured using a bright-field microscope (Nikon, TS-200). The Feret diameters of the droplets were determined using the “Analyze Particles” function of ImageJ (NIH). Droplets whose Feret diameters were not within ~1% of the desired mean diameter were excluded from use in the assay. The entire printing and drying process was performed in a sterile culture hood.
Cell culture
Three different human cancer cell lines were used: MDA-MB-231 breast cancer cells (ATCC) were cultured in DMEM medium supplemented with heat-inactivated fetal bovine serum (10% HI-FBS, Invitrogen), glutamine (1%, Invitrogen), and antibiotic (1%, Invitrogen). A549 lung cancer cells (ATCC) were cultured in F-12K medium (ATCC) supplemented with HI-FBS (10%) and antibiotic (1%). PC-3 prostate cancer cells were cultured in DMEM supplemented with HI-FBS (10%) and antibiotic (1%). Cells were maintained in a cell culture incubator (37°C, 5% CO2, 95% humidity). When at desired confluence, cells were washed with PBS and Hank’s-based enzyme-free cell dissociation buffer was added to the flask. Cells were incubated (30 min) and then collected and suspended in complete growth medium. After centrifuging down (5 min, 1000 rpm, 4°C), cells were resuspended in an appropriate volume of the culture medium to give a density of 2×10⁶ cells/ml.
Cell-exclusion patterning using the two-phase media
Aqueous solution of the PEG phase (5.0% w/w, Mw:35K) was prepared in culture media and kept at 4°C until use. This solution was added to the cell suspension at a 1:1 (v/v) ratio to give a final PEG phase concentration of 2.5%. Prior to this step, cell suspension density was adjusted by addition of culture media to result in a final density of 4.5×10⁴ MDA-MB-231 cells, 4.0×10⁴ A549 cells, and 4.5×10⁴ PC-3 cells after addition of the PEG-containing media. These cell densities were selected from preliminary experiments that evaluated the number of cells required to form a confluent monolayer per unit surface area. A defined volume (80 μl) of the resulting solution was added to each well of a 96-well plate, which was incubated for 12 hrs (37°C, 5% CO2, 95% humidity). Then, the two-phase media was washed out and replaced with regular culture media. This was set as the time zero of the migration experiment.
High throughput automated image analysis of cell migration
To determine A1 and A2, cells were stained with a fluorescent dye and imaged at a magnification of 2.8X. In order to perform unbiased measurements of area on a large number of images, we devised an automatic protocol to process images and measure the void area within each image not occupied by migrating cells. Using the scripting language of ImageJ,[38] each image was loaded (Figure SI-3-1) and its background was removed (Figure SI-3-2). Then all empty regions within the image were determined using thresholding (Figure SI-3-3). Subsequently, a set of despeckling, dilating and eroding steps was used to remove artifacts of thresholding and further correct the images by eliminating regions and objects that were too small compared to the size of a cell (Figure SI-3-4). This resulted in a single open area in the middle of the image with a precise contour of the edge formed by the migrating cells. To account for the small number of cells already inside this area, we subtracted them from the total area. Overlaying the resulting image (shown with a red border line in SI-3-5) with the original unprocessed image confirms correct identification of the border of migrating cells and the accuracy of this image processing procedure. This procedure was performed automatically for all images resulting in the corresponding area data. After ensuring that the size of cell-excluded area was consistent throughout a plate for a given printed DEX droplet diameter, we only stained and imaged cells at the end time point of the experiment to save user time.
Treatment of cells with blebbistatin and anti-cancer drugs
After allowing MDA-MB-231 cells to spread and form a confluent monolayer around the cell-excluded gaps, we treated them with (±)-blebbistatin at different concentrations in the range 5-200 μM or anti-cancer drugs paclitaxel, colchicine, and nocodazole in the concentration range of 1-1000 nM. Cells were incubated in the presence of blebbistatin (18 hrs), washed with PBS once, and regular culture medium was added. Incubation continued for another 12 hrs before imaging. To study the effect of anti-cancer drugs, cells were incubated with each drug (2 hrs), washed with PBS, and then supplied with culture medium. Imaging was performed after 30 hrs of incubation. Experiments were set in 30 replicates. All reagents were purchased from Sigma.
Cellular staining
After migration experiments were complete, cells were stained with Calcein AM (5 μM) and the plates were incubated at 37°C for 30 min. The dye solution was gently removed and culture medium was added to wells. We stained MDA-MB-231 cells for actin filaments. First, cells were fixed in a paraformaldehyde solution (4.0%) for 10 min. After washing cells with PBS, they were permeabilized with Triton X-100 (0.1%) solution in PBS for 5 min. To reduce non-specific binding, cells were treated with a BSA solution (1.0%) as the blocking reagent for 30 min. Cells were incubated with Alexa Fluor 594-conjugated Phalloidin (165 nM) for 20 min. Finally, cells were washed three times with PBS before imaging using an inverted fluorescence microscope (Nikon, TE300). The resulting images were pseudocolored in Photoshop 10.0 CS3 (Adobe).
Supplementary Material
Acknowledgments
Financial support for this research was provided by the National Institute of Health (CA136829; HL-084370, CA136553, and P50CA093990), Coulter Foundation, and the UM-CCG-LSI-Thermo Fisher Scientific Pilot Project.
Footnotes
Supporting Information is available online from Wiley InterScience or from the author.
References
- 1.Tomaskovic-Crook E, Thompson EW, Thiery JP. Breast Cancer Res. 2009;11:213. doi: 10.1186/bcr2416. [DOI] [PMC free article] [PubMed] [Google Scholar]
- 2.Friedl P, Gilmour D. Nature Rev Mol Cell Biol. 2009;10:445. doi: 10.1038/nrm2720. [DOI] [PubMed] [Google Scholar]
- 3.Jacinto A, Martinez-Arias A, Martin P. Nature Cell Biol. 2001;3:E117. doi: 10.1038/35074643. [DOI] [PubMed] [Google Scholar]
- 4.Lammermann T, Bader BL, Monkley SJ, Worbs T, Wedlich-Soldner R, Hirsch K, Keller M, Forster R, Critchley DR, Fassler R, Sixt M. Nature. 2008;453:51. doi: 10.1038/nature06887. [DOI] [PubMed] [Google Scholar]
- 5.Montell DJ. Science. 2008;322:1502. doi: 10.1126/science.1164073. [DOI] [PubMed] [Google Scholar]
- 6.Ridley AJ, Schwartz MA, Burridge K, Firtel RA, Ginsberg MH, Borisy G, Parsons JT, Horwitz AR. Science. 2003;302:1704. doi: 10.1126/science.1092053. [DOI] [PubMed] [Google Scholar]
- 7.Liang CC, Park AY, Guan JL. Nature Protoc. 2007;2:329. doi: 10.1038/nprot.2007.30. [DOI] [PubMed] [Google Scholar]
- 8.Simpson KJ, Selfors LM, Bui J, Reynolds A, Leake D, Khvorova A, Brugge JS. Nature Cell Biol. 2008;10:1027. doi: 10.1038/ncb1762. [DOI] [PubMed] [Google Scholar]
- 9.Yarrow JC, Perlman ZE, Westwood NJ, Mitchison TJ. BMC Biotech. 2004;4:21. doi: 10.1186/1472-6750-4-21. [DOI] [PMC free article] [PubMed] [Google Scholar]
- 10.Kam Y, Guess C, Estrada L, Weidow B, Quaranta V. BMC Cancer. 2008;8:198. doi: 10.1186/1471-2407-8-198. [DOI] [PMC free article] [PubMed] [Google Scholar]
- 11.Watanabe S, Hirose M, Wang XE, Maehiro K, Murai T, Kobayashi O, Mikami H, Otaka K, Miyazaki A, Sato N. J Clin Gastroenterol. 1995;21:S40. [PubMed] [Google Scholar]
- 12.Keese CR, Wegener J, Walker SR, Giaever I. Proc Natl Acad Sci USA. 2003;101:1554. doi: 10.1073/pnas.0307588100. [DOI] [PMC free article] [PubMed] [Google Scholar]
- 13.Poujade M, Grasland-Mongrain E, Hertzog A, Jouanneau J, Chavrier P, Ladoux B, Buguin A, Silberzan PP. Proc Natl Acad Sci USA. 2007;104:15988. doi: 10.1073/pnas.0705062104. [DOI] [PMC free article] [PubMed] [Google Scholar]
- 14.Irima D, Toner M. Integ Biol. 2009;1:506. doi: 10.1039/b908595e. [DOI] [PMC free article] [PubMed] [Google Scholar]
- 15.Jiang X, Ferrigno R, Mrksich M, Whitesides GM. J Am Chem Soc. 2003;125:2366. doi: 10.1021/ja029485c. [DOI] [PubMed] [Google Scholar]
- 16.Yeo WS, Yousaf MN, Mrksich M. J Am Chem Soc. 2003;125:14994. doi: 10.1021/ja038265b. [DOI] [PubMed] [Google Scholar]
- 17.Bhattacharjee N, Li N, Keenan TM, Folch A. Integ Biol. 2010;2:669. doi: 10.1039/c0ib00038h. [DOI] [PMC free article] [PubMed] [Google Scholar]
- 18.Tavana H, Jovic A, Mosadegh B, Lee QY, Liu X, Luker KE, Luker GD, Weiss SJ, Takayama S. Natute Mater. 2009;8:736. doi: 10.1038/nmat2515. [DOI] [PMC free article] [PubMed] [Google Scholar]
- 19.Bamberger S, Seaman GVF, Sharp KA, Brooks DE. J Colloid Interface Sci. 1984;99:194. [Google Scholar]
- 20.Tavana H, Mosadegh B, Takayama S. Adv Mater. 2010;22:2628. doi: 10.1002/adma.200904271. [DOI] [PMC free article] [PubMed] [Google Scholar]
- 21.Rosen P, Misfeldt DS. Proc Natl Acad Sci USA. 1980;77:4760. doi: 10.1073/pnas.77.8.4760. [DOI] [PMC free article] [PubMed] [Google Scholar]
- 22.Kaur S, Samant GV, Pramanik K, Loscombe PW, Pendrak ML, Roberts DD, Ramchandran R. BMC Cell Biol. 2008;9:61. doi: 10.1186/1471-2121-9-61. [DOI] [PMC free article] [PubMed] [Google Scholar]
- 23.Szczur K, Xu H, Atkinson S, Zheng Y, Filippi M-D. Blood. 2006;108:4205. doi: 10.1182/blood-2006-03-013789. [DOI] [PubMed] [Google Scholar]
- 24.Micalizzi DS, Farabaugh SM, Ford HL. J Mammary Gland Biol Neoplasia. 2010;15:117. doi: 10.1007/s10911-010-9178-9. [DOI] [PMC free article] [PubMed] [Google Scholar]
- 25.Kovacs M, Toth J, Hetenyi C, Malnasi-Csizmadia A, Sellers JR. J Biol Chem. 2004;279:35557. doi: 10.1074/jbc.M405319200. [DOI] [PubMed] [Google Scholar]
- 26.Watanabe M, Yumoto M, Tanaka H, Wang HH, Katayama T, Yoshiyama S, Black J, Thatcher SE, Kohama K. Am J Physiol Cell Physiol. 2010;298:C1118. doi: 10.1152/ajpcell.00269.2009. [DOI] [PubMed] [Google Scholar]
- 27.Petroll WM, Ma L, Kim A, Ly L, Vishwanath M. J Cell Physiol. 2008;217:162. doi: 10.1002/jcp.21487. [DOI] [PMC free article] [PubMed] [Google Scholar]
- 28.Zhang J-H, Chung TDY, Oldenburg KR. J Biomol Scr. 1999;4:67. doi: 10.1177/108705719900400206. [DOI] [PubMed] [Google Scholar]
- 29.Schiff PB, Horwitz SB. Proc Natl Acad Sci USA. 1980;77:1561. doi: 10.1073/pnas.77.3.1561. [DOI] [PMC free article] [PubMed] [Google Scholar]
- 30.Yvon A-MC, Wadsworth P, Jordan MA. Mol Biol Cell. 1999;10:947. doi: 10.1091/mbc.10.4.947. [DOI] [PMC free article] [PubMed] [Google Scholar]
- 31.Cronstein BN, Molad Y, Reibman J, Balakhane E, Levin RI, Weissmann G. Clin Invest. 1995;96:994. doi: 10.1172/JCI118147. [DOI] [PMC free article] [PubMed] [Google Scholar]
- 32.Mythreye K, Blobe GC. Proc Natl Acad Sci USA. 2009;106:8221. doi: 10.1073/pnas.0812879106. [DOI] [PMC free article] [PubMed] [Google Scholar]
- 33.Tran T-A, Gillet L, Roger S, Besson P, White E, Le Guennec J-Y. Biochem Biophys Res Comm. 2009;379:304. doi: 10.1016/j.bbrc.2008.12.073. [DOI] [PubMed] [Google Scholar]
- 34.Lemor M, de BustrGlaser BM. Arch Ophthamol. 1986;104:1223. [Google Scholar]
- 35.Umeshima H, Hirano T, Kengaku M. Proc Natl Acad Sci USA. 2007;104:16182. doi: 10.1073/pnas.0708047104. [DOI] [PMC free article] [PubMed] [Google Scholar]
- 36.Naffar-Abu-Amara S, Shay T, Galun M, Cohen N, Isakoff SJ, Kam Z, Geiger B. PLoSone. 2008;3:e1457. doi: 10.1371/journal.pone.0001457. [DOI] [PMC free article] [PubMed] [Google Scholar]
- 37.Merchuk JC, Andrews BA, Asenjo JA. J Chromat B. 1998;711:285. doi: 10.1016/s0378-4347(97)00594-x. [DOI] [PubMed] [Google Scholar]
- 38.Abramoff MD, Magelhaes PJ, Ram SJ. Biophoton Inter. 2004;11:36. [Google Scholar]
Associated Data
This section collects any data citations, data availability statements, or supplementary materials included in this article.