

Abstract
Metal K-edge X-ray absorption spectroscopy (XAS) has been extensively applied to bioinorganic chemistry to obtain geometric structure information on metalloprotein and biomimetic model complex active sites by analyzing the higher energy extended X-ray absorption fine structure (EXAFS) region of the spectrum. In recent years, focus has been on developing methodologies to interpret the lower energy K-pre-edge and rising-edge regions (XANES) and using it for electronic structure determination in complex bioinorganic systems. In this review, the evolution and progress of 3d-transition metal K-pre-edge and rising-edge methodology development is presented with particular focus on applications to bioinorganic systems. Applications to biomimetic transition metal–O2 intermediates (M = Fe, Co, Ni and Cu) are reviewed, which demonstrate the power of the method as an electronic structure determination technique and its impact in understanding the role of supporting ligands in tuning the electronic configuration of transition metal–O2 systems.
Keywords: X-ray absorption spectroscopy, Metal K-edge, Electronic structure, Bioinorganic chemistry, Transition metal–dioxygen complexes
1. Structure and aim of review
1.1. XAS: an electronic structure determination technique in bioinorganic chemistry
X-ray absorption spectroscopy (XAS) is a powerful geometric and electronic structure determination technique that has found widespread application in bioinorganic chemistry, in particular, to 3d-transition metal systems [1–4]. The unique strength of XAS lies in its element specificity and its applicability to systems in homogeneous and heterogeneous phases. This means that biological samples can be measured in amorphous, crystalline or solution states, including as mixtures and the electronic and geometric structure of each distinct metal and ligand present in the active site of interest can be probed separately, without interference from other elements. In addition to these unique advantages, XAS can be measured on “spectroscopically quiet” elements such as Zn2+, Cu1+ and Fe2+, often making it the only spectroscopic technique applicable to systems containing these elements [5]. Traditionally, transition metal K-edge XAS has been used to extract the extended X-ray absorption fine structure (EXAFS) from the spectrum for local geometric structure determination around a metal ion of interest [1,2,4,6–8]. However, over the past 15 years, bioinorganic chemists have also focused on the K-pre-edge and rising-edge region (of 3d-transition metals, together called the XANES region) in order to extract electronic structure information from the system of interest and have extended their spectroscopic toolkit to include metal K- and L- and ligand K-edges [9–13]. This field has been revolutionized by the advent of theoretical methods, which accurately describe the XANES spectra and by cheap and efficient computing power, which allow for fast theoretical calculations on complicated bioinorganic systems [14,15].
The first part of this review will focus on recent advancements in XANES toward understanding and interpreting the metal K-rising-edge and pre-edge region in order to extract electronic and geometric structure information about the bioinorganic site of interest. This review article does not attempt to give a comprehensive list of publications in the field of XAS or XANES, which are numerous; instead a select number of articles showcasing applications of XANES in the field of bioinorganic chemistry are discussed and referenced.
1.2. Application of XANES to M–O2 intermediates
Mononuclear metalloprotein active sites that activate and/or transport dioxygen typically form an active M–O2 (M = transition metal) complex in the first step of catalysis. Depending on the system, this first interaction can lead to the formation of a bound O2, superoxide or peroxide species and correspondingly varying degrees of oxidation at the metal site. Such species have been either shown to exist or implicated in Cu containing proteins including those involved in peptide hormone synthesis such as dopamine β-monooxygenase (DβM) and peptidylglycine α-hydroxylating monooxygenase (PHM) [16,17], and galactose oxidase [16], heme Fe containing proteins such as cytochrome P450, cytochrome c oxidase and cytochrome c peroxidase [18], a large class of non-heme Fe containing protein involved in oxidation, oxygenation, desaturation and reduction of O2 to water (see Table 1 in Ref. [19]) [19–21], etc. and Mn containing proteins such as manganese super-oxide dismutase (Mn-SOD) [22,23]. Synthetic efforts have been dedicated toward mimicking the structure/function of the transient intermediates generated in the catalytic mechanism of the above-mentioned class of enzymes and in general toward understanding the nature of M–O2 interactions in transition metal complexes [24–28]. These typically transient or unstable M–O2 intermediates have been studies using a wide-range of spectroscopic and theoretical tools including synchrotron based XANES and EXAFS techniques. In the second part of this review, recent applications of XANES to M–O2 (M = Fe, Co, Ni and Cu) containing synthetic systems will be discussed.
2. X-ray absorption near-edge spectroscopy
An X-ray absorption spectrum is obtained when a core electron is supplied with sufficient X-ray energy to be excited to the valence and conduction bands (called the XANES region). In the context of hard X-ray absorption spectroscopy on transition metal complexes, with partially occupied 3d-orbitals, XANES is further subdivided into the “pre-edge” region, which consists of weak, electric dipole-forbidden and quadrupole allowed transitions of the core electrons into valence 3d and charge transfer levels (these weak transitions can gain intensity via d-p mixing, vide infra) and the “near-edge” region which comprise of the rising-edge, white-line and ~20–50 eV above the white-line (Note that in soft- and tender X-ray absorption spectroscopy (~250–3000 eV), pre- and near-edge regions are typically treated together).
When the electron absorbs enough energy to overcome the core potential, the resulting photoelectron undergoes a complex array of scattering interactions with the neighboring atoms resulting in the so-called EXAFS region (Fig. 1). This region is used for local geometric structure determination and is very well established in bioinorganic chemistry and several reviews, books and book chapters are available that give a comprehensive description of the technique. Early reviews of the experimental aspects include the chapter by Stern in the book by Koninsberger and Prins, book by Teo and by Iwasawa and articles by Hodgson, and Fonda [1,2,6,7]. Application of EXAFS in the field of bioinorganic chemistry has been described in the book by Solomon and Lever and in review articles by George and Penner-Hahn [5,8,29]. Theoretical advancements in EXAFS have led to development of multiple scattering codes such as FEFF and GNXAS and have been summarized in excellent reviews by Rehr [30–32]. In contrast, a complete quantitative description of the “near-edge” region of the XANES spectrum has not been fully achieved. In this energy range, in addition to a need for proper description of the core hole, long-range multiple scattering contributions become important, which has not yet been addressed completely by theory. In an attempt to bridge this gap, several theoretical packages including FEFF, CONTINUUM, WIEN98, GNXAS, etc. are being used to simulate the near-edge region and to extract local geometric structure information around the absorbing atom with varying degree of success. Recent reviews by J. Rehr presents the current status of XANES theoretical modeling using multiple scattering theory [33–35]. In addition to ab initio multiple scattering programs mentioned above, DFT based methods have also been employed for geometric structure determination, such as StoBe and Wien2k, which focus on the first >200 eV of the XANES spectrum. In recent years, DFT programs such as ORCA have focused on investigating the electronic structure contribution to the low-lying pre-edge region. It is hoped that this intense focus on the theoretical aspects of the XANES region, will lead to the development of a full quantitative solution in the near future.
Fig. 1.

Schematic representation showing the excitation of a core (1s) electron. Transition to discreet valence levels (3d and higher for first-row transition metal complexes) leads to the XANES region. Transition to the continuum level leads to the EXAFS region.
The X-ray absorption coefficient (μ) is given by Fermi’s golden rule as described in Eq. (1). Here, φi and φf are the initial and final states of the X-ray absorption process, δEf−Ei−hv is the change in the photoelectron energy and ê.r is the electric dipole matrix element, which couples the initial and final states as follows:
| (1) |
In the one-electron approximation of the Fermi Golden rule, all other electrons in the initial and final states are assumed to be “inactive” and “frozen” and can be neglected. In such a scenario, φf can essentially be treated as the initial state with a core hole, c- and a valence electron ∈ or as c ∈ φi and the absorption coefficient can be simply described by:
| (2) |
where ∈ represents the excited electron and c the core electron and ρ describes the density of states. Imposition of the electric dipole selection rule means that only Δl = ±1 and ρs = 0 transitions are allowed. In the context of transition metal K-edges, the pre-edges are all 1s→3d (Δl = +2) quadrupole allowed transitions, which are typically ~1% as intense as dipole allowed 1s→4p transitions and occur as weak features just below the onset of the rising edge. These weak pre-edge features hold key electronic structure information on spin states, ligand-field strength and related energy splitting, covalency, metal symmetry related 4p-mixing and Zeff (effective nuclear charge). Fig. 2 shows a representative set of Fe K pre-edge data that demonstrate the differences in spectral shape and energy distribution due to these factors. The pre-edge coupled to the rising-edge shape and energy shifts can be, in many cases, used to describe the electronic structure of species in its entirety. Here, the effect of these electronic factors on the pre-edge and rising-edge region are presented, with a few examples of applications in bioinorganic chemistry.
Fig. 2.

Representative Fe K-edge XAS spectra of discreet Fe complexes from Fe(II) to Fe(VI) oxidation state. The change in oxidation state is reflected by the almost 5 eV difference in rising edge energies. The inset shown the expanded pre-edge region, which displays the rich spectral shape associated with the 1s→3d transition. The oxidation state, spin-state, 3d–4p mixing and ligand-field around the absorbing atom together dictate the spectral intensities and energies.
Spectra adapted from Refs. [46,76,83]. Reprinted with permission.
2.1. Metal K-rising-edge region
2.1.1. Effective nuclear charge: Zeff
The effective nuclear charge of the absorbing metal center has a direct consequence on the energy position of the rising-edge. Typically, as the Zeff of the absorbing atom increases, the rising-edge shifts to higher energy. This is because the core (1s) level feels a stronger effect of change in Zeff relative to the very weakly bound and screened valence level. As Zeff increases, the energy gap between the core and the weakly bound valence level increases and hence the rising-edge shifts to higher energy. In bioinorganic chemistry, the rising-edge position (either the edge inflection point or the white line maxima) has been widely used as a marker of metal oxidation state, (which results in a large change in Zeff) [36–39]. In a novel application by Yachandra et al., the shift in the rising edge position due to change in Zeff has been used to demonstrate and quantitate the fast photoreduction of the Mn4Ca cluster of photosystem II in a single crystal [40].
Although the rising-edge energy position shifts to higher energies with increase in Zeff, there are several exceptions to the rule. As discussed in sections below, there are other factors that can affect this energy position and where possible comparisons should be made between systems that are in the same spin state, similar ligand systems and with similar geometry. As an interesting exception to the rule, Ni complexes do not demonstrate particularly large rising-edge shifts with change in oxidation state and in some cases there is no observable edge-shift. Fig. 3 shows an example of two sets of M(II/III) (M = Ni and Cu) isoleptic compounds. These examples, which have been chosen to eliminate the effect of ligands and geometry on the edge shift, demonstrate that a much larger rising-edge shift is observed for the Cu(II/III) pair relative to the Ni(II/III) pair.
Fig. 3.

Metal K-edge spectra of isoleptic (II/III) pairs. (A) Ni K-edge data for [Ni(cyclam)Cl2 ] (–○–) and [Ni(cyclam)Cl2 ](ClO4) (- -●- -) (cyclam = 1,4,8,11-tetraazacyclotetradecane), adapted from Colpas et al. [39]. Reprinted with permission. Copyright 1991 American Chemical Society. (B) Cu K-edge data for (Bu4 N)[LCuOH] (–○–) and [LCuOH] (L = N,N′-bis(2,6-diisopropylphenyl)-2,6-pyridinedicarboxamide) (- -●- -) [36].
2.1.2. Ligand type
In the absence of a robust theoretical description for the metal K-rising-edge, the shape and energy position of this region has been correlated with the ligand-type and metal–ligand bond distance in transition metal complexes as a fingerprint for the presence of certain type of ligands. It has been empirically shown in Fe, Ni, Mn and Cu complexes that the rising-edge shifts to lower energy when L = S or Cl [37,39,41,42]. One interpretation is derived from the fact that with these ligand systems, the metal–ligand covalency is higher than with ligands containing lighter atoms such as O and N. This higher covalency leads to charge neutralization of the central metal, thereby decreasing the Zeff and leading to the shift of the rising-edge to lower energies. The higher covalency also leads to delocalization of metal 4p orbitals and hence the intensity of the main edge transition also decreases. Together these two effects should theoretically lead to a broader rising-edge spectrum, which is shifted to lower energies with heavier S and Cl containing ligands. Using this rule of thumb, researchers have predicted the nature of ligand in unknown bioinorganic systems by comparing their metal K-rising-edge energy positions with data from known related structural models [41,42].
A second interpretation of the shift in the rising-edge energy with change in the type of ligand is based on multiple scattering theory, which proposes that the rising-edge energy position should be related to M–L bond distance, R, by the rule proposed by Natoli [43,44]:
| (3) |
The Natoli rule has been widely and successfully applied to both light atom and transition metal systems [45–47]. This relation was empirically modified by several authors including by Mahto and Chetal [48], who proposed the new relation:
| (4) |
where u and s represent unknown and standard systems, respectively, and k is the magnitude of photoelectron wave vector given by (2m/h2)(E − E0)1/2. This inverse relationship of energy and bond-distance are consistent with the observation that S and Cl based ligands shift the rising-edge to lower energy, since the typical M–S and M–Cl distance is longer than M–O and M–N distances. This relationship has an important consequence on metal K-edge XANES of transition metal systems that can exist in different spin-states. Typically, there is an ~2 eV shift on going from a high-spin Fe(II) to a high-spin Fe(III) complex. However, low-spin Fe(II) and high-spin Fe(III) species with similar ligand systems can have similar bond distances [49] and often their rising-edges occur very close in energy, indicating that spin-states must be taken into consideration when assigning oxidation states based on edge-energies. Rudd et al. have demonstrated the effect of spin-states on edge energies in a series of temperature dependent spin-crossover mononuclear Fe(II) systems [50].
2.1.3. 1s→4p transition
In transition metal K-edges, the 1s→4p transition is dipole allowed and is over two orders of magnitude more intense than the pre-edge. In most cases, this transition is obscured by the onset of the rising-edge and is rarely observed. However, in the case of Cu(I) and some Zn(II) complexes the 1s→4p transition is low lying and is observed as an intense feature on the rising edge. In 1987, Solomon et al. developed a qualitative approach to correlate the intensity and energy of the rising edge feature in a variety of Cu(I) complexes [42]. In this method, the ligand field induced perturbation of the three-fold degenerate 4px,y,z level is considered (see Fig. 4). In the case of a linear two-coordinate molecule, the Cu-L interaction is along the z-axis, which destabilizes the pz orbitals relative to the degenerate px,y orbital resulting in an intense rising-edge feature corresponding to the 1s→4px,y transition. The higher lying 1s→4pz transition is less than half as intense as the 1s→4px,y transition (as the covalent Cu–L interaction delocalizes the 4pz character) and is typically buried in the edge and not observed as a separate feature. Three coordinate Cu(I) complexes are T-shaped (see Fig. 4) with trigonal planar being the limiting symmetrical case. A three-coordinate ligand field can be considered as a perturbation of the two-coordinate model in which a third ligand is introduced in the yz plane. This destabilizes py relative to px resulting in splitting of the 1s→4px and 1s→4py transitions and decrease in the transition intensity. In some cases two rising-edge features are observed that can be attributed to the split 4p levels. Thus, 3-coordinate systems have lower 1s→4p transition intensity relative to 2-coordinate complexes. Four-coordinate Cu(I) complexes typically have tetrahedral geometry. The 4p orbitals are degenerate, shifted to higher energy and each individual transition has lower intensity than the 1s→4px transition of the two- and three-coordinate cases. This leads to a transition that is buried in the rising-edge and only appears as a shoulder to higher energy. Fig. 5 shows Cu K-edge XANES spectra of Cu(I) complexes with the three geometries considered above.
Fig. 4.
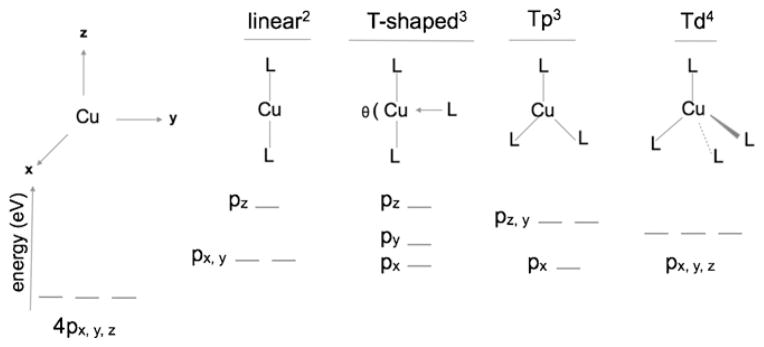
A qualitative diagram showing the ligand-field splitting of the 4p orbital. Tp = trigonal planar, Td = tetrahedral, L = ligand. Superscripts show the coordination number. In the T-shaped model, the angle θ (180 ≥ θ ≥ 120) determines the relative splitting between the px and py orbitals.
Fig. 5.

Cu K-edge spectra Cu(I) complexes. Two-coordinate; [Cu(trimethylpyridine)2 ](BF4) (–●–) three-coordinate; [Cu(L)](BF4) (L = 2,2′-bis(2-(N-propylbenzimidazolyl))diethyl sulfide) (- -○- -) and 4-coordinate; [Cu(pyridine)4](ClO4) (–◆–).
This qualitative approach has been used by Solomon et al. to determine geometric structure and this approach has been applied to understanding the geometric structure and reactivities of several Cu containing metalloenzymes such as laccase, fet3p, hemocyanin and Cu/ZnO methanol synthesis catalyst [42,51–55].
In contrast to Cu(I) complexes, which have intense features on the rising-edge, oxidized Cu(II) species have higher lying 1s→4p transitions that are shifted into the rising-edge. And often only appear as unresolvable shoulders leading to typically featureless rising-edges for Cu(II) complexes (except for some tetragonal Cu(II) systems which have edge features arising due to shakedown transitions or long-range multiple scattering, vide infra). This difference between the Cu(I) and Cu(II) rising-edge has been exploited as a fingerprint for determining the oxidation state of Cu in a variety of metalloprotein active sites, for example, galactose oxidase (GO), hemocyanin, cytochrome c oxidase (CcO), dopamine β-monoxygenase (DβM) and peptidylglycine α-hydroxylating monooxygenase (PHM) [55–61]. In systems that have more than one Cu center in both Cu(I) and Cu(II) oxidation states, edge-simulations can be performed to determine the Cu(I)/Cu(II) ratio [62,63].
2.1.4. Multiple scattering feature
As mentioned before, a complete quantitative treatment of the entire XAS spectrum has yet to be developed. Typically, the spectrum is divided into the well-understood EXAFS and pre-edge region, while the intermediate region (onset of the rising-edge to 30 eV above the edge) is treated with semi-quantitative methods. To this end, one of the first multiple-scattering structure determination codes was developed by Natoli et al. and has been applied to bioinorganic and spin crossover coordination compounds [64–67]. Recent developments in two ab initio codes, FEFF and MXAN have been applied for structure determination applications in bioinorganic systems [41,68–70]. This has also shed light on the multiple-scattering based origin of certain rising-edge features [71].
The multiple scattering approach calculates the total absorption cross-section as a function of energy for a given structural model. The total absorption cross-section of the photoelectron is written in terms of the atomic scattering amplitudes and the free electron propagator. The free electron propagator term has a form of 1/kR where k is the photoelectron wave vector and R is the interatomic distance. As mentioned before, the photoelectron wave vector is given by (2m/h2)(E −E0)1/2, where E0 is the threshold energy. At the rising-edge where E is close to E0, k is very small, indicating that the contributions from very large interatomic distances can be significant to the rising edge. This has been demonstrated by Frank et al. in applications to solvated Cu(II) complexes [71,72], where they show that rising edge features appear only when long range multiple scattering contributions are considered. Fig. 6 shows the Cu K-edge XANES data for a Cu(II) ion solvated in liquid NH3. The data are fit with a 5-coordinate nearest neighbor model; however, a good fit to the rising-edge feature is obtained only when the second-shell water contributions are included. In the multiple scattering fitting routine, these edge features are typically better reproduced using the non-muffin-tin method of XANES calculation, for example the finite difference method [73,74].
Fig. 6.

Cu K-edge spectra of Cu(II) in aqueous NH3 (dotted lines). The solid lines represent multiple scattering fits performed using MXAN, which employs the CONTINUUM code. The fits show that the rising-edge feature can be well reproduced only when long-range water scatterers are included.
Figure adapted from Fig. 9 in Ref. [56]. Reprinted with permission. Copyright 2008 American Chemical Society.
2.1.5. Shakedown transition
Square planar 3d-transition metal complexes often have intense rising edge features attributed to ligand to metal charge transfer transitions (LMCT). These transitions have been extensively studied in Cu(II) complexes and early studies showed that they are z polarized along the higher lying 1s→4p transition [75,76]. Studies on Cu and Ni complexes by Kosugi et al. [77] and by Bair and Goddard [78] have shown that these transitions can be attributed to a formally forbidden two electron process; a parent metal 1s→4p transition, which results in concurrent ligand-to-metal charge transfer (LMCT), gains intensity because of final-state relaxation, and results in a lower lying “satellite” or “shakedown” transition. The intensity and energy position of these two transitions (i.e. the main 1s→4p and the satellite 1s→4p + LMCT transitions) can be used to compute the amount of ligand hole character in the ground state and get an estimate of covalency by solving the two-state equation described below.
If the ground state electronic configuration of a dn transition metal is represented as a linear combination of the |3dn| configuration and the LMCT |3dn+1L| configuration then the Hamiltonian and configurations generating this ground state ΨG.S and the LMCT excited state ΨT.S are given by Eqs. (5)–(7), where Δ is the energy difference between the two components, which are coupled by the covalent interaction given by T (the transfer integral reflecting orbital overlap).
| (5) |
| (6) |
| (7) |
These equations are modified in the metal K-edge final state to include electronic relaxation as given by Eqs. (8)–(11):
| (8) |
| (9) |
| (10) |
| (11) |
where ΔF and TF are the charge-transfer energy and the electron-transfer matrix element, respectively, between the two configurations in the final state and ΨE.S1 and ΨE.S2 are the excited state and the charge-transfer excited state, respectively. Q is an atomic parameter equal to the core hole/valence–electronic Coulomb interaction. It describes the degree of relaxation of the valence electron configuration accompanying the creation of a core hole. For a metal with the same ligand set, it is expected to increase with increasing charge on the absorbing metal. If IMAIN, ISATELLITE, EMAIN, ESATELLITE intensity and energy positions of the main and satellite peaks are the four observables obtained from the metal K-edge data, then the above equations reduce to:
| (12) |
| (13) |
Typically, one or more of the unknowns are obtained by other methods and used with the observables from the metal K-edge spectra to estimate the ligand-hole character directly. This semi-quantitative approach has been used more recently to estimate covalency in biomimetic Cu(III) systems and in blue-copper proteins [76,79,80]. In the absence of the required parameters to compute the ground state covalency parameters directly, the energy and intensity of the satellite feature can be used to compare differences in covalency between two otherwise similar systems. As a rule of thumb, the intensity of the satellite feature increases and shifts to lower energy with an increase in the ligand-hole character in the ground state (increase in covalency).
In summary, rising-edge features are described as arising from one of the following three processes: ligand-field based 1s→4p transition, charge-transfer shakedown process or long-range multiple scattering. As mentioned, the ligand field approach is applicable to very specific systems, such as Cu(I) complexes and to light elements. The charge-transfer shakedown process is typically applied to covalent square planar systems and has been widely applied in solid-state physics. In XANES simulation using multiple scattering packages, the edge transition has been assigned as a long-range multiple scattering feature found for square planar and square pyramidal systems. Thus, in some case, the same transition might be assigned as both a shakedown and a multiple scattering feature. A general consensus is yet to be reached.
2.2. Metal K-pre-edge region
One of the first applications of Metal K-pre-edge XAS to metalloprotein systems was in 1976 by Shulman et al., who showed that the 1s→3d transition is affected by changes in oxidation state and ligand field [81]. In 1982, Hahn et al. used polarized synchrotron radiation and oriented single crystals of D4h CuCl42− to demonstrate the electric quadrupole nature of the 1s→3d transition [82]. This explained its very weak intensity since theoretical studies show that electric quadrupole coupling is two orders of magnitude weaker than electric dipole coupling.
In 1984, Roe et al. did a comprehensive Fe K-pre-edge study on high-spin Fe(III) model complexes, which were models for non-heme Fe protein active sites [83]. They quantitated the area under the pre-edge transition and correlated it with Fe 4p mixing using extended Hückle molecular orbital calculations. Their result has been reproduced in Fig. 7, which shows a near linear relationship between the Fe 4p character in the ground state and the total pre-edge intensity. The intensity at 0% Fe 4p mixing (~5 units) was attributed to the quadrupolar contribution. The Fe K-pre-edge data also show that the pre-edge intensity of one structural type is distinct from other structural types. These observations from the correlation in Fig. 7 led to the rule of thumb: IOCTAHEDRAL < I5-COORDINATE < ITETRAHEDRAL (I = intensity), which was applied to several Fe proteins and to bioinorganic systems containing Mn, Cu, Ni and Co [37–39,84]. Randall et al. extended this application to 22 high-spin Fe(II) complexes in 1995 and showed that the same rule is applicable to ferrous systems [85]. In a study involving a large number of Fen+ complexes, Westre et al. used a semi-quantitative methodology to interpret the Fe K-pre-edge transition [86]. This was among the first studies aimed at correlating not only the total intensities, but also the energy splitting and intensity distribution with the geometric and electronic structure of the Fe center in high-spin ferrous and ferric complexes in octahedral, tetrahedral, and square pyramidal environments and low-spin ferrous and ferric complexes in octahedral environments. The authors calculated the allowable many-electron excited states for the 1s→3d transition using ligand field theory to explain the energy splitting pattern and used molecular orbital theory to calculate the relative amounts of 4p mixing into each state.
Fig. 7.

Correlation of total pre-edge peak area of the Fe K-edge 1s→3d transition with the total percent Fe 4p contribution to the final state molecular orbitals. 6C, 5C and 4C represent 6-, 5- and 4-coordinate, respectively. Figure adapted from Fig. 2 in Ref. [73]. Reprinted with permission.
Copyright 1984 American Chemical Society.
In recent years, theoretical advances have enabled a complete quantitative treatment of the pre-edge 1s→3d transition using time-dependent density functional theory (TD-DFT) calculations. The TD-DFT protocol in the DFT package developed by Neese et al. has been used for quantitative applications in several systems in bioinorganic chemistry. DeBeer and Neese et al. have calibrated this TD-DFT protocol against experimental data for several well-characterized biomimetic model complexes with the aim of extending it to unknown systems [86,87].
In the following subsections, trends in metal K-pre-edge energy positions and intensities are correlated to geometric and electronic factors.
2.2.1. Effective nuclear charge: Zeff
The pre-edge feature (1s→3d transition) is affected by changes in Zeff in a similar manner as the rising-edge transition. For systems in the same spin-state and similar ligand environment and geometry, the pre-edge has been observed to shift to higher energy with increase in Zeff. However, changes in Zeff are typically linked with changes in the ligand environment and ligand-field, which can induce strong perturbations on the 3d energy levels making it difficult to separate the contribution of Zeff and ligand-field to pre-edge energy shifts. In 2006, we used a combination of Cu L-edge and K-edge XAS and TD-DFT calculations to separate the contribution of ligand-field from Zeff on the pre-edge energy position and showed that Zeff has only a minor contribution on pre-edge energy positions, with most of the energy shift occurring due to ligand field effects [79]. However, a large change in Zeff (for example, a full oxidation state change) results in a large enough change in ligand field such that the pre-edge position of Mn+1 is significantly higher than Mn+. This ligand field induced shift in energy position is often used as a fingerprint for oxidation state determination. For example, an ~2 eV shift of the pre-edge energy position is observed with the increase in ligand field associated with a one electron oxidation of Cu(II) to Cu(III), which has been used as a spectroscopic marker for validating the presence of Cu(III) in unknown systems [36,76,79,88].
2.2.2. Ligand field
The ligand field strength has a direct effect on the energy position of the metal K-pre-edge transition. For d9 systems (Cu2+) a single transition from the 1s level to the singly occupied 3d orbital is observed and the spectrum is devoid of the multiplet effects observed in the case of dn+ systems (n < 9) (see below). In this case, the effect of ligand field on the pre-edge feature can be interpreted in a simple fashion: (a) the pre-edge energy position shifts to higher energy with increase in ligand field strength and (b) the pre-edge intensity increases as the molecule deviates from centrosymmetry (i.e., increase in 3d–4p mixing). This approach has been used for ligand field strength comparison for blue copper and CuA proteins and model complexes [80,89–91].
In contrast to d9 systems, metal K-pre-edges of dn+ systems (n < 9) typically have multiple peaks. In a semi-quantitative attempt to explain the energy position and intensity pattern of these multiple peaks, Westre et al. used ligand-field theory to systematically explain the rich pre-edge spectral shape for several Fe containing model complexes [86]. Fits to their Fe K-pre-edge spectra for high-spin ferrous and ferric complexes have been reproduced in Fig. 8, and density functional theory simulations of the allowed final states spectral shape are overlaid. These results demonstrate the complexity of the effect of ligand field on allowed final state energy levels, which leads to the rich multiplet spectra. Note that since the allowed final states are different for both ferrous and ferric low-spin systems, so are the pre-edge spectral shapes.
Fig. 8.

Schematic representation showing the experimental Fe K-pre-edge XAS data for high-spin ferrous and ferric complexes in Oh, Td and C4v geometries and theoretical final states simulations based on density functional theory calculations for each case. Figure adapted from Figs. 1–6 of Ref. [76].
Reprinted with permission. Copyright 1996 American Chemical Society.
The findings of Westre et al. support the IOCTAHEDRAL < I5-COORDINATE < ITETRAHEDRAL rule of thumb proposed by Roe et al. (vide supra) (for the same spin and oxidation state, the least intense pre-edge feature is for the Oh complex in the left panel, while the most intense pre-edge features are for the Td complex in the right panel, see Fig. 8). This rule is a direct outcome of symmetry allowed 4p mixing into the 3d orbitals, leading to proportional inclusion of dipole allowed character into the electric quadrupole only pre-edge transition. In Oh symmetry the 3d orbitals transform as eg and t2g and the 4p transform as t1u, disallowing any 3d–4p mixing. In lower symmetries such as C4v and Td the orbitals transform as per the correlation table for Oh group (Fig. 9) and symmetry allowed 4p mixing can occur, which in turn leads to enhanced K-pre-edge intensity. In recent applications of bioinorganic chemistry, several high-valent metal-oxo and metal-nitrido systems have been investigated using metal K-pre-edge XAS, such as compound I intermediate in heme proteins and model complexes, MnV-oxo and MnV-nitrido complexes and FeV- and FeVI-nitrido complexes [92–96]. For these complexes an intense pre-edge feature is observed due to the presence of a short metal-oxo and metal-nitrido bond and significant 4pz mixing into the 3dz2 orbital.
Fig. 9.

Schematic showing symmetry based 4p mixing in common geometries of transition metal 3d complexes. In 4-coordinate (td) and 5-coordiante (C4v) systems transitions to the T2 and the E and A1 sets of orbitals, respectively, gain intensity via metal 3d–4p mixing.
In summary, the current accepted theoretical model shows that metal K pre-edges are affected by the interplay of several factors including ligand field, covalency, spin state and symmetry and small changes in these factors can lead to appreciable changes in the spectral shape. Some examples are shown in Table 1, which presents trends in pre-edge and rising-edge energy positions with changes in ligand field, Zeff and ligand type in select bioinorganic systems [15,36,39,42,97–100]. This fine dependency of spectral shape on several electronic factors cautions against the use of K-pre-edges as a simple fingerprint tool. On the other hand, since the pre-edge spectral shape for a transition metal dn+ complex is unique for a unique electronic structure, quantitative analysis of the pre-edge feature (in combination with density functional theory calculations) can be used to study both the geometric and electronic structure of unknown systems.
Table 1.
Trends in pre-edge and rising-edge energy shifts.
| Complex | Donor | Rising-edge | Pre-edge | Ref. | |
|---|---|---|---|---|---|
| Ligand field | |||||
| 1 | Fe2+ PAHT | 5N/O | – | 7111.4 | [97] |
| Fe2+ PAHR | 6N/O | – | 7111.7 | ||
| 2 | Cu2+ [{Cu(TMPA)}2 S2 ](ClO4)2 | 4N1 S | 8988.4 | 8978.5 | [98] |
| Cu2+ {Cu[HB(3,5-iPr2 pz)3 }]2 (S2) | 3N2 S | 8988.5 | 8979.3 | ||
| 3 | [Cu(SCPh3)(HB(3,5-i Pr2 pz)3)] | 3N1 S | – | 8978.8 | [99] |
| [Cu(SMeIm)(HB(3,5-iPr2 pz)3)] | 4N1 S | – | 8979.1 | ||
| Zeff | |||||
| 1 | Cu2+ (Bu4 N)[LCuOH] | 4O | 8989.5 | 8979.1 | [36] |
| Cu3+ [LCuOH] | 4O | 8991.6 | 8980.7 | ||
| 2 | Ni1+ MCRred1 | 4N1 O | 8341.0 | 8331.5 | [15] |
| Ni2+ MCRred1 | 4N1 O1 S | 8342.2 | 8332.0 | ||
| 3 | Co2+ [Co(12-TMC)MeCN](ClO4)2 | 5N | 7719.3 | 7709.2 | [100] |
| Co3+ [Co(12-TMC)O2 ](ClO4) | 4N2 O | 7720.6 | 7710.1 | ||
| Ligand type | |||||
| 1 | Ni(TPP) | 4N | 8342.9 | – | [39] |
| (Et4 N)[Ni(N2 S2)] | 2N2 S | 8340.6 | – | ||
| [Ni(SS2)]2 | 4S | 8338.9 | – | ||
| 2 | Cu(Im)4 (ClO4)2 | 4N | 8985.7 | 8978.1 | [42] |
| (creatinium)2 CuCl4 | 4Cl | 8984.8 | 8979.2 | ||
| Cu(2,5-DTH)2 (ClO4)2 | 4S | 8983.8 | 8979.9 |
3. Applications of XANES to M–O2 systems
Transition metal–O2 complexes are important intermediates in biological O2 activation reactions. Depending on the nature of metal–O2 interaction, several different geometric and electronic structure configurations are possible. As an example, Fig. 10 shows the combinations for different electronic and geometric configurations for a Co–O2 complex. Each configuration will give rise to a unique metal K-edge XANES spectrum and quantitative/comparative interpretation of both the metal K-pre-edge and rising-edge region can be used to find the correct solution, independently or in combination with other spectroscopies.
Fig. 10.

Scheme showing the range of geometric and electronic structure possibilities for Co–O2 systems. Not all combinations are chemically feasible.
3.1. Application of Fe K-edge XANES to Fe–O2 systems
Mononuclear non-heme iron enzymes that perform oxidative transformations by oxygen activation do so by forming transient dioxygen bound Fe species such as Fe(III)-peroxide and Fe(III)-hydroperoxide. Intense synthetic efforts by bioinorganic chemists have yielded biomimetic model complexes such as high-spin Fe(III)-peroxo, high- and low-spin Fe(III)-hydroperoxo, high-and low-spin Fe(III)-alkylperoxo species, that structurally and/or functionally mimic these transient intermediates. Several different supporting ligand systems have been successfully used (see Fig. 11) and some of these intermediate species have been investigated using Fe K-edge X-ray absorption spectroscopy [101–108]. In most of these studies, the Fe K-edge and pre-edge data have been used as a fingerprint for determining the oxidation state of the molecule, and the IOCTAHEDRAL < I5-COORDINATE < ITETRAHEDRAL rule has been applied to the pre-edge intensity to obtain indirect information on the metal environment and coordination.
Fig. 11.

Ligand systems used in Fe K-edge XAS studies of Fe(III)–OOX complexes. In R-TPEN (R = methyl, benzyl). In H-PaPy3 the H* gets deprotonated for ligation (see abbreviations).
In a study published in 2007, Shan et al. [105] catalogued the rising-edge and pre-edge energy positions of four high-spin LFe(III)-OOR species and correlated the data with Fe K-edge and pre-edge data for a variety of LFe(III)-OOX species (X is not applicable for peroxo, H for hydroperoxo and R for alkylperoxo). The different supporting ligand systems used in the study (L) were 4 to 7 coordinate (N4Py, Me-TPEN, SMe2N4(tren), H-PaPy3, 3-tBu-5-iPrpz, 6-Me2BPMCN and L8Py2). They observed that although the pre-edge energy positions of all species were characteristic of Fe(III) oxidation state, significant variability in the energy position (~3.7 eV spread) existed, which they ascribed to differences in the coordination number and coordinating ligands. They also observed significant variability in the near energy position (~3.7 eV), which they also attributed to differences in the coordinating ligands. Interestingly, a large spread in the pre-edge intensity was observed, even for complexes in similar coordination environment. As an example, six-coordinate low-spin Fe(III)-alkylperoxo, high-spin Fe(III)-alkylperoxo and low-spin Fe(III)-hydroperoxo complexes had average pre-edge intensities of 16–23 units, 10–15 units and 12–19 units, respectively. Based on these results, Shan et al. proposed that the previously well-established correlation between Fe K-pre-edge area and coordination number derived from a database of simple coordination complexes cannot be applied to high-spin Fe(III)-peroxo complexes and quantitative theoretical modeling is essential for accurate correlation of spectral shape to electronic structure.
Recently, time-dependent density functional theory has been applied to quantitatively predict metal K-edge 1s→3d transitions. Good correlation between experiment and theory has been obtained for both pre-edge energy pattern and intensities [14,87]. Notably the calculations demonstrate that pre-edge energy positions can be reasonably correlated with ligand field strength. Theory also shows that metal 3d–4p mixing and metal-ligand covalency (which affect the pre-edge intensities) are sensitive to small changes in geometry and a simple correlation between geometry and intensity breaks down when applied to data on complicated bioinorganic systems. However, it is important to realize that in related systems with similar supporting ligands, qualitative analysis of the pre-edge region can provide important information about the electronic structure and broad (but important) conclusions can be drawn from such comparisons.
3.2. Bonding differences in Cu–O2 adducts
Mononuclear Cu–O2 species are structural models in the first step of O2 activation by Cu containing proteins involved in peptide hormone synthesis. Despite intense biomimetic efforts to mimic the geometric and electronic structure of these protein intermediates, only a handful of model complexes have been synthesized that have an intact Cu–O2 moiety. Two such model complexes that have been structurally characterized are [Cu(O2)(HB(3-tBu-5-iPrpz)3)] (HB(3-tBu-5-iPrpz)3 is hydrotris(3-tert-butyl-5-isopropyl-1-pyrazolyl)borate, 1) [109] and [Cu(O2)(β-diketiminate)] (β-diketiminate is N,N′-bis(2,6-diisopropylphenyl)-2,2,6,6-tetra-methyl-3,5-pentanediiminato, 2) [110] (Fig. 12). The average first shell Cu-O/N bond distance in 1 and 2 are 1.92 and 1.84 Å and the O–O distances are 1.22 and 1.39 Å, respectively. Both species are EPR silent indicating possible anti-ferromagnetic coupling between the Cu center and the O2 moiety. rRaman data are available for both complexes, which show that the O–O stretching frequency of 1 is 1043 cm−1 and that of 2 is 948 cm−1. These data for 1 are inconsistent with its crystallographic bond distance of 1.22 Å, which should correspond to a stronger O–O stretching frequency [111]. It has been suggested that the short 1.22 Å distance in 1 is an underestimation due to libration motion of the CuO2 core. The structural and optical spectroscopic differences indicated that the electronic structure of 1 and 2 are distinct. We applied Cu K-edge XANES and Cu L-edge XAS combined with DFT calculations to understand the differences in optical spectroscopy to correlate the geometric structure differences to electronic structure [79,112].
Fig. 12.
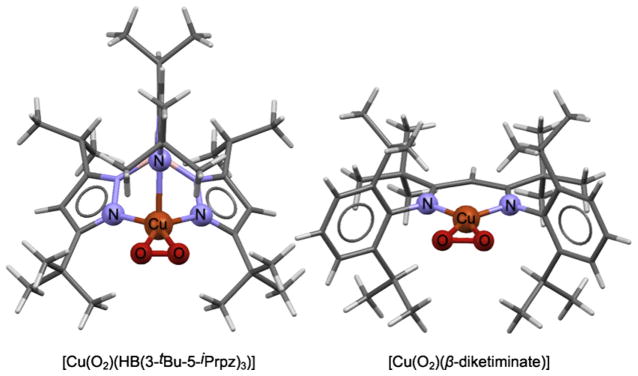
Structures of 1 and 2 (from X-ray crystallography). Cu and the first shell ligands are shown in ball and stick format.
The Cu K-rising-edge data are reproduced in Fig. 13. While 1 has an essentially smooth rising-edge, 2 has an intense transition at 8986.5 eV. This feature was assigned as the formally forbidden 2-electron metal 1s→4p transition with concomitant ligand-to-metal charge-transfer (shakedown) transition. Close examination of the rising-edge region in the second-derivative spectrum of 1 shows a feature at higher energy (8988.3 eV). In 1, the tris-pyrazolyl borate ligand has a weak axial Cu N interaction. This destabilizes the 4pz orbital, shifting the shakeup transition to higher energy, which appears only as a shoulder buried in the main rising-edge. In 2, the lack of any axial interaction stabilizes the 4pz orbital and shifts the shakeup transition to lower energy. In this case, the rising-edge spectral shape is used to predict differences in local geometry and to confirm the presence for a weak Cu N axial interaction in 1.
Fig. 13.

(Top panel) Cu K-edge XAS spectra of 1 (–○–) and 2 (–●–). Inset shows the expanded pre-edge region featuring the 1s→3d transition. (Bottom panel) Smoothed 2nd derivative spectrum showing the shakedown transition.
The pre-edge energy position of 1 occurs at 8978.6 eV, while that of 2 is ~2 eV to higher energy at 8980.7 eV. This large shift reflects the increase in ligand field associated with the bond shortening in 2. A comparison of pre-edge energy positions of known Cu(II) and Cu(III) complexes show that 1 and 2 are Cu(II)–O2− and Cu(III)–O22−complexes, respectively. Cu L-edge XAS data on 1 and 2 show that both are extremely covalent complexes with only 20% and 28% Cu character in the ground state wave function, respectively. The high covalency of 1 and 2 is consistent with the presence of the intense shakedown transitions in the Cu K-edge rising-edge region. Experimentally calibrated DFT investigation showed that the electronic structure difference in 1 and 2 arose due to the difference in the nitrogenous ligand systems. The CuN2O2 core in 2 is essentially planar. This, along with the strongly donating anionic nitrogens of the β-diketiminate ligand, leads to increased charge donation to the Cu center. This strong donation in turn stabilizes the higher oxidation state on Cu and thus, the Cu(III)–O22− ground state. In 1, the CuN2O2 core is not planar due to presence of the axial Cu–N interaction. The neutral ligating N atoms of the tris-pyrazolyl borate ligand have weaker donor ability relative to the β-diketiminate ligand in 2 (this was confirmed by DFT calculations). Together these factors lead to electron flow from the O2 moiety to the Cu center and a Cu(II)–O2− ground state is stabilized.
This study was among the first Metal K- and L-edge XAS investigation of a transition metal–O2 species. The XAS data could not only explain geometric and electronic structure differences between the two molecules but combined with DFT, could shed light on the electronic control of the nitrogenous ligand in tuning the final electronic structure.
3.3. Steric control of electronic structure in Ni-O2 adducts
In recent years, several mononuclear Ni(II)–O2−, Ni(II)–O22− and Ni(III)–O22- species have been synthesized and characterized using X-ray crystallography, spectroscopy (including EXAFS) and density functional theory calculations [113–116]. In order to understand the role of the supporting ligand in tuning the electronic structure of Ni–O2 systems, two spectroscopically characterized model complexes with n-TMC (tetraazacyclo-n-decane) ligand systems were chosen. The n-TMC is a flexible and versatile class of supporting ligand system that has been routinely used in biomimetic chemistry for the study of dioxygen activation by metal complexes [115]. We studied [Ni(14-TMC)O2]+ (3) (14-TMC is 1,4,8,11-tetramethyl-1,4,8,11-tetraazacyclotetradecane), which had been previously described as a Ni(II)–O2− [116] and [Ni(12-TMC)(O2)]+ (4) (12-TMC is 1,4,7,10-tetramethyl-1,4,7,10-tetraazacyclododecane) (see Fig. 14) using Ni K-edge XANES and EXAFS and coupled the spectroscopy with DFT calculations [113]. The Ni K-edge XANES spectrum of 3 and 4 are adapted from ref 98 in Fig. 15. The rising edge of 4 is 1.8 eV higher than 3. This large difference is in contrast to typical Ni K-edge data, but nonetheless clearly shows that 4 is Ni(III), while 3 is Ni(II) in nature. The rising-edge shows the presence of a low-lying edge transition in 3 and two higher energy (buried) transitions in 4, which can be attributed to shakeup and/or multiple scattering transitions.
Fig. 14.
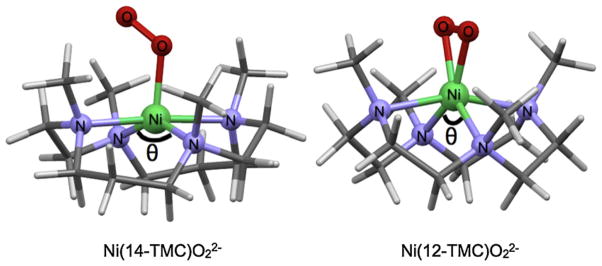
Structures of 3 (spectroscopy and DFT) and 4 (X-ray crystallography). Ni and the first shell ligands are shown in ball and stick format. The angle N–Ni–N angle θ, is significantly smaller in 4 (112°) compared to 3 (150°).
Fig. 15.

(A) Ni K-edge XAS spectra of 3 (–●–) and 4 (–○–). Inset shows the rising-edge second derivative spectra. (B) Ni K-pre-edge region of the starting materials featuring the 1s→3d transition 3PRE (–●–) and 4PRE (–○–). (C) Ni K-pre-edge region of 3 (–●–) and 4 (–○–).
Both Ni(II) (d8) and Ni(III) (d7) complexes can have multiplet features in the Ni K-pre-edge. The Ni(II) precursors of 3 and 4 are high-spin species and have very similar Ni K-pre-edge, with two transitions to states corresponding to the 3dx2–y2 and the 3dz2 orbitals (Fig. 15). The O2 adducts 3 and 4 are STOTAL = 1/2, (high-spin d8 Ni(II) and O2− antiferromagnetically coupled) and STOTAL = 1/2 (low-spin d7 Ni(III) and O22−), but have a single peak in the pre-edge region showing that the available 3dx2–y2 and the 3dz2 orbitals are close in energy and not resolvable. This also points to the limitation of metal K-pre-edge, which depending on the edge, has an energy resolution ≥1 eV (for 3d-transition metal complexes) and in many cases transitions to closely spaced 3d orbitals are not resolved. The Ni K-pre-edge data show a ~0.7 eV shift on going from 3 to 4 is observed in the Ni K-pre-edge, reflecting an increase in ligand field. The decreased intensity of the pre-edge feature in 4 indicates a more symmetric site. This was confirmed by EXAFS analysis, which showed that 4 is 6-coordinate, with two short Ni-O distances corresponding to a side-on bound O2 moiety, while 3 is 5-coordinate, with one short Ni-O distance corresponding to an end-on bound O2 moiety. Together these data showed that the electronic structures of 3 and 4 were Ni(II)–O2− and Ni(III)–O22−. This difference is interesting since 12-TMC and 14-TMC have similar ligating nitrogens, suggesting similar contribution to ligand field strength in 3 and 4. Experimentally calibrated DFT calculations showed that the smaller ring size in 12-TMC leads to formation of a constrained NiN4 core with one small N Ni N angle (see Fig. 14), sterically allowing the O2 to approach in a side-on fashion. This can also be directly observed from the Ni K-pre-edge data for the precursors 3PRE ([Ni(14-TMC)(CH3CN)]2+) and 4PRE (Ni(14-TMC)(CH3CN)]2+) which show higher intensity in 4PRE due to larger distortion from centrosymmetry.
This study underscores the importance of small changes in the supporting ligand system in determining the final electronics of M–O2 complexes and showed an example of ligand steric driven control of electronic structure in 3 and 4.
3.4. Electronic control of electronic structure in Co-O2 systems
Owing to the versatile nature of the n-TMC ligand system, a variety of (n-TMC)M–O2 systems have been synthesized in the recent years [117]. These include the [(n-TMC)Co–O2]3+ complexes: [(12-TMC)Co–O2]+ (5), [(13-TMC)Co–O2]+ (6) and [(14-TMC)Co–O2]+ (7). We investigated 5 and 6 using X-ray absorption, X-ray crystallography and optical spectroscopy, including rRaman and showed that both have low-spin side-on O2 bound Co(III)–O22− character [118]. The geometric and electronic structure of 5 was consistent with the electronic structure of 4; another M–O2 (M = Ni) complex with 12-TMC supporting ligand (vide supra), for which we were able to show that the constrained nature of the 12-TMC ligand allows for facile side-on bonding of the O2 molecule with the metal center (see Section 3.3). We then investigated 5–7 using Co K-edge XANES and EXAFS and DFT calculations to compare the effect of the progressively flexible 12-, 13- and 14-TMC supporting ligand system on the electronic structure and to contrast the results with those obtained for the Ni–n-TMC systems [113]. Interestingly, the Co K-rising-edge energies of 5–7 are all very similar and occur at ~7721.0 eV indicating their Co(III) nature (see Fig. 16) [100]. The Co K-pre-edges of 5–7 also occur at very similar energies indicating similar ligand field strengths. These data are in contrast to their Ni-counterpart, in which the 14-TMC formed a Ni(II)–O2− species due to steric effects of the syn-methyl groups. The three complexes are however not structurally similar. In the absence of a crystal structure for 7, Co K-edge EXAFS studies were performed on 5–7 (Fig. 17), which pointed to a structural difference between these molecules. The EXAFS data revealed that both 5 and 6 (for which X-ray crystal structures exist) have six-coordinate active sites with side-on bound O2 (two short Co–O at ~1.85 Å and four longer Co–N bonds at ~2.0 Å). In 7, the EXAFS amplitude is significantly diminished relative to 5 and 6 and spectral simulations revealed that there are only four first shell interactions: two short Co–O at ~1.88 Å and two longer Co–N at ~2.1 Å.
Fig. 16.

Co K-edge XAS spectra of 5 (—), 6 (- -○- -) and 7 (–●–). Inset shows the expanded pre-edge region featuring the 1s→3d transition.
Fig. 17.

Co K-edge EXAFS spectra of 5 (- - - -), 6 (––) and 7 (●).
The near-edge and EXAFS results were combined with theoretical calculations to test several different electronic structures for 7. Surprisingly, a side-on peroxide bound Co(III), S = 1 intermediate spin ground state for 7 was most consistent with the experimental data (typically six-coordinate Co(III) complexes have S = 0 or 2 ground states). Theoretical calculations also showed that there are three different first shell distances in the structure of 7: two short Co–O bonds at 1.87 Å, 2 Co–N bonds at 2.15 Å and 2 weaker Co–N bonds at 2.31 Å. The longer and weaker Co–N bonds stabilize the intermediate spin state. The corresponding two nitrogens have very weak scattering and are hence not observed in the EXAFS data.
The combined experimental and theoretical data show that the electronic structure of 7 (side-on bound Co(III)-peroxide, S = 1 species) is different than that of 4 (end-on bound Ni(II)-superoxide S = 1/2 species). In 4, the methyl groups on the 14-TMC ligand posed a steric barrier toward side-on overlap of the O2n− moiety, which led to the formation a Ni(II)–O2− species. To understand this difference, we addressed each energy term associated with conversion of an end-on bound M(II)–O2− species to a side-on bound M(III)–O22− species using density functional theory, namely (a) the oxidation of M(II), (b) the reduction of O2−, (c) the potential change in exchange stabilization between the M(II) and O2− spin systems, (d) the differences in bonding, and (e) destabilization due to steric factors. Calculations revealed that the thermodynamic driving force for the oxidation of Co(II) to Co(III) is greater than the destabilizing steric factor of the methyl groups on the 14-TMC ligand. Thus, a Co(III)–O22− electronic structure is formed and to relieve the steric strain, two trans Co N bonds elongate to 2.31 Å (see Fig. 18).
Fig. 18.
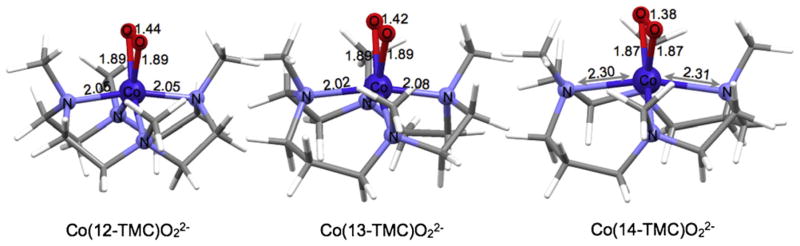
DFT optimized structures of 5–7.
These results indicated that even with the same ligand system, the final electronic structure of 3d-transition metal–O2 complexes could be different due to a fine interplay of steric and electronic factors.
4. Summary
In this paper, a review of the application of X-ray absorption spectroscopy to bioinorganic and biomimetic transition metal centers is presented. The emphasis has been on the geometric and electronic factors that determine the final shape of the metal K pre-edge and rising-edge region. The purpose of this review has also been to demonstrate that transition metal K-edge X-ray absorption is a powerful spectroscopic technique and in combination with density functional theory tools can be used to extract both geometric and electronic structure information about the active site of interest. To demonstrate this point, application of metal K-edge XANES to M–O2 (M = Cu, Ni and Co and Fe) systems is described as illustrations of recent advancement in the field. It is hoped that this review provides the bioinorganic chemist a detailed understanding of metal K-edge XANES and serves as a good starting point toward inclusion of metal K-rising-edge and pre-edge X-ray absorption spectroscopy to their spectroscopic toolkit.
Acknowledgments
R.S. would like to thank the authors of all publications from which material has been presented in this review. R.S. would also like to thank Prof. Edward I. Solomon, to whom this review is dedicated, for his mentorship when she was a graduate student and for continued collaborations and discussions. SSRL operations are funded by the Department of Energy, Office of Basic Energy Sciences. The SSRL Structural Molecular Biology program is supported by the National Institutes of Health, National Center for Research Resources, Biomedical Technology Program, and the Department of Energy, Office of Biological and Environmental Research. This publication was made possible by Award P41 RR001209 from the National Center for Research Resources (NCRR), a component of the National Institutes of Health (NIH).
Abbreviations
- XAS
X-ray absorption spectroscopy
- EXAFS
extended X-ray absorption fine structure
- DFT
density functional theory
- NMR
nuclear magnetic resonance
- XANES
X-ray absorption near-edge spectroscopy
- Zeff
effective nuclear charge
- LMCT
ligand to metal charge transfer
- MLCT
metal to ligand charge transfer
- EPR
electron paramagnetic resonance
- TD-DFT
time-dependent density functional theory
- rRaman
resonance Raman
- R-TPEN
N-alkyl-N,N′,N′-tris(pyridin-2-ylmethyl)ethane-1,2-diamine
- 3-tBu-5-iPrpz
hydrotris(3-tert-butyl-5-isopropyl-1-pyrazolyl)borate
- L8Py2
1,5-bis(pyridin-2-ylmethyl)-1,5-diazacyclooctane
- 6-Me2 BPMCN
N,N′-bis((2-methylpyridin-6-yl)methyl)-N,N′-dimethyl-trans-1,2-diaminocyclohexane
- N4 Py
N,N-bis(2-methylpyridin-6-yl)-N-bis(2-pyridyl)methylamine
- H-PaPy3
N-[bis(2-pyridylmethyl)aminoethyl]pyridine-2-carboxamide
- TPA
tris(2-pyridylmethyl)amine
- 14-TMC
1,4,8,11-tetramethyl-1,4,8,11-tetraazacyclotetradecane
- 12-TMC
1,4,7,10-tetramethyl-1,4,7,10-tetraazacyclododecane
- 13-TMC
1,4,7,10-tetramethyl-1,4,7,10-tetraazacyclotridecane
- SMe2N4 (tren)
N,N-bis-(2-aminoethyl)-N′-(1,2-dimethyl-2-mercaptopropylene)ethane-1,2-di-amine
- β-diketiminate
N,N′-bis(2,6-diisopropylphenyl)-2,2,6,6-tetra-methyl-3,5-pentanediiminato
References
- 1.Teo BK. EXAFS: Basic Principles and Data Analysis. Springer-Verlag; 1986. [Google Scholar]
- 2.Stern EA. In: EXAFS, SEXAFS and XANES. Koningsberger DC, Prins R, editors. John Wiley & Sons; New York: 1988. [Google Scholar]
- 3.Cramer SP, Hodgson KO. Prog Inorg Chem. 1979;25:1. [Google Scholar]
- 4.Crozier ED. Nucl Instrum Methods: Phys Res B. 1997;133:134. [Google Scholar]
- 5.Penner-Hahn JE. Coord Chem Rev. 2005;249:161. [Google Scholar]
- 6.Fonda L. J Phys: Condens Matter. 1992;4:8269. [Google Scholar]
- 7.Iwasawa Y. X-Ray Absorption Fine Structure for Catalysis and Surfaces. World Scientific; 1996. [Google Scholar]
- 8.Zhang HH, Hedman B, Hodgson KO. Inorganic Electronic Structure and Spectroscopy. In: Solomon EI, Lever ABP, editors. Methodology. Vol. 1. John Wiley & Sons; New York: 1999. p. 514. [Google Scholar]
- 9.de Groot F. Chem Rev. 2001;101:1779. doi: 10.1021/cr9900681. [DOI] [PubMed] [Google Scholar]
- 10.Solomon EI, Hedman B, Hodgson KO, Dey A, Szilagyi RK. Coord Chem Rev. 2005;249:97. [Google Scholar]
- 11.Cotte M, Susini J, Dik J, Janssens K. Acc Chem Res. 2010;43:705. doi: 10.1021/ar900199m. [DOI] [PubMed] [Google Scholar]
- 12.Kawai J. In: Encyclopedia of Analytical Chemistry. Meyers RA, editor. John Wiley & Sons Ltd; Chichester: 2000. p. 11328. [Google Scholar]
- 13.de Groot F, Vankó G, Glatzel P. J Phys: Condens Matter. 2009;21:104207. doi: 10.1088/0953-8984/21/10/104207. [DOI] [PubMed] [Google Scholar]
- 14.Chandrasekaran P, Stieber SC, Collins TJ, Que L, Jr, Neese F, DeBeer S. Dalton Trans. 2011;40:11070. doi: 10.1039/c1dt11331c. [DOI] [PMC free article] [PubMed] [Google Scholar]
- 15.Sarangi R, Dey M, Ragsdale SW. Biochemistry. 2009;48:3146. doi: 10.1021/bi900087w. [DOI] [PMC free article] [PubMed] [Google Scholar]
- 16.Klinman JP. Chem Rev. 1996;96:2541. doi: 10.1021/cr950047g. [DOI] [PubMed] [Google Scholar]
- 17.Solomon EI, Sarangi R, Woertink JS, Augustine AJ, Yoon J, Ghosh S. Acc Chem Res. 2007;40:581. doi: 10.1021/ar600060t. [DOI] [PMC free article] [PubMed] [Google Scholar]
- 18.Hersleth HP, Ryde U, Rydberg P, Gorbitz CH, Andersson KK. J Inorg Biochem. 2006;100:460. doi: 10.1016/j.jinorgbio.2006.01.018. [DOI] [PubMed] [Google Scholar]
- 19.Solomon EI, Decker A, Lehnert N. Proc Natl Acad Sci U S A. 2003;100:3589. doi: 10.1073/pnas.0336792100. [DOI] [PMC free article] [PubMed] [Google Scholar]
- 20.Solomon EI, Brunold TC, Davis MI, Kemsley JN, Lee SK, Lehnert N, Neese F, Skulan AJ, Yang YS, Zhou J. Chem Rev. 2000;100:235. doi: 10.1021/cr9900275. [DOI] [PubMed] [Google Scholar]
- 21.Feig AL, Lippard SJ. Chem Rev. 1994;94:759. [Google Scholar]
- 22.Pecoraro VL, Baldwin MJ, Gelasco A. Chem Rev. 1994;94:807. [Google Scholar]
- 23.Miller AF. Curr Opin Chem Biol. 2004;8:162. doi: 10.1016/j.cbpa.2004.02.011. [DOI] [PubMed] [Google Scholar]
- 24.Mirica LM, Ottenwaelder X, Stack TDP. Chem Rev. 2004;104:1013. doi: 10.1021/cr020632z. [DOI] [PubMed] [Google Scholar]
- 25.Lewis EA, Tolman WB. Chem Rev. 2004;104:1047. doi: 10.1021/cr020633r. [DOI] [PubMed] [Google Scholar]
- 26.Costas M, Mehn MP, Jensen MP, Que L., Jr Chem Rev. 2004;104:939. doi: 10.1021/cr020628n. [DOI] [PubMed] [Google Scholar]
- 27.Kim E, Chufán EE, Kamaraj K, Karlin KD. Chem Rev. 2004;104:1077. doi: 10.1021/cr0206162. [DOI] [PubMed] [Google Scholar]
- 28.Collman JP, Boulatov R, Sunderland CJ, Fu L. Chem Rev. 2004;104:561. doi: 10.1021/cr0206059. [DOI] [PubMed] [Google Scholar]
- 29.Pushie MJ, George GN. Coord Chem Rev. 2011;255:1055. [Google Scholar]
- 30.Ankudinov AL, Rehr JJ. J Synchrotron Radiat. 2003;10:366. doi: 10.1107/s0909049503009130. [DOI] [PubMed] [Google Scholar]
- 31.Zabinsky SI, Rehr JJ, Ankudinov A, Albers RC, Eller MJ. Phys Rev B: Condens Matter. 1995;52:2995. doi: 10.1103/physrevb.52.2995. [DOI] [PubMed] [Google Scholar]
- 32.Rehr JJ, Albers RC. Rev Mod Phys. 2000;72:621. [Google Scholar]
- 33.Rehr JJ, Ankudinov AL. J Synchrotron Radiat. 2003;10:43. doi: 10.1107/s0909049502017223. [DOI] [PubMed] [Google Scholar]
- 34.Rehr JJ, Ankudinov AL. J Synchrotron Radiat. 2001;8:61. doi: 10.1107/s0909049500016423. [DOI] [PubMed] [Google Scholar]
- 35.Rehr JJ, Ankudinov A. Coord Chem Rev. 2005;249:131. [Google Scholar]
- 36.Donoghue PJ, Tehranchi J, Cramer CJ, Sarangi R, Solomon EI, Tolman WB. J Am Chem Soc. 2011;133:17602. doi: 10.1021/ja207882h. [DOI] [PMC free article] [PubMed] [Google Scholar]
- 37.Penner-Hahn JE, Fronko RM, Pecoraro VL, Yocum CF, Betts SD, Bowlby NR. J Am Chem Soc. 1990;112:2549. [Google Scholar]
- 38.Wirt MD, Sagi I, Chen E, Frisbie SM, Roxane L, Chance MR. J Am Chem Soc. 1991;113:5299. [Google Scholar]
- 39.Colpas GJ, Maroney MJ, Bagyinka C, Kumar M, Willis WS, Suib SL, Baidya N, Mascharak PK. Inorg Chem. 1991;30:920. [Google Scholar]
- 40.Yano J, Kern J, Irrgang KD, Latimer MJ, Bergmann U, Glatzel P, Pushkar Y, Biesiadka J, Loll B, Sauer K, Messinger J, Zouni A, Yachandra VK. Proc Natl Acad Sci U S A. 2005;102:12047. doi: 10.1073/pnas.0505207102. [DOI] [PMC free article] [PubMed] [Google Scholar]
- 41.Sarangi R, Hocking RK, Neidig ML, Benfatto M, Holman TR, Solomon EI, Hodgson KO, Hedman B. Inorg Chem. 2008;47:11543. doi: 10.1021/ic800580f. [DOI] [PMC free article] [PubMed] [Google Scholar]
- 42.Kau LS, Spira-Solomon DJ, Penner-Hahn JE, Hodgson KO, Solomon EI. J Am Chem Soc. 1987;109:6433. [Google Scholar]
- 43.Natoli CR. Springer Proc Phys. 1984;2:38. [Google Scholar]
- 44.Natoli CR. EXAFS and Near Edge Structure III. In: Hodgson KO, Hedman B, Penner-Hahn J, editors. EXAFS and Near Edge Structure III, 2, Springer Proceedings in Physics. 1984. p. 38. [Google Scholar]
- 45.Glatzel P, Smolentsev G, Bunker G. J Phys Conf Series. 2009;190:012046. [Google Scholar]
- 46.Kasrai M, Fleet ME, Bancroft GM, Tan KH, Chen JM. Phys Rev B: Condens Matter. 1991;43:1763. doi: 10.1103/physrevb.43.1763. [DOI] [PubMed] [Google Scholar]
- 47.Khalil M, Marcus MA, Smeigh AL, McCusker JK, Chong HH, Schoenlein RW. J Phys Chem A. 2006;110:38. doi: 10.1021/jp055002q. [DOI] [PubMed] [Google Scholar]
- 48.Mahto P, Chetal AR. Physica B. 1989;158:415. [Google Scholar]
- 49.Kuppuraj G, Dudev M, Lim C. J Phys Chem B. 2009;113:2952. doi: 10.1021/jp807972e. [DOI] [PubMed] [Google Scholar]
- 50.Rudd DJ, Goldsmith CR, Cole AP, Stack TD, Hodgson KO, Hedman B. Inorg Chem. 2005;44:1221. doi: 10.1021/ic048765l. [DOI] [PubMed] [Google Scholar]
- 51.Yoon J, Fujii S, Solomon EI. Proc Natl Acad Sci U S A. 2009;106:6585. doi: 10.1073/pnas.0902127106. [DOI] [PMC free article] [PubMed] [Google Scholar]
- 52.Augustine AJ, Kragh ME, Sarangi R, Fujii S, Liboiron BD, Stoj CS, Kosman DJ, Hodgson KO, Hedman B, Solomon EI. Biochemistry. 2008;47:2036. doi: 10.1021/bi7020052. [DOI] [PubMed] [Google Scholar]
- 53.Augustine AJ, Kjaergaard C, Qayyum M, Ziegler L, Kosman DJ, Hodgson KO, Hedman B, Solomon EI. J Am Chem Soc. 2010;132:6057. doi: 10.1021/ja909143d. [DOI] [PMC free article] [PubMed] [Google Scholar]
- 54.Kau LS, Hodgson KO, Solomon EI. J Am Chem Soc. 1989;111:7103. [Google Scholar]
- 55.Tan G, Kau LS, Hodgson KO, Solomon EI. Physica B. 1989;158:110. [Google Scholar]
- 56.Dooley DM, Scott RA, Knowles PA, Colangelo CM, Mcguirl MA, Brown DE. J Am Chem Soc. 1998;120:2599. [Google Scholar]
- 57.Knowles PA, Brown RDI, Koenig SH, Wang S, Scott RA, Mcguirl MA, Brown DE, Dooley DM. Inorg Chem. 1995;34:3895. [Google Scholar]
- 58.Scott RA, Schwartz JR, Cramer SP. Biochemistry. 1986;25:5546. doi: 10.1021/bi00367a030. [DOI] [PubMed] [Google Scholar]
- 59.Boswell JS, Reedy BJ, Kulathila R, Merkler D, Blackburn NJ. Biochemistry. 1996;35:12241. doi: 10.1021/bi960742y. [DOI] [PubMed] [Google Scholar]
- 60.Jaron S, Mains RE, Eipper BA, Blackburn NJ. Biochemistry. 2002;41:13274. doi: 10.1021/bi020404z. [DOI] [PubMed] [Google Scholar]
- 61.Hahn JE, Co MS, Spira DJ, Hodgson KO, Solomon EI. Biochem Biophys Res Commun. 1983;112:737. doi: 10.1016/0006-291x(83)91524-3. [DOI] [PubMed] [Google Scholar]
- 62.Lee SK, deBeer George S, Antholine WE, Hedman B, Hodgson KO, Solomon EI. J Am Chem Soc. 2002;124:6180. doi: 10.1021/ja0114052. [DOI] [PubMed] [Google Scholar]
- 63.Yoon J, Liboiron BD, Sarangi R, Hodgson KO, Hedman B, Solomon EI. Proc Natl Acad Sci U S A. 2007;104:13609. doi: 10.1073/pnas.0705137104. [DOI] [PMC free article] [PubMed] [Google Scholar]
- 64.Cartier C, Thuery P, Verdaguer M, Zarembowitch J, Michalowicz A. J Phys. 1986;47:563. [Google Scholar]
- 65.Briois V, Cartier dir Moulin C, Sainctavit P, Brouder C, Flank AM. J Am Chem Soc. 1995;117:1019. [Google Scholar]
- 66.Congiu Castellano A, Castagnola M, Burattini E, Dell’Ariccia M, Della Longa S, Giovannelli A, Durham PJ, Bianconi A. Biochim Biophys Acta. 1989;996:240. doi: 10.1016/0167-4838(89)90253-7. [DOI] [PubMed] [Google Scholar]
- 67.Amiconi G, Santucci R, Coletta M, Castellano AC, Giovannelli A, Dell’Ariccia M, Della Longa S, Barteri M, Burattini E, Bianconi A. Biochemistry. 1989;28:8547. doi: 10.1021/bi00447a042. [DOI] [PubMed] [Google Scholar]
- 68.Sarangi R, Benfatto M, Hayakawa K, Bubacco L, Solomon EI, Hodgson KO, Hedman B. Inorg Chem. 2005;44:9652. doi: 10.1021/ic050703n. [DOI] [PubMed] [Google Scholar]
- 69.Bortolus M, Bisaglia M, Zoleo A, Fittipaldi M, Benfatto M, Bubacco L, Maniero AL. J Am Chem Soc. 2010;132:18057. doi: 10.1021/ja103338n. [DOI] [PubMed] [Google Scholar]
- 70.Della Longa S, Pin S, Cortes R, Soldatov AV, Alpert B. Biophys J. 1998;75:3154. doi: 10.1016/S0006-3495(98)77757-4. [DOI] [PMC free article] [PubMed] [Google Scholar]
- 71.Frank P, Benfatto M, Hedman B, Hodgson KO. Inorg Chem. 2008;47:4126. doi: 10.1021/ic7021243. [DOI] [PubMed] [Google Scholar]
- 72.Frank P, Benfatto M, Szilagyi RK, D’Angelo P, Della Longa S, Hodgson KO. Inorg Chem. 2005;44:1922. doi: 10.1021/ic0400639. [DOI] [PubMed] [Google Scholar]
- 73.Smolentsev G, Soldatov AV, Chen LX. J Phys Chem A. 2008;112:5363. doi: 10.1021/jp801410a. [DOI] [PubMed] [Google Scholar]
- 74.Etschmann RE, Black JR, Grundler PV, Borg S, Brewe D, McPhail DC, Spiccia L, Brugger J. RSC Adv. 2011;1:1554. [Google Scholar]
- 75.Smith TA, Penner-Hahn JE, Berding MA, Doniach S, Hodgson KO. J Am Chem Soc. 1985;107:5945. [Google Scholar]
- 76.DuBois JL, Mukherjee P, Stack TDP, Hedman B, Solomon EI, Hodgson KO. J Am Chem Soc. 2000;122:5775. [Google Scholar]
- 77.Kosugi N, Yokoyama T, Asakura K, Kuroda H. Chem Phys. 1984;91:249. [Google Scholar]
- 78.Bair RA, Goddard WA., III Phys Rev B: Condens Matter. 1980;22:2767. [Google Scholar]
- 79.Sarangi R, Aboelella N, Fujisawa K, Tolman WB, Hedman B, Hodgson KO, Solomon EI. J Am Chem Soc. 2006;128:8286. doi: 10.1021/ja0615223. [DOI] [PMC free article] [PubMed] [Google Scholar]
- 80.DeBeer George S, Basumallick L, Szilagyi RK, Randall DW, Hill MG, Nersissian AM, Valentine JS, Hedman B, Hodgson KO, Solomon EI. J Am Chem Soc. 2003;125:11314. doi: 10.1021/ja035802j. [DOI] [PubMed] [Google Scholar]
- 81.Shulman RG, Yafet Y, Eisenberger P, Blumberg WE. Proc Natl Acad Sci U S A. 1976;73:1384. doi: 10.1073/pnas.73.5.1384. [DOI] [PMC free article] [PubMed] [Google Scholar]
- 82.Hahn JE, Scott RA, Hodgson KO, Doniach S, Desjardins SR, Solomon EI. Chem Phys Lett. 1982;88:595. [Google Scholar]
- 83.Roe AL, Schneider DJ, Mayer RJ, Pyrz JW, Widom J, Que L. J Am Chem Soc. 1984;106:1676. [Google Scholar]
- 84.Mitsuru S, Komorita S, Yamatera H. Inorg Chem. 1992;31:459. [Google Scholar]
- 85.Randall CR, Shu LJ, Chiou YM, Hagen KS, Ito M, Kitajima N, Lachicotte RJ, Zang Y, Que L. Inorg Chem. 1995;34:1036. [Google Scholar]
- 86.Westre TE, Kennepohl P, DeWitt JG, Hedman B, Hodgson KO, Solomon EI. J Am Chem Soc. 1997;119:6297. [Google Scholar]
- 87.DeBeer George S, Petrenko T, Neese F. J Phys Chem. 2008;112:12936. doi: 10.1021/jp803174m. [DOI] [PubMed] [Google Scholar]
- 88.Mirica LM, Vance M, Rudd DJ, Hedman B, Hodgson KO, Solomon EI, Stack TD. Science. 2005;308:1890. doi: 10.1126/science.1112081. [DOI] [PubMed] [Google Scholar]
- 89.Basumallick L, Sarangi R, Debeer George S, Elmore B, Hooper AB, Hedman B, Hodgson KO, Solomon EI. J Am Chem Soc. 2005;127:3531. doi: 10.1021/ja044412+. [DOI] [PubMed] [Google Scholar]
- 90.DeBeer George S, Metz M, Szilagyi RK, Wang HX, Cramer SP, Lu Y, Tolman WB, Hedman B, Hodgson KO, Solomon EI. J Am Chem Soc. 2001;123:5757. doi: 10.1021/ja004109i. [DOI] [PubMed] [Google Scholar]
- 91.Randall DW, DeBeer George S, Holland PL, Hedman B, Hodgson KO, Tolman WB, Solomon EI. J Am Chem Soc. 2000;122:11632. [Google Scholar]
- 92.Aliaga-Alcalde N, deBeer George S, Mienert B, Bill E, Wieghardt K, Neese F. Angew Chem Int Ed. 2005;44:2908. doi: 10.1002/anie.200462368. [DOI] [PubMed] [Google Scholar]
- 93.Berry JF, Bill E, Bothe E, deBeer George S, Mienert B, Neese F, Wieghardt K. Science. 2006;312:1937. doi: 10.1126/science.1128506. [DOI] [PubMed] [Google Scholar]
- 94.Stone KL, Behan RK, Green MT. Proc Natl Acad Sci U S A. 2005;102:16563. doi: 10.1073/pnas.0507069102. [DOI] [PMC free article] [PubMed] [Google Scholar]
- 95.Yano J, Robblee J, Pushkar Y, Marcus MA, Bendix J, Workman JM, Collins TJ, Solomon EI, deBeer George S, Yachandra VK. J Am Chem Soc. 2007;129:12989. doi: 10.1021/ja071286b. [DOI] [PMC free article] [PubMed] [Google Scholar]
- 96.Fujimori DG, Barr EW, Matthews ML, Koch GM, Yonce JR, Walsh CT, Bollinger JM, Jr, Krebs C, Riggs-Gelasco PJ. J Am Chem Soc. 2007;129:13408. doi: 10.1021/ja076454e. [DOI] [PubMed] [Google Scholar]
- 97.Kemsley JN, Wasinger EC, Datta S, Mitic N, Acharya T, Hedman B, Caradonna JP, Hodgson KO, Solomon EI. J Am Chem Soc. 2003;125:5677. doi: 10.1021/ja029106f. [DOI] [PubMed] [Google Scholar]
- 98.Sarangi R, York JT, Helton ME, Fujisawa K, Karlin KD, Tolman WB, Hodgson KO, Hedman B, Solomon EI. J Am Chem Soc. 2008;130:676. doi: 10.1021/ja0762745. [DOI] [PMC free article] [PubMed] [Google Scholar]
- 99.Basumallick L, DeBeer George S, Randall DW, Hedman B, Hodgson KO, Fujisawa K, Solomon EI. Inorg Chim Acta. 2002;337:357. [Google Scholar]
- 100.Sarangi R, Cho J, Nam W, Solomon EI. Inorg Chem. 2010;50:614. doi: 10.1021/ic101730r. [DOI] [PMC free article] [PubMed] [Google Scholar]
- 101.Bukowski MR, Zhu S, Koehntop KD, Brennessel WW, Que L., Jr J Biol Inorg Chem. 2004;9:39. doi: 10.1007/s00775-003-0494-z. [DOI] [PubMed] [Google Scholar]
- 102.Koehntop KD, Rohde JU, Costas M, Que L., Jr Dalton Trans. 2004:3191. doi: 10.1039/B409727K. [DOI] [PubMed] [Google Scholar]
- 103.Roelfes G, Vrajmasu V, Chen K, Ho RY, Rohde JU, Zondervan C, La Crois RM, Schudde EP, Lutz M, Spek AL, Hage R, Feringa BL, Munck E, Que L., Jr Inorg Chem. 2003;42:2639. doi: 10.1021/ic034065p. [DOI] [PubMed] [Google Scholar]
- 104.Rohde JU, Torelli S, Shan X, Lim MH, Klinker EJ, Kaizer J, Chen K, Nam W, Que L., Jr J Am Chem Soc. 2004;126:16750. doi: 10.1021/ja047667w. [DOI] [PubMed] [Google Scholar]
- 105.Shan X, Rohde JU, Koehntop KD, Zhou Y, Bukowski MR, Costas M, Fujisawa K, Que L., Jr Inorg Chem. 2007;46:8410. doi: 10.1021/ic700649w. [DOI] [PubMed] [Google Scholar]
- 106.Cho J, Jeon S, Wilson SA, Liu LV, Kang EA, Braymer JJ, Lim MH, Hedman B, Hodgson KO, Valentine JS, Solomon EI, Nam W. Nature. 2011;478:502. doi: 10.1038/nature10535. [DOI] [PMC free article] [PubMed] [Google Scholar]
- 107.Shearer J, Scarrow RC, Kovacs JA. J Am Chem Soc. 2002;124:11709. doi: 10.1021/ja012722b. [DOI] [PubMed] [Google Scholar]
- 108.Li F, Meier KK, Cranswick MA, Chakrabarti M, Van Heuvelen KM, Munck E, Que L. J Am Chem Soc. 2011;133:7256. doi: 10.1021/ja111742z. [DOI] [PMC free article] [PubMed] [Google Scholar]
- 109.Fujisawa K, Tanaka M, Moro-oko Y, Kitajima N. J Am Chem Soc. 1994;116:12079. [Google Scholar]
- 110.Spencer DJE, Aboelella NW, Reynolds AM, Holland PL, Tolman WB. J Am Chem Soc. 2002;124:2108. doi: 10.1021/ja017820b. [DOI] [PubMed] [Google Scholar]
- 111.Cramer CJ, Tolman WB, Theopold KH, Rheingold AL. Proc Natl Acad Sci U S A. 2003;100:3635. doi: 10.1073/pnas.0535926100. [DOI] [PMC free article] [PubMed] [Google Scholar]
- 112.Aboelella NW, Kryatov SV, Gherman BF, Brennessel WW, Young VG, Jr, Sarangi R, Rybak-Akimova EV, Hodgson KO, Hedman B, Solomon EI, Cramer CJ, Tolman WB. J Am Chem Soc. 2004;126:16896. doi: 10.1021/ja045678j. [DOI] [PubMed] [Google Scholar]
- 113.Cho J, Sarangi R, Annaraj J, Sung Yeon K, Kubo M, Ogura T, Solomon EI, Nam W. Nat Chem. 2009;1:568. doi: 10.1038/nchem.366. [DOI] [PMC free article] [PubMed] [Google Scholar]
- 114.Yao S, Bill E, Milsmann C, Wieghardt K, Driess M. Angew Chem Int Ed. 2008;47:7110. doi: 10.1002/anie.200802234. [DOI] [PubMed] [Google Scholar]
- 115.Fujita K, Schenker R, Gu W, Brunold TC, Cramer SP, Riordan CG. Inorg Chem. 2004;43:3324. doi: 10.1021/ic049876n. [DOI] [PubMed] [Google Scholar]
- 116.Kieber-Emmons MT, Annaraj J, Seo MS, Van Heuvelen KM, Tosha T, Kitagawa T, Brunold TC, Nam W, Riordan CG. J Am Chem Soc. 2006;128:14230. doi: 10.1021/ja0644879. [DOI] [PubMed] [Google Scholar]
- 117.Cho J, Sarangi R, Nam W. Acc Chem Res. doi: 10.1021/ar3000019. http://dx.doi.org/10.1021/ar3000019, in press. [DOI] [PMC free article] [PubMed]
- 118.Cho J, Sarangi R, Kang HY, Lee JY, Kubo M, Ogura T, Solomon EI, Nam W. J Am Chem Soc. 2010;132:16977. doi: 10.1021/ja107177m. [DOI] [PMC free article] [PubMed] [Google Scholar]