

Abstract
Background
The interplay between obesity, physical activity, weight gain, and genetic variants in the mTOR pathway has not been studied in renal cell carcinoma (RCC). We examined the associations between obesity, weight gain, physical activity, and RCC risk. We also analyzed whether genetic variants in the mTOR pathway could modify the association.
Methods
Incident RCC case subjects and healthy control subjects were recruited from the University of Texas MD Anderson Cancer Center in Houston, Texas. Case subjects and control subjects were frequency matched. Epidemiologic data were collected by in-person interview. One hundred ninety single nucleotide polymorphisms (SNPs) from 22 genes in the mTOR pathway were extracted from previous genome-wide association studies. Logistic regression and regression spline were performed to obtain odds ratios (ORs). All statistical tests were two-sided.
Results
A total of 577 non-Hispanic white case subjects and 593 healthy control subjects were included. Obesity at age 20 years (OR = 1.92, 95% confidence interval [CI] = 1.05 to 3.50; P = .03) and age 40 years (OR = 2.03, 95% CI = 1.38 to 2.98; P < .001) and moderate (OR = 1.46, 95% CI = 1.02 to 2.09; P = .04) and massive weight gain (OR = 1.62, 95% CI = 1.10 to 2.39; P = .01) from age 20 to 40 years were each statistically significantly associated with increased RCC risk. Low physical activity was associated with a 4.08-fold increased risk. Among 190 SNPs in the mTOR pathway, six SNPs located in the AKT3 gene were statistically significantly associated with increased risk, and those with three or more unfavorable genotypes had a 1.72-fold increased risk of RCC.
Conclusion
Obesity, weight gain, physical activity, and genetic variants in the mTOR pathway may individually and jointly influence susceptibility to RCC.
Kidney cancer accounted for an estimated 4% of new cancer cases in the United States in 2012, with approximately 40250 cases in men and 24520 cases in women (1). An estimated 8650 men and 4920 women will die from kidney cancer by the end of 2012 (1). Approximately 85% of kidney cancers are renal cell carcinomas (RCCs) (2). Although major risk factors for RCC, such as cigarette smoking, obesity, and hypertension, have been identified (3–6), the etiology of RCC is not well understood (7).
The associations between RCC risk and obesity, physical activity, and weight gain have been inconsistent (8–21). Weight gain in early and mid-adulthood has been shown to be a strong risk factor (8); however, another case–control study did not observe such an association (10). Physical activity and RCC risk are more controversial. Several articles reported physical activity as a potential protective factor (9,13,20). Other studies, including cohort (18,19,21) and case–control (14) studies, reported either an insignificant protective association (18,19) or no association (14,21).
There is compelling evidence for genetic susceptibility to RCC (22–28). For example, RCC risk may be two to three times higher in individuals who have first-degree relatives who have had kidney cancer (22–24). Moreover, rare inherited kidney cancer syndromes (25–29) have been described in the literature. In recent years, polymorphisms of genes in the pathways of carcinogen metabolism, cell cycle control, apoptosis, DNA repair, and obesity have been investigated to assess their associations with RCC risk (30,31). Among them, the phosphatidylinositol 3-kinase/Akt/mammalian target of rapamycin (PI3K-AKT-mTOR), or mTOR, pathway is important because of its role in cell metabolism, growth, and proliferation (32). The mTOR complex is composed of mTORC1 and mTORC2. The activity of mTORC1 can be regulated by nutrients, energy, growth factors, and other upstream factors, whereas only growth factors can directly regulate the activity of mTORC2 (32,33). The activation or suppression of mTORC1 and/or mTORC2 would affect mRNA translation, cell proliferation and survival, lipid biogenesis, autophagy, and angiogenesis (33), which are involved in carcinogenesis (34–39). Mutations in several genes that locate in the mTOR pathway are found in RCC or other types of kidney cancer (40). Animal studies also support the hypothesis that both energy intake and physical activity could reduce cancer via the mTOR signaling pathway (41). Hence, genetic variants in the mTOR pathway and their interaction with energy balance–related risk factors may affect cell proliferation and/or cell death and subsequently increase cancer risk.
In this study, we examined the associations between obesity, weight gain, physical activity, and RCC risk. We also analyzed whether genetic polymorphisms in the mTOR pathway could modify the association.
Methods
Study Population
This is an ongoing case–control study of RCC (24) that has been recruiting newly diagnosed incident RCC patients from the University of Texas MD Anderson Cancer Center in Houston, Texas, since 2002. All case subjects were newly diagnosed and histologically confirmed and are residents of Texas. Healthy control subjects without a history of cancer, except nonmelanoma skin cancer, are identified and recruited using random digit dialing (42). The control subjects were matched to the patients by frequency according to age (±5 years), sex, ethnicity, and county of residence (have lived at least 1 year). The response rates were 87% and 88% for case subjects and control subjects, respectively (24).
Data Collection
The study was approved by the MD Anderson Institutional Review Board. All participants provided written informed consent before participation in the study. Epidemiologic data were collected by MD Anderson staff interviewers in an in-person interview. Weight at age 20 and 40 years was recorded, as well as usual weight (ie, weight 3 years before diagnosis [for case subjects] or recruitment [for control subjects]). Body mass Index (BMI; kg/m2) was derived from weight at different ages and adult height. Participants also reported the average frequency they spent on five broad groups of activities in the year before the interview. After the interview, a 40-ml blood sample was collected from each participant and delivered to the laboratory for molecular analysis.
Selection of Single Nucleotide Polymorphisms (SNPs)
The selection of genes and SNPs was described previously (43). Briefly, 222 SNPs from 22 genes were originally selected. SNPs were within 10kb upstream of the transcription start site and 10kb downstream of the transcription stop site of each gene. The genotyping data for these SNPs were extracted from previously genotyped SNPs as part of our genome-wide association study of RCC (44). One hundred fifty-seven SNPs located in 18 genes in the PI3K-AKT-mTOR pathway were extracted. Nearby SNPs in high linkage disequilibrium (r 2 > 0.80, distance < 500kb) with the targeted SNPs not covered by genome-wide association study and 33 proxy SNPs were identified. Thus, a total of 190 SNPs (157 original SNPs and 33 proxy SNPs) from 22 genes in the mTOR pathway were available for analysis. The SNPs were originally genotyped using Illumina HumanHap660K BeadChips (case subjects, Illumina Inc., San Diego, CA) or Illumina HumanHap610K BeadChips (control subjects, Illumina Inc., San Diego, CA).
Statistical Analysis
Continuous variables were analyzed using Student t test or the Wilcoxon rank-sum test, whereas categorical variables were analyzed using Pearson χ2. BMI was categorized according to the standard classifications of the World Health Organization (normal = <25kg/m2; overweight = ≤25–29.9kg/m2; obese = ≥30kg/m2) (45). Weight change was calculated as weight at age 40 years minus weight at age 20 years. Weight gain (defined as weight change > 0.1 lb) was categorized into tertiles (0.1–10 lb; 10.1–25 lb; and >25 lb) in control subjects. The same strategy was applied to calculate and categorize BMI change. A metabolic equivalent value (MET) was assigned on the basis of the energy cost of each activity group (46,47). The energy expenditure from physical activity was calculated as the MET value of each activity multiplied by the frequency of each activity and then summed across all activities. We estimated the weekly MET of activity, and the score was categorized into tertiles in control subjects.
A multivariable unconditional logistic regression model was used to estimate odds ratios (ORs) and their 95% confidence intervals (CIs). A logistic regression spline model (48) was used to complement traditional logistic regression to investigate the dose–response relationship for BMI at different ages and weight gain. The linearity of splines was tested. The number of knots and segments was determined by minimizing Akaike’s information criterion (49).
For each SNP, we evaluated additive, dominant, and recessive models. The model with the smallest P value was chosen as the best-fitting one. Considering linkage disequilibrium, only one SNP with the smallest P value for each block was selected for further analyses. To account for multiple comparisons, we chose the false discovery rate method (50) and considered a Q value less than.05 as the significance level to take into account multiple comparisons. Furthermore, we generated 1000 datasets by randomly permuted case subject and control subject status. The permutation-based false discovery rate for each SNP was calculated by the following formula:
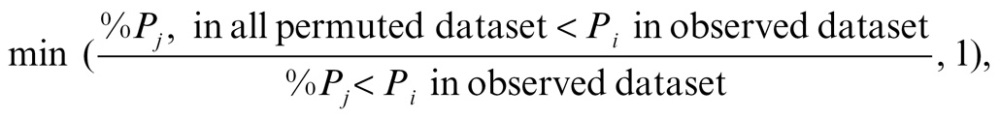 |
where P is the smallest P value from 3 genetic models, and i, j = 1, 2 … N (N is the total number of SNPs in the dataset; the range of the denominator is from 1/N to 1). Consistent results obtained from two methods indicated the probability of false positives was controlled. Genotypes showing statistically significant association in single SNP analysis were treated as unfavorable genotypes in cumulative analysis.
We performed stratified analyses for weight change across different strata, including usual BMI (BMI 3 years before diagnosis), BMI at age 40 years, BMI at age 20 years, physical activity, and history of hypertension. Also, stratified analysis for unfavorable genotypes was performed across BMI, weight change, and physical activity strata. Interaction terms were assessed as well. All statistical analyses were performed using Stata 10.0 (College Station, TX). All statistical tests were two-sided.
Results
A total of 577 case subjects and 593 control subjects were included in this study (Supplementary Table 1, available online). We restricted our analyses to non-Hispanic white participants because of the small sample size of minority ethnic groups. By study design, case subjects and control subjects were well matched by age and sex (Supplementary Table 1, available online). Case subjects had a larger proportion of history of hypertension than control subjects (P < .001). Case subjects also had higher usual BMI (P < .001), higher BMI at age 20 years (P < .001), higher BMI at age 40 years (P < .001) than control subjects. The proportion of case subjects with low physical activity was statistically significantly higher than the proportion of control subjects with low physical activity (P < .001). However, we observed no statistically significant differences between case subjects and control subjects in smoking status (P = .38) or pack years of smoking (P = .20) (Supplementary Table 1, available online). Among 577 case subjects, 402 participants had genome-wide association study genotyping data available. The distribution of host characteristics was compared for case subjects with and without genotyping data, and no statistically significant differences were observed (Supplementary Table 2, available online).
Low physical activity (METs < 27 per week) during adult life was associated with a 4.08-fold increased risk of RCC (95% CI = 2.92 to 5.70; P < .001) compared with intensive physical activity (MET ≥ 45 per week) (Table 1). Compared with participants with normal BMI, overweight and obese participants had 1.41-fold increased risk (95% CI = 0.98 to 2.03; P = .07) and 1.50-fold increased risk of RCC (95% CI = 1.04 to 2.08; P = .03), respectively, in a dose–response trend (Ptrend = .04). Participants who were overweight or obese at age 40 years had a 1.40-fold (95%CI = 1.02 to 1.93; P = .04) and a 2.03-fold (95% CI = 1.38 to 2.98; P < .001) increased risk, respectively, compared with participants with normal BMI at this age. BMI at age 20 years yielded similar results (OR = 1.92, 95% CI = 1.05 to 3.50; P = .03) (Table 1). After the adjustment of covariables, moderate weight gain (10–25 lb) and massive weight gain (>25 lb) between age 20 years and age 40 years were associated with a 1.46-fold (95% CI =1.02 to 2.09; P = .04) and a 1.62-fold (95% CI = 1.10 to 2.39; P = .01) increased risk of RCC, respectively, compared with minor weight gain (0.1–10 lb). However, weight loss (<0 lb) was not associated with RCC risk. There were statistically significant differences in weight change by age, BMI, physical activity, and history of hypertension (Supplementary Table 3, available online). For example, participants who experienced massive weight gain (>25 lb) were younger at age of diagnosis, had higher usual BMI, and were physically less active than those who had minor weight gain (0.1–10 lb). RCC risk with usual BMI, BMI at age 20 years, BMI at age 40 years, and weight change between age 20 years and age 40 years are shown in Figure 1, A–D. RCC risk with usual BMI (Figure 1A) and BMI at age 40 (Figure 1B) were S-shaped, but linearity was not rejected by the test (Plinearity = .12 and Plinearity = .06, respectively). Similarly, linear trend was observed for BMI at age 20 years and weight change (Plinearity = .32 and Plinearity = .07, respectively) (Figure 1, C and D). Slightly increased risk was also observed with weight loss. We also changed the number of knots, and the overall trend was not statistically significantly altered (Supplementary Figure 1, available online), and no threshold effect for either BMI change or weight change was observed.
Table 1.
Main effects of epidemiologic risk factors for renal cell carcinoma*
| Variable | Case subjects/control subjects | OR (95% CI) | P |
| Physical activity† | |||
| Intensive | 77/214 | Referent | |
| Medium | 124/200 | 1.65 (1.16 to 2.34) | .005 |
| Low | 251/165 | 4.08 (2.92 to 5.70) | <.001 |
| Ptrend | <.001 | ||
| Usual BMI‡ | |||
| Normal | 80/161 | Referent | |
| Overweight | 178/223 | 1.41 (0.98 to 2.03) | .07 |
| Obese | 207/201 | 1.50 (1.04 to 2.18) | .03 |
| Ptrend | .04 | ||
| BMI 3 years before diagnosis, continuous | 1.03 (1.01to1.05) | .01 | |
| BMI at age 20 years | |||
| Normal | 304/446 | Referent | |
| Overweight | 124/118 | 1.48 (1.08 to 2.05) | .02 |
| Obese | 34/21 | 1.92 (1.05 to 3.50) | .03 |
| Ptrend | .003 | ||
| BMI at age 20 years, continuous | 1.07 (1.03 to 1.11) | <.001 | |
| BMI at age 40 years | |||
| Normal | 145/265 | Referent | |
| Overweight | 180/220 | 1.40 (1.02 to 1.93) | .04 |
| Obese | 122/85 | 2.03 (1.38 to 2.98) | <.001 |
| Ptrend | <.001 | ||
| BMI at age 40 years, continuous | <.001 | ||
| Weight change, age 20–40 years§ | |||
| Weight loss > 0 lb | 24/28 | 1.70 (0.89 to 3.27) | .11 |
| Weight gain 0.1–10 lb | 109/204 | Ref. | |
| Weight gain 10.1–25 lb | 138/167 | 1.46 (1.02 to 2.09) | .04 |
| Weight gain >25 lbs. | 174/171 | 1.62 (1.10 to 2.39) | .01 |
| Ptrend | .09 | ||
| .03|| | |||
* For usual body mass index (BMI) (either categorized or continuous), BMI at age 20 years (either categorized or continuous), and BMI at age 40 years (either categorized or continuous), each variable was separately modeled with logistic regression and was adjusted for age, sex, smoking status, physical activity, and history of hypertension. For physical activity, the model was adjusted for age, sex, smoking status, history of hypertension, and usual BMI (category). All statistical tests were two-sided. CI = confidence interval; OR = odds ratio.
† Intensive: Metabolic equivalent value (MET) ≥ 45 per week; Medium: MET = 27–44.9 per week; Low: MET < 27 per week.
‡ Usual BMI refers to BMI 3 years before diagnosis or recruitment. Normal: <25kg/m2; Overweight: 25–29.9kg/m2; Obese: >30kg/m2.
§ The model for weight change was adjusted for age, sex, smoking status, usual BMI (category), history of hypertension, and physical activity, additionally adjusted for BMI at age 20 years (category).
|| The P value for dose–response trend is statistically significant if weight loss and subtle weight gain (0.1–10 lb) groups are collapsed into the reference group.
Figure 1.

Logistic spline regression for body mass index (BMI) and weight change. A) Usual BMI. The curves are truncated at BMI equal to 45. B) BMI (age 40 years). The curves are truncated at BMI equal to 38. C) BMI (age 20 years). The curves are truncated at BMI equal to 35. If participants with extreme obesity were included there would have been much wider 95% confidence interval (CI). Only 33 participants had usual BMI greater than 45 (2.9% of our study population). Thirty-nine participants had BMI (age 40 years) greater than 38 (3.8%). Twelve participants had BMI (age 20 years) greater than 35 (1.1%). D) Weight change. Forty-eight participants had weight change greater than 65 lb during the period (4.7%). In the spline model, the adjustment is the same as for our logistic regression models. The selection of knots is based on smallest Akaike’s information criterion (AIC). All statistical tests were two-sided.
We performed analysis for weight change stratified by usual BMI, BMI at age 40 years, BMI at age 20 years, physical activity, and history of hypertension (Table 2). The impact of massive weight gain was consistently observed for people who had abnormal BMI but not in subjects who had normal weight in all three time periods. Gaining weight during adulthood was also only associated with RCC risk in subjects who were less physically active and had a history of hypertension. However, none of the interactions was significant.
Table 2.
Stratified analysis and interaction among obesity, weight change and physical activity*
| Weight change from age 20 years to age 40 years | ||||||||||||
| Weight gain, 0.1–10 lb | Weight loss, >0 lb | Weight gain, 10.1–25 lb | Weight gain, >25 lb | |||||||||
| Case subjects/control subjects | OR (95% CI) | Case subjects/control subjects | OR (95% CI) | P | Case subjects/control subjects | OR (95% CI) | P | Case subjects/control subjects | OR (95% CI) | P | Pinteraction | |
| Usual BMI† | ||||||||||||
| Normal | 37/90 | Ref. | 6/9 | 3.51 (1.01 to 12.27) | .049 | 23/40 | 1.36 (0.67 to 2.75) | .39 | 10/15 | 1.47 (0.53 to 4.07) | .46 | .93 |
| Overweight and obese | 72/114 | Ref. | 18/19 | 1.47 (0.68 to 3.20) | .33 | 115/127 | 1.46 (0.95 to 2.25) | .08 | 164/156 | 1.65 (1.07 to 2.54) | .02 | |
| BMI (age 40 years)† | ||||||||||||
| Normal | 68/139 | Ref. | 8/14 | 2.83 (0.88 to 9.07) | .08 | 53/80 | 1.31 (0.79 to 2.16) | .29 | 16/32 | 0.90 (0.43 to 1.89) | .79 | .46 |
| Overweight and obese | 41/65 | Ref. | 16/14 | 1.98 (0.82 to 4.78) | .13 | 85/87 | 1.73 (0.99 to 3.03) | .06 | 158/139 | 2.05 (1.17 to 3.60) | .01 | |
| BMI (age 20 years)† | ||||||||||||
| Normal | 79/152 | Ref. | 6/9 | 2.46 (0.79 to7.67) | .12 | 96/137 | 1.24 (0.81 to 1.90) | .31 | 114/135 | 1.44 (0.91 to 2.28) | .12 | .27 |
| Overweight and obese | 30/52 | Ref. | 18/19 | 1.97 (0.83 to 4.66) | .13 | 42/30 | 2.01 (0.98 to 4.11) | .06 | 60/36 | 2.20 (1.06 to 4.53) | .03 | |
| Physical activity‡ | ||||||||||||
| Intensive | 21/78 | Ref. | 7/14 | 2.30 (0.54 to 9.86) | .26 | 22/66 | 1.34 (0.76 to 2.38) | .31 | 23/49 | 1.53 (0.86 to 2.75) | .15 | .86 |
| Medium and low | 88/126 | Ref. | 17/14 | 1.84 (0.80 to 4.20) | .15 | 116/101 | 1.53 (1.01 to 2.33) | .047 | 151/122 | 1.58 (1.01 to 2.45) | .04 | |
| Hypertension | ||||||||||||
| No | 61/130 | Ref. | 10/20 | 1.43 (0.58 to 3.52) | .44 | 54/100 | 1.05 (0.64 to 1.72) | .85 | 66/88 | 1.09 (0.62 to 1.89) | .77 | .52 |
| Yes | 48/74 | Ref. | 14/8 | 2.45 (0.88 to 6.85) | .09 | 84/67 | 2.12 (1.23 to 3.66) | .007 | 108/83 | 2.40 (1.36 to 4.23) | .002 | |
* Logistic regression was used to estimate odds rations (ORs) and 95% confidence intervals (CIs) while adjusting for age, sex, smoking status, physical activity, and history of hypertension where appropriate. All statistical tests were two-sided. BMI= Body mass index. MET= Metabolic equivalent value.
† BMI: Normal: <25kg/m2; Overweight and obese l: ≥25kg/m2. Usual BMI refers to BMI 3 years before diagnosis or recruitment.
‡ Intensive: metabolic equivalent value (MET) ≥ 45 per week; Medium: MET 27–44.9 per wk.; Low: MET < 27 per week.
Among the 190 SNPs (Supplementary Table 4, available online) in the mTOR pathway (Supplementary Figure 2, available online) that were available for analysis, a total of 28 SNPs were statistically significantly associated with RCC risk after adjustments (P < .05; data not shown). Six SNPs located in AKT3 remained statistically significant using the criterion Q < .05, and the most statistically significant was rs4132509 (OR = 1.68, 95% CI = 1.30 to 2.17; P = 6.44×10⁻⁵) under an additive genetic model (Supplementary Table 5, available online). Five of six SNPs also had permutation-based false discovery rate less than 0.10. Two SNPs were in high linkage disequilibrium (rs3766673 and rs4132509; r 2 = 1.00); thus, only rs4132509 was included in cumulative effect analysis. In a joint analysis of the cumulative effect of the significant SNPs, participants with one to two unfavorable genotypes were at 1.14-fold (95% CI = 0.79 to 1.66; P = .49) increased risk, and participants with three to five unfavorable genotypes had a 1.72-fold increased risk (95% CI = 1.20 to 2.46; P = .003), with a statistically significant dose−response trend (Ptrend = .002) (Table 3).
Table 3.
Associations between the number of unfavorable genotypes and renal cell carcinoma risk
| Variable | Case subjects, No. (%) | Control subjects, No. (%) | OR (95% CI)* | P |
| No. of unfavorable genotypes† | ||||
| 0 | 108 (26.87) | 136 (31.70) | Referent | |
| 1–2 | 117 (29.10) | 149 (34.73) | 1.14 (0.79 to 1.66) | .49 |
| 3–5 | 177 (44.03) | 144 (33.57) | 1.72 (1.20 to 2.46) | .003 |
| Ptrend | .002 | |||
* Odds ratios (ORs) were estimated by logistic regression adjusted for age, sex, smoking status, body mass index at 3 years before the diagnosis or recruitment, and hypertension. All statistical tests were two-sided. CI = confidence interval.
† No. of unfavorable genotypes: calculated from rs4132509, rs12031994, rs4430311, rs1058304, and rs23459 94.
Grouping is based on tertiles of the number of unfavorable genotypes in control subjects.
Missing single nucleotide polymorphism data resulted in a lower number of case subjects and control subjects.
Stratified analysis showed that the risk associated with unfavorable genotypes was different by weight gain, physical activity, and BMI. For example, people with three to five unfavorable genotypes had increased RCC risk only in the subgroup with normal weight and in the subgroup that had experienced more than 25 lb of weight gain. The risk conferred by unfavorable genotypes only increased in physically inactive participants but not in subjects with intensive physical activity (Table 4).
Table 4.
Stratified analysis for unfavorable genotypes across strata of energy balance–related factors in renal cell carcinoma patients*
| 0 unfavorable genotypes | 1–2 unfavorable genotypes | 3–5 unfavorable genotypes | ||||||
| Strata | Case subjects/control subjects | OR (95% CI)† | Case subjects/control subjects | OR (95% CI)† | P | Case subjects/control subjects | OR (95% CI)† | P |
| Usual BMI ‡ | ||||||||
| Normal | 10/44 | Referent | 21/48 | 1.86 (0.79 to 4.42) | .16 | 29/29 | 4.29 (1.80 to 10.2) | .001 |
| Overweight and obese | 78/92 | Referent | 87/101 | 1.02 (0.67 to 1.52) | .92 | 130/114 | 1.39 (0.93 to 2.08) | .11 |
| Pinteraction | .06 | |||||||
| Weight gain (age 20 years to age 40 yearss)§ | ||||||||
| Weight loss >0 lb | 2/8 | Referent | 4/8 | 2.13 (0.24 to 19.2) | .50 | 9/4 | 4.74 (0.31 to 72.2) | .26 |
| Weight gain 0–10 lb | 21/45 | Referent | 26/62 | 0.93 (0.46 to 1.91) | .85 | 38/54 | 1.53 (0.77 to 3.05) | .23 |
| Weight gain 10.1–25 lb | 34/39 | Referent | 34/37 | 0.94 (0.47 to 1.90) | .87 | 42/44 | 1.02 (0.53 to 1.96) | .95 |
| Weight gain >25 lb | 30/41 | Referent | 39/40 | 1.36 (0.70 to 2.65) | .37 | 62/36 | 2.33 (1.23 to 4.44) | .01 |
| Pinteraction | .39 | |||||||
| Physical activity|| | ||||||||
| Intensive | 12/47 | Referent | 23/63 | 1.40 (0.62 to 3.14) | .41 | 26/53 | 1.71 (0.76 to 3.85) | .19 |
| Medium and low | 72/87 | Referent | 86/85 | 1.24 (0.80 to 1.93) | .34 | 127/88 | 1.79 (1.17 to 2.72) | .007 |
| Pinteraction | .89 | |||||||
* BMI = body mass index; CI = confidence interval; OR = odds ratio.
† OR were estimated by logistic regression adjusted for age, gender, smoking status, usual BMI, hypertension, and physical activity where appropriate. All statistical tests were two-sided.
‡ Usual BMI refers to BMI 3 years before diagnosis or recruitment.
§ Weight gain from age 20 years to age 40 years.
|| Intensive: metabolic equivalent value (MET) ≥ 45 per week; Medium: MET 27–44.9 per week; Low: MET <27 per week.
Discussion
To our knowledge, this is the first study to examine obesity during life course, physical activity, weight change, and genetic variants in the mTOR pathway jointly in relation to risk of RCC. Our results showed that obesity is consistently associated with increased RCC risk during the life course. Obesity is a well-recognized risk factor for kidney cancer. Two meta-analyses showed that each unit increase in BMI contributed to a 5% and 6% increase in the risk of kidney cancer in men and women, respectively (51,52). Previous cohort studies showed that being obese could result in 60% to nearly twofold greater RCC risk (5,8,11,13,16). Evidence from case−control studies has also consistently suggested an association between increased RCC risk and obesity (10,14). Obesity increases insulin and insulinlike growth factor 1 levels (53), as well as free endogenous estrogens, which may influence the growth and proliferation of renal cells (54). Obesity can increase lipid peroxidation, which may be related to the etiology of RCC (55). Excessive BMI is also thought to damage the kidneys through oxidative stress and other hypertension-induced injuries or atherosclerosis (56−58).
The association we observed between weight gain in adulthood and RCC risk supports previous studies that reported associations that were statistically significant (8,11,18) or borderline statistically significant (5). Weight gain in adulthood was identified as an independent risk factor for RCC after adjustment for BMI in cohort studies (5,8,18). One study provided evidence that weight gain at early and middle adulthood rather than weight gain after midlife was strongly associated with RCC risk (8). In contrast, one case−control study showed that increased BMI from age 30 years was not statistically significantly associated with risk of RCC (10). However, this result may have been confounded by the obesity status of participants at the beginning or end of the interval. To avoid such confounding, we adjusted for BMI when evaluating the effect of weight gain. Our results indicated that weight gain from age 20 years to age 40 years was positively associated with RCC risk independent of BMI. Moreover, in stratified analyses, our data showed that the adverse effects of weight gain were only present in people who were overweight or obese either at early adulthood (BMI at age 20 years), mid-adulthood (BMI at age 40 years) or recently (usual BMI) (Table 2), suggesting that BMI may be a mediator in the causal pathway between weight gain and RCC. Gaining weight during adulthood may result in several unfavorable changes in blood pressure, lipid levels, and glucose metabolism (59). Interestingly, as long as people keep normal BMI, gaining weight has minimum impact on RCC risk. However, prospective cohort studies are warranted to elucidate the complex interaction between obesity and weight gain as well as the possible mediating role of obesity in the weight gain−cancer association.
We further performed logistic spline regression showing increased RCC risk with increasing usual BMI, BMI at age 20 years, BMI at age 40 years, and weight change (Figure 1). The curves were linear and stable regardless of the number of knots. One advantage of spline regression over traditional logistic regression is that it is better for assessing threshold effects and trends. The result that no threshold was observed for BMI was consistent with a previous study (60). One limitation of spline regression is that it could be sensitive to data, and, in case of limited data, the model could be an artifact of noise relative to the signal in the dataset (48). However, it is still a complement to standard logistic regression for case−control studies (48).
Physical activity was associated with reduced RCC risk in cohort studies (9,13,18,19). One cohort study showed that individuals who engaged in physical activity more than five times per week had lower RCC risk (relative risk = 0.81, 95% CI = 0.67 to 0.98) (9). Two other studies reported an inverse but non-statistically significant association (18,19). However, a study of twin cohorts in Sweden found no association (21). Results from case−control studies were also inconsistent (12,14,17,20). In our study, we observed that low physical activity was strongly associated with RCC risk, which is in agreement with findings from previous studies (9,13,20). The inconsistent results may have been attributed to various measures of physical activity. Usual leisure time physical activity during the past year (19,21), the frequency of physical activity during a certain period (9,20), the hours spent on physical activity per day or per week (12,18), and MET values (13,14) were used by different studies. We estimated weekly MET values, which account for both frequency and duration (47). Several biological mechanisms involved in lowering RCC risk by increasing physical activity have been proposed, including reducing body weight and blood pressure, reducing chronic inflammation and oxidative stress, and improving insulin sensitivity (31). Notably, our data showed that weight gain in adulthood had no effects in subjects who were physically active but statistically significantly positively associated with cancer risk in subjects who were less active, indicating that intensive physical activity may partially reverse the hazardous effect of weight gain.
Compelling evidence emphasizes the impact of genetic susceptibility in development of kidney cancer (22−29,40). In the complicated signaling network, the mTOR pathway may connect excessive BMI, weight gain, and lack of physical activity to RCC because its activity would be influenced by excessive energy that could then affect cell growth and proliferation. Mutations in the mTOR pathway have been observed in many cancers, such as breast, bladder, ovarian, brain, colon, kidney, and hepatocellular carcinomas (43,61,62). Mutations in several genes (eg, PTEN, TSC1, and TSC2) belonging to the mTOR pathway were found to have an important impact on the development of kidney cancer (29,40). It is also possible that dietary energy balance could modulate cellular signaling and thereby regulate multiple downstream genes located in the mTOR pathway (63). Furthermore, animal experiments showed that physical activity and restricted energy intake could reduce chemical-induced carcinogenesis by downregulating mTOR (41). Consistent with these results, our data also suggested that genetic variants in the mTOR pathway modified the association between energy-related risk factors and RCC risk.
To minimize survival bias, we chose to analyze incident case subjects and frequency-matched our control subjects to case subjects by age and sex. One limitation of our study is that the information for energy intake was not available for our analyses. Another limitation of our study is that the sample size may not be sufficient to detect interaction effects. However, our study comprehensively collected BMI information during life course that allowed evaluation of weight change and its association with RCC.
In conclusion, our results indicated that weight gain and physical activity were independent risk factors for RCC. Furthermore, to our knowledge, this is the first study to assess the joint effects of epidemiologic risk factors and genetic polymorphisms in the mTOR pathway on RCC risk. Our results provide evidence that excessive BMI, weight gain during adulthood, low physical activity, and genetic variants in the mTOR pathway may jointly influence RCC risk. Our results warrant replication in future prospective studies.
Funding
This work was supported in part by grants from the National Cancer Institute (R01 CA111646, P50 CA070907, R01 CA127219, R01 CA55769, and R03 CA128079).
Supplementary Material
The sponsor was not involved in the design and conduct of the study; collection, management, analysis, and interpretation of the data; and preparation, review, or approval of the manuscript. The corresponding author had full access to all of the data in the study and takes responsibility for the integrity of the data and the accuracy of the data analysis.
All authors declare no potential conflicts of interest, including specific financial interests and relationships relevant to the subject of this manuscript.
References
- 1. Siegel R, Naishadham D, Jemal A. Cancer statistics, 2012. CA Cancer J Clin. 2012; 62(1):10–29 [DOI] [PubMed] [Google Scholar]
- 2. Chow WH, Devesa SS, Warren JL, Fraumeni JF., Jr Rising incidence of renal cell cancer in the United States. JAMA. 1999; 281(17):1628–1631 [DOI] [PubMed] [Google Scholar]
- 3. Hunt JD, van der Hel OL, McMillan GP, Boffetta P, Brennan P. Renal cell carcinoma in relation to cigarette smoking: meta-analysis of 24 studies. Int J Cancer. 2005; 114(1):101–108 [DOI] [PubMed] [Google Scholar]
- 4. Calle EE, Kaaks R. Overweight, obesity and cancer: epidemiological evidence and proposed mechanisms. Nat Rev Cancer. 2004; 4(8):579–591 [DOI] [PubMed] [Google Scholar]
- 5. Chow WH, Gridley G, Fraumeni JF, Jr, Jarvholm B. Obesity, hypertension, and the risk of kidney cancer in men. N Engl J Med. 2000; 343(18):1305–1311 [DOI] [PubMed] [Google Scholar]
- 6. Flaherty KT, Fuchs CS, Colditz GA, et al. A prospective study of body mass index, hypertension, and smoking and the risk of renal cell carcinoma (United States). Cancer Causes Control. 2005; 16(9):1099–1106 [DOI] [PubMed] [Google Scholar]
- 7. Benichou J, Chow WH, McLaughlin JK, Mandel JS, Fraumeni JF., Jr Population attributable risk of renal cell cancer in Minnesota. Am J Epidemiol. 1998; 148(5):424–430 [DOI] [PubMed] [Google Scholar]
- 8. Adams KF, Leitzmann MF, Albanes D, et al. Body size and renal cell cancer incidence in a large US cohort study. Am J Epidemiol. 2008; 168(3):268–277 [DOI] [PMC free article] [PubMed] [Google Scholar]
- 9. Moore SC, Chow WH, Schatzkin A, et al. Physical activity during adulthood and adolescence in relation to renal cell cancer. Am J Epidemiol. 2008; 168(2):149–157 [DOI] [PMC free article] [PubMed] [Google Scholar]
- 10. Dal Maso L, Zucchetto A, Tavani A, et al. Renal cell cancer and body size at different ages: an Italian multicenter case-control study. Am J Epidemiol. 2007; 166(5):582–591 [DOI] [PubMed] [Google Scholar]
- 11. Luo J, Margolis KL, Adami HO, Lopez AM, Lessin L, Ye W. Body size, weight cycling, and risk of renal cell carcinoma among postmenopausal women: the Women’s Health Initiative (United States). Am J Epidemiol. 2007; 166(7):752–759 [DOI] [PubMed] [Google Scholar]
- 12. Tavani A, Zucchetto A, Dal Maso L, et al. Lifetime physical activity and the risk of renal cell cancer. Int J Cancer. 2007; 120(9):1977–1980 [DOI] [PubMed] [Google Scholar]
- 13. Setiawan VW, Stram DO, Nomura AM, Kolonel LN, Henderson BE. Risk factors for renal cell cancer: the multiethnic cohort. Am J Epidemiol. 2007; 166(8):932–940 [DOI] [PubMed] [Google Scholar]
- 14. Pan SY, DesMeules M, Morrison H, Wen SW. Obesity, high energy intake, lack of physical activity, and the risk of kidney cancer. Cancer Epidemiol Biomarkers Prev. 2006; 15(12):2453–2460 [DOI] [PubMed] [Google Scholar]
- 15. Lindblad P, Wolk A, Bergstrom R, Persson I, Adami HO. The role of obesity and weight fluctuations in the etiology of renal cell cancer: a population-based case-control study. Cancer Epidemiol Biomarkers Prev. 1994; 3(8):631–639 [PubMed] [Google Scholar]
- 16. Pischon T, Lahmann PH, Boeing H, et al. Body size and risk of renal cell carcinoma in the European Prospective Investigation into Cancer and Nutrition (EPIC). Int J Cancer. 2006; 118(3):728–738 [DOI] [PubMed] [Google Scholar]
- 17. Chiu BC, Gapstur SM, Chow WH, Kirby KA, Lynch CF, Cantor KP. Body mass index, physical activity, and risk of renal cell carcinoma. Int J Obes (Lond). 2006; 30(6):940–947 [DOI] [PubMed] [Google Scholar]
- 18. van Dijk BA, Schouten LJ, Kiemeney LA, Goldbohm RA, van den Brandt PA. Relation of height, body mass, energy intake, and physical activity to risk of renal cell carcinoma: results from the Netherlands Cohort Study. Am J Epidemiol. 2004; 160(12):1159–1167 [DOI] [PubMed] [Google Scholar]
- 19. Mahabir S, Leitzmann MF, Pietinen P, Albanes D, Virtamo J, Taylor PR. Physical activity and renal cell cancer risk in a cohort of male smokers. Int J Cancer. 2004; 108(4):600–605 [DOI] [PubMed] [Google Scholar]
- 20. Menezes RJ, Tomlinson G, Kreiger N. Physical activity and risk of renal cell carcinoma. Int J Cancer. 2003; 107(4):642–646 [DOI] [PubMed] [Google Scholar]
- 21. Bergstrom A, Terry P, Lindblad P, et al. Physical activity and risk of renal cell cancer. Int J Cancer. 2001; 92(1):155–157 [PubMed] [Google Scholar]
- 22. Schlehofer B, Pommer W, Mellemgaard A, et al. International renal-cell-cancer study. VI. The role of medical and family history. Int J Cancer. 1996; 66(6):723–726 [DOI] [PubMed] [Google Scholar]
- 23. Gago-Dominguez M, Yuan JM, Castelao JE, Ross RK, Yu MC. Family history and risk of renal cell carcinoma. Cancer Epidemiol Biomarkers Prev. 2001; 10(9):1001–1004 [PubMed] [Google Scholar]
- 24. Clague J, Lin J, Cassidy A, et al. Family history and risk of renal cell carcinoma: results from a case–control study and systematic meta-analysis. Cancer Epidemiol Biomarkers Prev. 2009; 18(3):801–807 [DOI] [PMC free article] [PubMed] [Google Scholar]
- 25. Latif F, Tory K, Gnarra J, et al. Identification of the von Hippel-Lindau disease tumor suppressor gene. Science. 1993; 260(5112):1317–1320 [DOI] [PubMed] [Google Scholar]
- 26. Schmidt L, Duh FM, Chen F, et al. Germline and somatic mutations in the tyrosine kinase domain of the MET proto-oncogene in papillary renal carcinomas. Nat Genet.May 1997; 16(1):68–73 [DOI] [PubMed] [Google Scholar]
- 27. Tomlinson IP, Alam NA, Rowan AJ, et al. Germline mutations in FH predispose to dominantly inherited uterine fibroids, skin leiomyomata and papillary renal cell cancer. Nat Genet. 2002; 30(4):406–410 [DOI] [PubMed] [Google Scholar]
- 28. Nickerson ML, Warren MB, Toro JR, et al. Mutations in a novel gene lead to kidney tumors, lung wall defects, and benign tumors of the hair follicle in patients with the Birt-Hogg-Dube syndrome. Cancer Cell. 2002; 2(2):157–164 [DOI] [PubMed] [Google Scholar]
- 29. Lipworth L, Tarone RE, McLaughlin JK. Renal cell cancer among African Americans: an epidemiologic review. BMC Cancer. 2011; 11 133 [DOI] [PMC free article] [PubMed] [Google Scholar]
- 30. Chow WH, Devesa SS. Contemporary epidemiology of renal cell cancer. Cancer J. 2008; 14(5):288–301 [DOI] [PMC free article] [PubMed] [Google Scholar]
- 31. Chow WH, Dong LM, Devesa SS. Epidemiology and risk factors for kidney cancer. Nat Rev Urol. 2010; 7(5):245–257 [DOI] [PMC free article] [PubMed] [Google Scholar]
- 32. Hanna SC, Heathcote SA, Kim WY. mTOR pathway in renal cell carcinoma. Expert Rev Anticancer Ther. 2008; 8(2):283–292 [DOI] [PubMed] [Google Scholar]
- 33. Zoncu R, Efeyan A, Sabatini DM. mTOR: from growth signal integration to cancer, diabetes and ageing. Nat Rev Mol Cell Biol. 2011; 12(1):21–35 [DOI] [PMC free article] [PubMed] [Google Scholar]
- 34. Sarbassov DD, Guertin DA, Ali SM, Sabatini DM. Phosphorylation and regulation of Akt/PKB by the rictor-mTOR complex. Science. 2005; 307(5712):1098–1101 [DOI] [PubMed] [Google Scholar]
- 35. Dowling RJ, Topisirovic I, Alain T, et al. mTORC1-mediated cell proliferation, but not cell growth, controlled by the 4E-BPs. Science. 2010; 328(5982):1172–1176 [DOI] [PMC free article] [PubMed] [Google Scholar]
- 36. Hsieh AC, Costa M, Zollo O, et al. Genetic dissection of the oncogenic mTOR pathway reveals druggable addiction to translational control via 4EBP-eIF4E. Cancer Cell. 2010; 17(3):249–261 [DOI] [PMC free article] [PubMed] [Google Scholar]
- 37. Menendez JA, Lupu R. Fatty acid synthase and the lipogenic phenotype in cancer pathogenesis. Nat Rev Cancer. 2007; 7(10):763–777 [DOI] [PubMed] [Google Scholar]
- 38. Qu X, Yu J, Bhagat G, et al. Promotion of tumorigenesis by heterozygous disruption of the beclin 1 autophagy gene. J Clin Invest. 2003; 112(12):1809–1820 [DOI] [PMC free article] [PubMed] [Google Scholar]
- 39. Thomas GV, Tran C, Mellinghoff IK, et al. Hypoxia-inducible factor determines sensitivity to inhibitors of mTOR in kidney cancer. Nat Med. 2006; 12(1):122–127 [DOI] [PubMed] [Google Scholar]
- 40. Linehan WM, Srinivasan R, Schmidt LS. The genetic basis of kidney cancer: a metabolic disease. Nat Rev Urol. 2010; 7(5):277–285 [DOI] [PMC free article] [PubMed] [Google Scholar]
- 41. Jiang W, Zhu Z, Thompson HJ. Effects of physical activity and restricted energy intake on chemically induced mammary carcinogenesis. Cancer Prev Res (Phila). 2009; 2(4):338–344 [DOI] [PMC free article] [PubMed] [Google Scholar]
- 42. Olson SH, Kelsey JL, Pearson TA, Levin B. Evaluation of random digit dialing as a method of control selection in case-control studies. Am J Epidemiol. 1992; 135(2):210–222 [DOI] [PubMed] [Google Scholar]
- 43. Lin J, Wang J, Greisinger AJ, et al. Energy balance, the PI3K-AKT-mTOR pathway genes, and the risk of bladder cancer. Cancer Prev Res (Phila). 2010; 3(4):505–517 [DOI] [PMC free article] [PubMed] [Google Scholar]
- 44. Wu X, Scelo G, Purdue MP, et al. A genome-wide association study identifies a novel susceptibility locus for renal cell carcinoma on 12p11.23. Hum Mol Genet. 2012; 21(2):456–462 [DOI] [PMC free article] [PubMed] [Google Scholar]
- 45. Obesity: preventing and managing the global epidemic Report of a WHO consultation. World Health Organ Tech Rep Ser. 2000; 894 i–xii 1–253 [PubMed] [Google Scholar]
- 46. Ainsworth BE, Haskell WL, Leon AS, et al. Compendium of physical activities: classification of energy costs of human physical activities. Med Sci Sports Exerc. 1993; 25(1):71–80 [DOI] [PubMed] [Google Scholar]
- 47. Ainsworth BE, Haskell WL, Whitt MC, et al. Compendium of physical activities: an update of activity codes and MET intensities. Med Sci Sports Exerc. 2000; 32(9 Suppl):S498–504 [DOI] [PubMed] [Google Scholar]
- 48. Rosenberg PS, Katki H, Swanson CA, Brown LM, Wacholder S, Hoover RN. Quantifying epidemiologic risk factors using non-parametric regression: model selection remains the greatest challenge. Stat Med. 2003; 22(21):3369–3381 [DOI] [PubMed] [Google Scholar]
- 49. Polesel J, Dal Maso L, Bagnardi V, et al. Estimating dose-response relationship between ethanol and risk of cancer using regression spline models. Int J Cancer. 2005; 114(5):836–841 [DOI] [PubMed] [Google Scholar]
- 50. Storey JD, Tibshirani R. Statistical significance for genomewide studies. Proc Natl Acad Sci U S A. 2003; 100(16):9440–9445 [DOI] [PMC free article] [PubMed] [Google Scholar]
- 51. Ildaphonse G, George PS, Mathew A. Obesity and kidney cancer risk in men: a meta-analysis (1992–2008). Asian Pac J Cancer Prev. 2009; 10(2):279–286 [PubMed] [Google Scholar]
- 52. Mathew A, George PS, Ildaphonse G. Obesity and kidney cancer risk in women: a meta-analysis (1992–2008). Asian Pac J Cancer Prev. 2009; 10(3):471–478 [PubMed] [Google Scholar]
- 53. Kellerer M, von Eye Corleta H, Muhlhofer A, et al. Insulin- and insulin-like growth-factor-I receptor tyrosine-kinase activities in human renal carcinoma. Int J Cancer. 1995; 62(5):501–507 [DOI] [PubMed] [Google Scholar]
- 54. Zumoff B. Does postmenopausal estrogen administration increase the risk of breast cancer? Contributions of animal, biochemical, and clinical investigative studies to a resolution of the controversy. Proc Soc Exp Biol Med. 1998; 217(1):30–37 [DOI] [PubMed] [Google Scholar]
- 55. Gago-Dominguez M, Castelao JE, Yuan JM, Ross RK, Yu MC. Lipid peroxidation: a novel and unifying concept of the etiology of renal cell carcinoma (United States). Cancer Causes Control. 2002; 13(3):287–293 [DOI] [PubMed] [Google Scholar]
- 56. Dobrian AD, Davies MJ, Schriver SD, Lauterio TJ, Prewitt RL. Oxidative stress in a rat model of obesity-induced hypertension. Hypertension. 2001; 37(2 Part 2):554–560 [DOI] [PubMed] [Google Scholar]
- 57. Hall JE, Crook ED, Jones DW, Wofford MR, Dubbert PM. Mechanisms of obesity-associated cardiovascular and renal disease. Am J Med Sci. 2002; 324(3):127–137 [DOI] [PubMed] [Google Scholar]
- 58. Chade AR, Lerman A, Lerman LO. Kidney in early atherosclerosis. Hypertension. 2005; 45(6):1042–1049 [DOI] [PubMed] [Google Scholar]
- 59. Truesdale KP, Stevens J, Lewis CE, Schreiner PJ, Loria CM, Cai J. Changes in risk factors for cardiovascular disease by baseline weight status in young adults who maintain or gain weight over 15 years: the CARDIA study. Int J Obes (Lond). 2006; 30(9):1397–1407 [DOI] [PMC free article] [PubMed] [Google Scholar]
- 60. Bjorge T, Tretli S, Engeland A. Relation of height and body mass index to renal cell carcinoma in two million Norwegian men and women. Am J Epidemiol. 2004; 160(12):1168–1176 [DOI] [PubMed] [Google Scholar]
- 61. Jiang BH, Liu LZ. PI3K/PTEN signaling in angiogenesis and tumorigenesis. Adv Cancer Res. 2009; 102 19–65 [DOI] [PMC free article] [PubMed] [Google Scholar]
- 62. Slattery ML, Herrick JS, Lundgreen A, Fitzpatrick FA, Curtin K, Wolff RK. Genetic variation in a metabolic signaling pathway and colon and rectal cancer risk: mTOR, PTEN, STK11, RPKAA1, PRKAG2, TSC1, TSC2, PI3K and Akt1. Carcinogenesis. 2010; 31(9):1604–1611 [DOI] [PMC free article] [PubMed] [Google Scholar]
- 63. Moore T, Beltran L, Carbajal S, et al. Dietary energy balance modulates signaling through the Akt/mammalian target of rapamycin pathways in multiple epithelial tissues. Cancer Prev Res (Phila). 2008; 1(1):65–76 [DOI] [PubMed] [Google Scholar]
Associated Data
This section collects any data citations, data availability statements, or supplementary materials included in this article.