

Abstract
Chemical Exchange Saturation Transfer (CEST) offers a new type of contrast for MRI that is molecule specific. In this approach, a slowly exchanging NMR active nucleus, typically a proton, possessing a chemical shift distinct from water is selectively saturated and the saturated spin is transferred to the bulk water via chemical exchange. Many molecules can act as CEST agents, both naturally occurring endogenous molecules and new types of exogenous agents. A large variety of molecules have been demonstrated as potential agents, including small diamagnetic molecules, complexes of paramagnetic ions, endogenous macromolecules, dendrimers and liposomes. In this review we described the basic principles of the CEST experiment, with emphasis on the similarity to earlier saturation transfer experiments described in the literature. Interest in quantitative CEST has also resulted in the development of new exchange-sensitive detection schemes. Some emerging clinical applications of CEST are described and the challenges and opportunities associated with translation of these methods to the clinical environment are discussed.
Keywords: Saturation Transfer, CEST, MT, NOE, diaCEST, paraCEST, lipoCEST, spin-lock, off-resonance T1rho, APT, gagCEST, glycoCEST
I. Introduction
Contrast agents are widely used in MRI for signal enhancement. They allow better differentiation between healthy and diseased tissue, as well as better visualization of different structures. Most of the agents in clinical use today are complexes of Gd3+ ions that shorten the relaxation time of the free water protons. These agents are not selective, and distribute uniformly throughout the extracellular space after intravenous injection[1].
In addition to relaxation-based contrast, MRI offers a variety of contrast techniques based on the intrinsic properties of tissue, such as coupling to neighboring nuclei, chemical exchange or flow. Magnetization Transfer (MT) contrast, a technique utilizing Saturation Transfer (ST), uses a long, weak, off-resonance RF pulse to saturate a broad water signal that lies beneath a sharper bulk water signal in many tissues [2]. In early 90’s, Balaban and co-workers introduced Chemical Exchange Saturation Transfer (CEST) as a new class of contrast agents for MRI. In this approach, a slowly exchanging group possessing a chemical shift distinct from water is selectively saturated and the saturation is transferred to the bulk water via chemical exchange [3]. The method has gained and continues gaining popularity due to several attractive features. CEST allows the operator to switch the image contrast “on” and “off” via an RF pre-saturation pulse. As chemical exchange can be quite sensitive to the environment of a contrast agent, the CEST effect can be used to image important physiological parameters, such as pH [4-6] and metabolite levels [7-9]. Among numerous innovations and applications are multi-color CEST [10] and an artificial CEST gene reporter [11]. The technique can be applied for variety of ailments and metabolic disorders, such as cancer [12, 13], ischemia [14], cartilage degeneration [15], just to name a few.
A number of excellent reviews have been written on CEST methods and agents [16-23]. In this review we have tried to put an increased emphasis on the physics behind CEST experiment: to put it in the context of other saturation experiments, to emphasize similarities between exchange and cross relaxation, and to highlight identity with the off-resonance spin-lock experiments. We are covering in greater depth some of the novel, alternative exchange detection techniques. In addition, we have highlighted some of the emerging clinical applications of CEST and the challenges and opportunities associated with the translation to the clinic.
II. CEST 101
Mechanism
The basic principle of CEST is straightforward, and schematically shown in Figure 1. It relies on the presence of a solute protons resonating at a frequency different from water and engaged in the chemical exchange process, where a proton physically moves from the solute to solvent and back. The exchanging proton pool is saturated via selective RF irradiation at the solute frequency. The saturation is transferred to the bulk water via chemical exchange thus decreasing the magnetization (and the signal) of the water (Figure 1,b). The solute is typically in a very low concentration (μM to mM range) and is not observable in the standard MR signal. However, continuous transfer of saturation serves as amplification, allowing to indirectly observe solutes at low concentration [16]. For CEST to be successful the system needs to be in the slow to intermediate regime on the NMR scale, i.e. the chemical shift difference between solvent and solute (ΔCS) has to be greater (or equal) than the exchange rate (kex=kAB+kBA): kex<ΔCS. Notice that the definition of “slow” or “fast” is relative here, what is important is the ratio. For saturation transfer to work, the two spin pools need to be distinguishable, and we need to be able to modulate one of the lines with a minimum effect on the other; i.e., there should be separate spectral lines. This is possible in the slow exchange regime only. Hence, CEST is the most efficient in the slow exchange regime, although experiments were reported in the intermediate exchange regime as well.
Figure 1.

Schematic of CEST experiment. (a) Pool A (solvent) is in exchange with pool B (solute). (b) Pools A and B have distinct chemical shifts, with the difference of ΔCS. RF is applied on-resonance with pool B resulting in saturation transfer and signal decrease of pool A.(c) Z-spectrum: normalized water intensity (I/I0) vs off-resonance frequency of the saturating RF (ΔRF). Water resonance is assigned 0 ppm value. MTRasym: Z-spectrum asymmetry vs RF off-resonance value.
For the CEST analysis, the most common metric used is the Magnetization Transfer asymmetry (MTRasym), defined as:
| (1) |
Where I(Δcs) and I(-Δcs) are signal intensities acquired with RF irradiation applied on-resonance with the exchanging pool and at the frequency symmetric around water, and I0 is the reference signal intensity acquired without RF pre-saturation. In the following, MTRasym(Δcs) and “CEST effect” are used somewhat interchangeably.
Often the normalized water signal intensity is monitored vs the frequency of the off-resonance saturation: the so-called Z-spectrum [24], as illustrated in Figure 1,c.
Types of CEST agents
In the last decade a great variety of molecules were proposed to serve as CEST agents. To the best of our knowledge, at least two classifications were suggested. First relies on the nature of the solute: diamagnetic CEST (diaCEST) and paramagnetic CEST (paraCEST). We would add to it exogenous CEST agents using liposomes(lipoCEST) and nanolparticles (molecules containing hundreds of exchanging groups). Finally, there is CEST using hyperpolarized gases (hyperCEST). An alternative, more organized, classification was recently introduced [17] based on the type of exchanging species: proton exchange (endogenous and exogenous diaCEST, some paraCEST), molecular exchange (paraCEST and hyperCEST) and compartmental (liposomes and hyperCEST).
The chemical types of proton exchange groups that can act as diaCEST agents are largely confined to –NH, –NH2, or –OH groups. [3, 4, 8, 10-12, 14, 15, 25-28] (Figure 2, a). These groups could be endogenous (i.e., present in tissue) or exogenous (i.e., introduced as a contrast agent). The endogenous contrast utilizes exchanging protons in the fast tumbling molecules, protein backbones, side chains and small peptides present in tissue (e.g. in cells or matrix). As we will discuss in the following, the groups need to have T2 relaxation long enough to be distinguished from the broad macromolecular component in tissue. The chemical shift of the diaCEST agents is typically within 5ppm from water. Using the slow-to-intermediate exchange condition, ΔCS > kex, as a rough boundary condition for CEST effectiveness, one would expect CEST to arise only for proton sites that have an exchange rates of the order of ~2 × 10³ s−1 or slower. This range happens to encompass the exchange lifetimes observed for many types of –NH exchange groups and, occasionally, some –OH exchange groups. However, the small chemical shift differences, ΔCS, of diaCEST agents are their primary disadvantage, since saturation of such exchange groups usually results in partial saturation of the bulk water protons as well ([29], direct saturation effect). As will be mathematically shown later, CEST contrast increases with agent concentration or exchange rate. Moreover, the exchange rate dictates minimum concentration per exchanging group that could be detected. One way to increase CEST effect is to increase the number of the exchanging groups per agent. Thus, dendrimers and polymers containing multiple exchanging diaCEST proton groups were utilized as CEST agents [30, 31].
Figure 2.

Representative examples of CEST agents. (a) diaCEST agent: ammonia and the corresponding Z-spectrum (ammonia: black circles, water: white circles. Reproduced with permission from [112], Figure 1). (b) paraCEST agent: EuDOTA-(glycine ethyl ester)4 and the corresponding Z-spectrum. (c) lipoCEST agent: A spherical liposome is filled with a high concentration of TmDOTMA, a fast exchanging agent shifting intraliposomal water downfield by nearly 4 ppm. The exchange of the shifted water across membrane is slow, suitable for CEST. Corresponding Z-spectrum (from Ref.[46], figure 1). (d) hyperCEST agent: cryptophane-A cage encapsulated Xe (green) is saturated and the chemical exchange with the free Xe (blue) allow accumulation of CEST effect (adopted from [48], figure 1). Demonstration of hyperCEST in two-compartment phantom: upon selective saturation the signal from the biosensor labeled volume (red) is reduced, while the control volume signal (blue) remains unchanged (adopted from Ref.[48], figure 2).
The majority of diaCEST agents to date involve endogenous proton exchange types. These are attractive because nothing is injected (FDA approval not required) and CEST imaging can be performed using modifications of the existing pulse programs. Hence, diaCEST agents have a great potential to reach clinical applications in the near future. In Section V, we will discuss some of the endogenous diaCEST methods in greater detail. In addition, there are several diaCEST applications involving exogenous injection of the agent, such as glucose imaging (glucoCEST [32, 33]) and pH imaging using iopamodol [34].
As discussed above, the diaCEST effect is limited by the small chemical shift differences and, hence, relatively low exchange rates required to stay within slow-to-intermediate regime. In early 2000, exogenous paramagnetic lanthanide (III) complexes that exhibit large hyperfine shifts (on the order of 50-700ppm) were introduced as CEST agents: paraCEST agents [5, 7, 35, 36], Figure 2,b. The highly shifted bound water protons or the ligand’s amide or hydroxyl protons can be selectively pre-saturated, and the saturation can then be transferred to free water via chemical exchange. There are a number of potential advantages of these agents compared to diaCEST. They exhibit a wide range of exchange rates (from μsec to msec) while remaining in the slow-to-intermediate exchange regime on the NMR time scale [20, 21, 23, 36-38]. The fast exchange rates should theoretically allow detection of much lower concentrations of paraCEST agents in comparison with diaCEST. In addition, the selective RF pulse is applied far from the free water resonance frequency, which reduces direct RF saturation and magnetization transfer effects. It may be possible to design paraCEST agents that report important biological indices, such as pH [5, 6], temperature [39], lactate [7] or glucose concentration [9], enzyme activity [40, 41] or design agents suitable for cell-labeling [42]. The potential advantages of these agents, as compared with Gd-based T1 agents, include the ability to be switched “on” and “off” at the operator’s discretion, and thus acquire images with contrast based on other mechanisms in the same scan session. Nevertheless, effective RF saturation of the rapidly exchanging protons or water molecules may require RF intensities that exceed the FDA guidelines for power deposition (quantified in terms of ‘specific absorption rate’, or SAR). The SAR limit is a complex function of RF coil design, patient weight and the particular imaging sequence employed. In addition, the frequency position of the bound water peak in the paraCEST complexes is very sensitive to the temperature and might shift in-vivo. For a comprehensive review of paraCEST agents please see for example a number of excellent manuscripts by Sherry and co-workers [19, 20] and Aime and co-workers [22, 23, 43].
As was already mentioned earlier, one route to increasing the magnitude of the CEST effect is to increase the number of the exchanging sites. Hence, a number of creative macromolecular and supramolecular systems have been explored as CEST agents [10, 22, 30, 43-45]. A very interesting route to generate CEST is via the use of liposomes – lipoCEST, introduced by Aime and co-workers [46]. In lipoCEST the resonance frequency of the water trapped inside a liposome is shifted to a frequency that differs from the external water by a paramagnetic shift agent also entrapped inside a liposome (Figure 2,c). Additional chemical shift variation can be achieved by modulating the liposomal shape [47]. In lipoCEST the intra-liposomal water resonance is saturated and the transfer of those saturated spins is achieved via water exchange between compartments. Due to size of the liposomes and the very large number of the exchanging water molecules that can be trapped in the intra-liposomal compartment, very high sensitivities can be achieved, enabling the detection of the lipoCEST nanoparticles in picoMolar range. For a comprehensive review of macromolecular, supramolecular, and nanomolecular agents please see for example number of excellent manuscripts by Aime et.al. [22, 23, 43].
Finally, the CEST principles have been used in conjunction with hyperpolarized Xe biosensors: hyperCEST [48], Figure 2,d. Here, a biosensor possesses a molecular cage that is functionalized to bind to a specific target. Only about 1% of the dissolved Xe is associated with the biosensor, making it impossible to be detected via usual routes. At the same time, the cage-encapsulated Xe possesses a chemical shift distinct from that of free Xe and the two moieties (free and encapsulated) engage in chemical exchange. The exchange dynamics is on the order of tens of milliseconds and the chemical shift difference is on the order of tens of ppm, thus making it an ideal system for CEST.
B0 and B1 inhomogeneities
The effectiveness of spin saturation depends upon an ability to irradiate at the specific proton frequency. Given that the magnetic field across any object placed inside a magnet is not completely homogeneous across that object, small differences in B0 experienced by a class of CEST agent or by tissue water molecules introduce uncertainties into the experiment by slightly shifting all resonances in the Z-spectrum. Moreover, in the imaging experiments conducted in-vivo there is often a distribution of the B0 and B1 values across an image. Hence, pixel-by-pixel assessment of a CEST effect is required. B1 inhomogeneities can also result in insufficient saturation of the exchanging pool. Sun et.al. [49] studied the dependence of the CEST effect on B1 and B0 homogeneities and have shown for diaCEST agents, the B0 homogeneities play a more crucial role than inhomogeneities in B1, provided that B1 homogeneity is good enough for uniform saturation. The B0 inhomogeneities are less problematic for paraCEST, because of the larger chemical shift differences and higher RF power used.
B0 correction methods work by identifying the correct B0 (frequency) value and shifting the spectrum to align with them. This implies that more than 3 experiments (expected from Eq.1) are needed to measure MTRasym. Often the entire Z-spectrum, or at least parts of it is acquired. Overall, three methods could be distinguished for B0 correction. Often they are applied on the pixel-by-pixel basis. First method relies on acquisition of Z-spectrum, interpolation, minimum identification and re-aligning the zero frequency with the minimum [4, 50]. However, this method could fail in tissues with short T2, where the Z-spectrum could very broad. Another method is to acquire independent B0 map and shift the Z-spectra accordingly [49]. This method is widely used, although care must be taken to ensure against phase-wrapping artifacts. Last, but not least, WASSR method (WAter Saturation Shift Referencing) relies on the acquisition of a narrow-range, low power, Z-spectrum around water frequency and identification of its minimum [51], thus identifying the correct position for the water frequency.
III. CEST is a member of the Saturation Transfer family
Basic Principles
CEST is a family member of a much broader group of NMR experiments known as saturation transfer (ST). The simplest, two-pool model for ST was already illustrated for CEST, but is equally applicable to other ST experiments. The model contains a larger pool, A, and a smaller pool B (Figure 1). Spins in pools A and B are different either due to different chemical environment (as in CEST), different nuclei, or even an electron spin interacting with a nuclear spin. In a ST experiment, the changes in magnetization of pool A are observed upon irradiation (saturation) of pool B. In the simplest description of the system, which we will adopt here, there are no scalar couplings between the two pools and no coherent interactions, and the system can be described by the (modified) Bloch equations. The saturation transfer experiment is one of the oldest NMR experiments. Overhauser was the first to propose saturation of the electron line to modulate nuclei relaxation and magnetization [52]. It was quickly realized that the ST experiment is equally applicable to experiments involving nuclei only [53], receiving the name Nuclear Overahuser Effect (NOE).
Broadly speaking, ST can occur via two types of interactions, dipolar mediated cross-relaxation through space and chemical exchange. In the case of cross-relaxation, the dynamics are traditionally described using the Solomon equations [53], which are a set of Bloch equations with a terms describing magnetization exchange. The case of saturation transfer via chemical exchange, involving real molecular rearrangement, was first described by Forsen and Hoffman [54, 55]. Again, the dynamics can be described by a set of Bloch equations modified for exchange (Bloch-McConnel equations [56]) and the presence of RF. Whether the transfer occurs via cross relaxation or via exchange, the overall equations governing the process are essentially identical, and the chemical exchange can be viewed in complete analogy to cross relaxation [55]. Indeed, quoting Hoffman and Forsen: “...Both the modified Bloch equations of Solomon and those of McConnel are a set of coupled differential equations, in which the coupling arises from the existence of a probability per unit time for magnetization at one site to be transferred to another site” [55]. Explicitly, the equations for the two-pool model can be written:
| (2) |
where:
and, for exchange [54]:
for cross-relaxation [57, 58]:
In these equations, ωRF and ω1 are the frequency, and amplitude of the RF irradiation (in rad/s units), respectively; ΔA is the chemical shift offset from RF frequency for pool A, R1A (=1/T1A) is the spin lattice relaxation rate of pool A; R2A(=1/T2A) is the transverse relaxation rate of pool A; kAB is the transition rate of a magnetization leaving pool A. In the case of chemical exchange, it is equal to the inverse of the time a proton spends at pool A: kAB =1/τAB. Alternately, kAB corresponds to either σAB or μAB, longitunal or transverse cross relaxation rate, respectively (notice the sign difference here from the classical definition of cross relaxation by Solomon [53]). In many cases the non-secular terms in the relaxation matrix can be neglected and hence the corresponding transverse cross relaxation rates [59]. Similar definitions apply to pool B. Without the loss of generality, it was assumed that the RF is applied along x. Here we assume an equilibrium state, where there is no net exchange of magnetization, and the detailed balance relationships apply:
| (3) |
The magnetization exchange is characterized by the rate kex=kAB+kBA (or kex=σAB+σBA) that can be viewed as the strength of interaction between the two pools. Higher kex signifies faster “information” exchange.
Thus, as long as we are not discussing the origin of the interaction in terms of specific operators and spectral density functions, Eq.2 is equally applicable to cross relaxation or chemical exchange. The rest of this article will mostly focus on the subject of chemical exchange. However, it is important to keep in mind the similarities of the processes. We will return to the cross-relaxation manifestations in the later sections.
Transient vs Steady-State experiments
Two types of saturation-transfer experiments should be distinguished: steady-state vs transient. The steady-state experiments refer to the state in which the system does not change further and the state is time independent, i.e., the derivatives in Eq.2 are all zero. The transient experiment refers to the case when the system is still changing, and the explicit time dependence cannot be ignored. The general scheme of saturation transfer experiments is shown in Figure 3, a. The RF saturation is characterized by its total duration (Ts), amplitude (B1=ω1/2π), and off-resonance frequency (ΔRF). However, the RF train employed for saturation is not limited to CW. Indeed, due to hardware and SAR limitations, many of the imaging applications employ the so-called pulsed version, replacing the CW RF with a train of shaped RF pulses, such as Gauss or Half-Sinc, sometimes interleaved with delays and crusher gradients. This does not change the fundamental physics of the experiment, but greatly complicates analytical and semi-analytical descriptions of the dynamics as well as quantitative analysis of the results. Moreover, pulsed versions introduce additional degrees of freedom in experiment optimization [60].
Figure 3.

Schematics of Saturation Transfer experiments. Grey boxes indicate RF irradiation blocks, white boxes indicate acquisition blocks (ACQ, spectroscopy or imaging). Dotted lines mark repetition time (TR) that includes saturation time, acquisition time and relaxation delay before saturation. (a) Steady-state ST experiment, in which the duration of the saturation (Ts) is much longer than T1: Ts,TR>>T1 (b) Segmented steady-state experiment. In this experiment, TR<T1, and the whole experiment is repeated many times thus reaching a steady-state around experiment number n, such that n TR>>T1. (c) Transient experiment in which Ts<T1. In contrast to (b), here TR>>T1. Thus, if the experiment is repeated again there is no memory of the previous experiment and no steady-state is created.
Steady-state solution assuming complete saturation of pool B.
Generally, the steady-state condition greatly simplifies the description of the system dynamics. For example, if in addition to the steady-state assumption we assume complete saturation of pool B, i.e. and no direct influence of the irradiation on pool A (no spill-over effect), we arrive at the following solution for the magnetization of the pool A [54]:
| (4) |
This equation can be re-arranged in terms of the agent (exchanging group) concentration and pool B lifetime:
| (5) |
From Eq.5, the CEST effect can be increased by either increasing the agent concentration, or decreasing the lifetime (increasing the exchange rate),
Experimentally, the simplest way to achieve the steady-state is to irradiate longer than ~5*T1A, i.e., the saturation time, Ts>>T1A (Figure 3,a) However, the irradiation does not have to be continuous. In many applications, and particularly in imaging, a situation may rise when the experiment is repeated with the repetition time, TR, shorter than T1, as shown schematically in Figure 3,b. In this case, a steady-state can also be established, albeit different (and more complicated) from the simple case described in the previous paragraph. For example, this was recently explored by Dixon et.al., in the context of efficient PARACEST detection [61]. It should be also noted that the steady-state condition does not imply complete saturation of pool B.
Transient-state solution
If the steady-state assumption is not applicable (Figure 3,c), the transient solution is needed, which is more complicated. However, when appropriate assumptions are made the solution is possible. Indeed, assuming complete saturation of pool B and no saturation of pool A the transient state solution for is given by [54]:
| (6) |
Approximate solutions exist describing more complicated situations. For example, recently, a solution was developed in the context of CEST, incorporating non-complete saturation of pool B and assuming no spillover effects on pool A[62, 63]:
| (7) |
where α is the saturation efficiency, representing the degree of saturation for pool B and PTR ≡ CEST effect. The equation for α is valid in slow exchange only, the desirable, but not always met condition for CEST. The equality on the left holds as long as the only mechanism contributing to the asymmetry of the Z-spectra is CEST, an assumption which is not valid in-vivo. It could be easily seen that Eq.6 is equivalent to Eq.7 under the assumption of a small pool B concentration (ρ1A~R1A) and complete saturation of pool B (α=1).
CEST vs Off-Resonance spin-lock (T1ρ)
The RF irradiation employed in the ST experiment generates an effective field at an angle θ, depending on the off-resonance value. The schematic of the effective fields for pools A and B are shown in Figure 4,a. The initial magnetization is also schematically shown (Figure 4,b). The magnetization could be aligned with the effective field and locked, thus making it an off-resonance spin-lock experiment. Two cases of spin-lock experiments should be distinguished here: (i) B1 is higher than chemical shift difference (ΔAB<ω1), thus influencing both pools to the same degree; (ii) B1 is lower than the chemical shift difference (ΔAB>ω1). Here we only consider the second case (common situation for the off-resonance spin-lock experiments). ST (or CEST) and off-resonance spin-lock only differ in the initial state of the magnetization, which is aligned with the effective field in the case of spin-lock, or Z axis in the case of ST. In addition, the majority of spin-lock experiments are transient, often performed at multiple Ts to derive relaxation times parallel or perpendicular to the effective field (i.e. T1ρ or T2ρ). However, overall the equations governing the dynamics are identical for both experiments (Eq.2), leading to the same eigenvalues (effective rate constants) and to the same steady-state values for Ts>>T1. Figure 4 illustrates the effective fields as well as the experimental schemes and magnetization dynamics for both experiments.
Figure 4.

Comparison between saturation transfer (ST) and spin lock (SL) experiments. (a) Schematic of the effective fields generated during application of a RF field with intensity ω1 at off-resonance ΔA from pool A resonance and ΔB=ΔA-ΔCS from pool B resonance. In both cases an effective field is generated with the magnitude . The field is inclined at the angle θA,B = arg tan(ΔA,B/ω1) from the Z-axis. (b) Schematic depiction of the initial magnetization of pool A in the case of saturation transfer experiment (, gray solid arrow) and spin-lock experiment (, white arrow). (c) Schematic depiction of the steady-state magnetization for both ST and SL experiments (black arrow). Both experiments result in the same steady-state magnetization. (e) Top: schematic of the ST experiment. Bottom: Magnetization behavior for the ST experiment (black, dotted gray and gray lines correspond to , and , respectively). Behavior of magnetization at the initial time in the ST (CEST) experiment is shown in the zoomed-out areas to the left of the plot. The transient oscillations are due to miss-alignment between the initial magnetization and the effective field. The oscillations decay away quickly due to strong contribution from T2 (or T2*) and are not observed in samples with short T2 or even moderately inhomogenous B0 or B1. (f) Top: schematic of the SL experiment. The only difference from the ST experiment is the addition of two flip pulses aligning magnetization with the effective field at the beginning of saturation (θy) and with the z-axis at the end of saturation (-θy). Due to these pulses the magnetization is aligned with the effective field and transient oscillations are not observed in the SL experiment. In simulation, parameters typical for a paraCEST agent solution were used: (100mM), T1A = 2.78 sec, T2A=0.75 sec, T1B=T2B=0.4 sec, τB=30 μsec, ΔAB=19 kHz, ω1/2π=1.6 kHz.
The off-resonance spin-lock experiments are applied widely for the studies of protein structure [64]. Since the eigenvalues are the same the solution for the effective time constants developed could also be used for CEST. For instance, Trott and Palmer derived an expression for R1ρ in the case of slow exchange and an asymmetric population limit . The same expression is applicable to the time rate governing CEST experiment, assuming that the off-resonance value is relatively far from resonance and the time constant perpendicular to the effective field could be ignored [64]:
| (8) |
Indeed, T1ρ and CEST were compared in the recent study [65], where it was found that the on-resonance T1ρ experiment is more sensitive to the intermediate exchange regime, while CEST and off-resonance T1ρ are more applicable in the slow exchange regime. The analogous nature of CEST and off-resonance T1ρ was explored to generate positive CEST contrast [66]. An experiment combining CEST and T1ρ was proposed (CESTrho) offering improved sensitivity in the intermediate exchange regime and decreased sensitivity to exchange rates [67].
IV. Saturation Transfer in Tissue
The saturation transfer experiments have long been applied to the studies of small molecules and proteins [57]. Over the years it has found its way to the experiments in tissue and, subsequently, to in vivo imaging experiments. In tissue, the saturation transfer pathways are complex, often involving both chemical exchange and cross-relaxation simultaneously or sequentially, and, due to the analogues nature of the exchange pathways (as discussed earlier), it is often impossible to separate them [24, 68]. In somewhat oversimplified terms, we will differentiate three groups of pathways, based on the features explored in the following imaging experiments: MT, CEST and NOE. The term MT will incorporate the ST experiment between systems with short T2 (e.g. semi-solid structures, macromolecules) and water, through complex mechanisms evolving cross-relaxation [24] and chemical exchange [68]. CEST, as described in detail above, refers to the ST between systems with long T2 (e.g. mobile structures, protein side chains and small peptides) and water, via slow chemical exchange. The NOE imaging experiment, introduced recently and not to be confused with the original NOE experiment, encompasses ST between systems with long T2 and water through cross-relaxation and/or delayed transfer through exchange [17].
Magnetization Transfer
The MT approach was probably the first ST imaging experiment that gained popularity and reached clinical applications. This approach focuses on the detection of very slow, semi-solid components, such as macromolecules. The strong residual dipolar interaction in these molecules leads to a very broad Z-spectrum, on the order of tens of kHz, as illustrated in Figure 5. In a non-quantitative MT experiment, the RF irradiation is typically applied far from water resonance (~2000-3000Hz) to saturate the broad macromolecular component. The saturation is transferred to bulk water via complicated pathways, details of which are still under investigation [68] but thought to be a combination of cross-relaxation aided by chemical exchange, spin diffusion, and combinations of thereof. MT is widely used in clinical applications, including (but not limited to) brain studies, muscle pathology, cartilage evaluation as well as background suppression and angiography [2]. Typically, non-quantitative MT is characterized by the magnetization transfer ratio, defined similar to Eq. (1):
Figure 5.

Influence of MT in CEST experiments. (a,d) Simulated Z-spectra and MTRasym using two-pool model (solute and solvent, black) and three-pool model (solute (pool A), solvent (pool B) and MT pool (C), gray). A typical diaCEST and paraCEST agents are shown in (a) and (d), respectively. DIACEST model parameters in (a) were: , , T1A=2.5 sec, T2A=48 msec, T1B =T2B=1 sec, T1C=1 sec, T2C=15 μsec, τBA=48 msec, τCA=35 msec, ΔCS =3.5 ppm, ΔMT=0 ppm (off-resonance value of the MT pool), B0=3T (based on Refs. [107] and [79]), with Ts=5 sec, ω1/2π=84 Hz. PARACEST model parameters in (d) were: , , T1A=2.5 sec, T2A=0.75 sec, T1B =T2B=T1C=0.1 sec, T2C=10 μsec, τB=250 sec, τc=20s msec, ΔCS =42 ppm, ΔMT=0 ppm, B0=7T (based on Refs. [108]), with Ts=10 sec, ω1/2π=595 Hz. In both, (a) and (b) SuperLorentzian lineshape was used for semi-solid pool simulation and CW RF shape was used for saturation. (b) Comparison of the experimental results of 3D CEST imaging in different brain regions on healthy subjects (n=5). (b-top) Z-spectra from three ROIs placed at cerebellum, cerebral WM and cerebral GM). (b-bottom) Corresponding MTRasym plots. (b) Reproduced with permission from figure 6 in Ref. [113]. (c) The Z-spectrum and MTRasym from a mouse brain tissue phantom with 7mM Eu3+-DOTAM-Gly-Phe (34 °C). Reproduced with permission from Figure 9a in Ref. [108]
Sophisticated MT Z-spectrum models and analysis methods were developed allowing the derivation of quantitative information about physiologically relevant parameters, such as semi-solid pool fraction, effective cross relaxation rate, and relaxation times [69]. Due to strong residual dipolar coupling, the Bloch equations cannot adequately describe the macromolecular MT profile. Thus, the modified Bloch equations were developed, replacing the Lorentizan line shape with a Gaussian or SuperLorentzian [69].
CEST-MT interaction
In tissue, the MT effects always accompany CEST. Figure 5a displays a simulated Z-spectrum for a model containing MT and diaCEST pools. Notice the decrease in the intensity as well as the decreased CEST effect compared with the model with no MT.
Though in quantitative MT studies, the MT profile is assumed to be symmetric around water, several studies indicate that in tissue, it is slightly asymmetric, probably due to the contribution from aliphatic protons reducing the weighted average chemical shift in tissue [70, 71]. Thus, Eq.1 is no longer valid for describing the pure CEST contribution and the effect is strongly contaminated by MT. This is why many studies using Eq.1 refer to it as MTR asymmetry (MTRasym) and not CEST. For example, in CEST studies of brain, negative MTRasym is often observed (Figure 5,b), presumably due to the underlying MT effects [4].
The CEST-MT problem is less severe, but still present for paraCEST agents. Though paraCEST agents typically have chemical shift differences much higher than the diaCEST, and can even be beyond the edges of the MT profile, the higher RF power necessary for the paraCEST effect still results in a relatively high MT effect, even at very high off-resonance frequencies, as is illustrated in Figure 5,d-c. It should be noted that recently, paraCEST agents with very high chemical shift difference were introduced, putting them outside the range of the MT profile, and thus avoiding the MT complication altogether [72].
From our earlier discussion of the similarity between exchange and cross-relaxation processes and because the MT and CEST are close relatives from the same family of experiments, it becomes apparent that it is very hard to achieve the separation between MT and CEST using a standard ST approach. Thus, the development of methods disentangling MT and CEST became one of the active topics for discussions and research. Several methods were proposed to distinguish and separate the two.
The most basic one, and the one most widely applied, is the use of zero-order approach of additive effects. In this case, the signal intensity at the off-resonance value ΔRF:
| (9) |
Where PTR is proton transfer ratio caused by CEST (i.e. the pure CEST effect), MT signal decrease due to MT and DS is the signal decrease due to direct water saturation. Using Eq.1 with ΔRF = ΔCS or ΔRF = −ΔCS, assuming symmetrical DS and noting that PTR(−ΔRF) the MTRsym:
| (10) |
The is the underlying MT profile asymmetry caused by other factors than CEST. Though imperfect, this approach is commonly used. Of course, a-priori information is required about in order to derive PTR from Eq.11. Often at least two physiological perturbations are compared, where it is possible to assume unchanging and changing PTR, and this change (ΔPTR) is detected [4, 17].
Several approaches are trying to truly “decouple” MT effects from CEST. For example, LOVARS introduced by Song, et.al. is based on different phase modulation patterns induced in CEST and MT pools via saturation with different length and offset [73]. Another approach, introduced by Liu, et.al., is based on histogram analysis of the MTR ratios [74].
Quantitative Z-spectrum fitting and analysis based on multi-pool models including MT (thus separating CEST from MT) have been discussed, but to the best of our knowledge, their in-vivo application has been limited to a paraCEST agent under very specific circumstances [13, 50].
A different set of approaches to disentangle CEST and MT, based on the alternative CEST detection schemes, will be described later in the text.
Lipid Artifacts
It was realized early on that in addition to inherent MT effects and asymmetry complicating CEST experiments, there are often dips in the Z-spectrum on the negative side of the water line, in the aliphatic region where there are no identifiable chemically exchanging sites. For instance, these artifacts were observed in brain studies. Since the brain lipid concentration is very low, the main source of these dips is image contamination from direct saturation of lipids in the skull (the so-called lipid artifacts [75]). The lipid artifact complicates CEST analysis, since the lipid resonance lines are at −3.5ppm from water, exactly symmetrical to the amide protons. Methods of reducing the artifact were introduced using various methods including frequency-selective refocusing pulses [75] and pre-saturation [15].
Nuclear Overhauser Effect
However, not all dips appearing at the negative side of water line are artifacts. Not only lipids, but also other molecules containing –CH and –CH2 groups can contribute to ST via cross relaxation, exchange relayed transfer or some combination of the above. Jerschow and co-workers were the first to observe additional peaks in the Z-spectrum of cartilage, at −1ppm and −2.6ppm[15]. From that study the name NOE started to be used to identify ST from mobile groups with long T2 and chemical shift in approximately −1 to −4 ppm range (not to be confused with the original NOE). The effects were also observed recently in human and animal brain studies at high field [76, 77]. The exact NOE mechanism is complicated, tissue dependent, and contains contributions from exchange relayed transfer and cross-relaxation. While there are similarities between MT and NOE, there are several differences. One of the main differences is the T2 values: relatively long for NOE (transfer from mobile proteins) and short for MT (transfer from semi-solid molecular pool). In addition, the exchange relayed NOE probably plays more important role in transfer from mobile proteins, than from the semi-solid pool [68, 78], though exact process, as well as proportions of various contributions are still under study.
The NOE could be a source of nuisance, since it interferes with any CEST estimation using Eq.1. At the same time, there could be a potential for the NOE to provide some additional useful information [76].
Of course, in tissue all ST mechanisms: MT, CEST and NOE appear simultaneously. This is illustrated in Figure 6 in examples from cartilage and mouse brain. Note that high field strengths (7T, 9.4T and 11.7T) and low-power steady-state conditions are helpful to enhance the NOE dips in the Z-spectra that could have been unobservable at the lower fields [15, 76, 77].
Figure 6.

Experimental observations of multiple ST in tissue: MT, CEST and NOE. (a) Z-spectrum of bovine cartilage ex-vivo at 11.7T. From Figure 1c in Ref.[15]. (b) The average Z-spectrum obtained in cortex, corpus callosum (CC) and cerebrospinal fluid (CSF) ROIs (n=6). Here, in addition to “standard” amide line at 3.5 ppm (blue arrow) additional CEST site was identified at 2ppm from water (yellow arrow), as well as NOE site around -4ppm. Reproduced with permission, from Figure 2a, in Ref.[76].
V. Endogenous DIACEST agents and applications
Endogenous CEST relies on exchanging groups and molecules already present in the tissue. These “agents” do not require any additional injections or FDA approvals. Not surprisingly, the majority of the in-vivo applications to date involve endogenous CEST. Also, it is very likely that these methods will have an impact on the clinical MRI in the near future.
There is a growing number of the endogenous CEST applications aimed at detection of different metabolites or environments: glycoCEST for the glycogen detection [8], gagCEST for the glycosaminoglicans detection [15], gluCEST for glutamate [27] and Amide Proton Transfer (APT) for the pH and tumor imaging [4, 26]. These methods are summarized in Table 1. As many of the proposed methods target the same exchanging groups, it probably would have been appropriate to use a different nomenclature, based on the type of the exchanging group: OH-CEST, NH-CEST and NH2-CEST. However, in the following discussion, we will adhere to the accepted names and conventions and we will briefly describe some of the applications. The selection is not all encompassing and predominantly focuses on the CEST techniques that could become standard clinical protocols in the near future.
Table 1. Examples of endogenous diaCEST contrast, exchanging groups, off-resonance values and exchange rates. The exchange rates are approximate and may strongly depend on physiological conditions such as pH and temperature.
| Name | Target | Exchanging group |
Off-resonance | Exchange Rate |
|---|---|---|---|---|
| APT | Intracellular proteins pH (brain) |
-CONH2 | 3.5 ppm | 10-200 sec−1 |
| glycoCEST | Glycogen (liver, muscle) |
-OH | 0.5-1.5 ppm | >103 sec−1 |
| gagCEST | Glycosaminoglican (cartilage) |
-OH -NH |
0.9-1.9* ppm 3.2 ppm |
>103 sec−1 10-30 sec−1 |
| gluCEST | Glutamate (brain) |
-NH2 | 3 ppm | 5500 sec−1 |
Approximately 0.5-1.5ppm reported tor IVD
Amide Proton Transfer (APT)
Probably the most developed technique to-date, APT imaging, introduced in 2003 by Zhou and co-workers, focuses on the detection of exchangeable amide protons of mobile tissue proteins and peptides[4]. The maximum APT effect is observed at 3.5ppm from water; however, it is likely that a number of the exchangeable groups in the range of 1 to 6ppm contribute to the effect. APT was the first technique to find its way to human imaging.
The APT effect strongly correlates with pH because proton exchange in –NH groups slows dramatically with decreasing pH. Many studies reported applying APT imaging to study ischemia in animal models [4, 14, 79]. Recently a human stroke study was reported by Zhao and co-workers[80]. An image from the patient study demonstrating hypo-intense region correlating with the stroke-effected areas is shown in Figure 7 (a-b).
Figure 7.

APT imaging. Conventional (a) and APT (b) MR images of a patient with stroke 5 days postonset. The stroke (open arrow) is hypointense on the APT images. The hyperintense signal in the basal ganglia region (black arrow) contralateral to ischemia on the APT image (b) is an artifact. Conventional (c) and APT (d) MR images of a patient with lung cancer metastasis. The tumor (solid arrow) is hyperintense. Reproduced with permission from Figure 5 (g-h) in Ref.[80].
A calibration formula was derived connecting the amide PTR (APTR, eq.7) with pH [4]:
| (11) |
The formula was derived using phosphorus spectroscopy to determine intracellular pH values. Alternatively, quantification methods could be applied to establish a relationship between the APTR and pH, such as, for example, QUEST or QUESP methods [63]. In these methods, pH is deduced from exchange rates derived using a numerical fit of experimental CEST dependence on RF intensity (QUESP) or time (QUEST). In in vivo applications care must be taken isolating APT from MT, as discussed in the previous section.
Another exciting application of APT is for tumor studies. An example of a patient study is shown in Figure 7 (c-d). The important difference can be observed between the MTRasym in ischemic (Figure 7, b) vs malignant (Figure 7,d) tissue; while MTRasym decreases during ischemia, it increases in tumors. An explanation for this difference is based on the suggestion that different mechanisms can contribute to APT changes [26]. In acute ischemia, the proton content remains constant, while the brain pH decreases [4], thus decreasing the exchange rate and the CEST effect (eq.4-6). In tumors, the intracellular exchangeable proton content increases, while the intracellular pH remains approximately unchanged, thus leading to an increased CEST effect (eq.4-6).
A human brain tumor study using APT conducted by C. Jones et.al. indicated that APT could provide complementary information to standard imaging protocols by providing better identification of tumor boundaries [12]. In addition, a recent study by J.Zhou et.al., indicated that APT imaging may provide differentiation between glioma and radiation necrosis, and could serve as a predictor of tumor response to therapy [28]. No other imaging method can currently achieve this.
gagCEST
Glycosaminoglycan (GAG) is one of the main constituents of cartilaginous tissue. It is known that many cartilage diseases, such as osteoarthritis and intervertebral disc degeneration, are characterized by the deterioration of the cartilage collagen network with simultaneous degradation and depletion of GAG. The gagCEST method was introduced in 2008 by Jerschow and co-workers [15]. It focuses on the detection of ST from hydroxyl protons, resonating at 0.9-1.9ppm downfield from water. MRI has been targeting cartilage for years, with sequences such as quantitiative T2, delayed gadolinium enhancement (dGEMRIC), T1ρ mapping and Sodium imaging. If gagCEST will provide sensitive and specific information on GAG it could become a powerful method for detection, evaluation, and studies of cartilaginous tissue, such as intervertebral discs (IVD) or articular cartilage.
Ex vivo studies of excised bovine articular cartilage and IVDs have shown that gagCEST decreases with degeneration [15, 81]. The technique was applied in vivo for articular cartilage [15, 82, 83] and IVD in humans [84]. Figure 8,b shows an example of gagCEST map of a human IVD acquired at 3T. The CEST effect of up to 10% was reported [84]. Recent studies correlating gagCEST with degeneration in vivo have reported decrease of gagCEST with increase of IVD degeneration as assessed by the standard clinical grading using T2 weighted imaging [85, 86].
Figure 8.

(a-b) gagCEST imaging of human IVD. Conventional (a) and zoomed gagCEST (b) images of an IVD at L5/S1of healthy 25-year old volunteer. gagCEST map shown was obtained with 0.75ppm off-resonance value. Reproduced with permission from Figure 4 in Ref.[84]. (c-d) glycoCEST imaging of human calf muscle. Z-spectrum with MTRasym is shown in (c) with inlaid anatomical image. (d) glycoCEST map obtained using 1ppm off-resonance value. Reproduced from Figure 6 in Ref.[51].
At 3T field strength, the gagCEST effect in normal articular cartilage in-vivo was shown to be low, around 2% [82, 83]. There are several complicating factors contributing to this low effect. The main reason is associated with the small chemical shift difference between the water and the exchanging group, putting the system in the intermediate to fast exchange regime at 3T: a maximum CEST is observed around 1.2ppm, i.e., about 150Hz chemical shift difference, with an estimated exchange rate of 103 sec−1 in solution (probably slower in tissue). Second, direct water saturation is high, again, due to the small chemical shift difference. Third, MT from the collagen results in a very broad Z-spectrum, substantially broader than the one observed in brain, or even in the discs nucleus pulposes. Last, the NOE effect upfield of water decreases CEST and can make it negative for some RF power levels. In general, the presence of NOE almost exactly symmetrical around water greatly complicates any analysis of the data. At the same time, a recent study conducted at 7T has shown a remarkable increase in the articular cartilage CEST, and values of up to 6% were reported [83, 87]. The likely explanation for this increase in signal is two-fold; there would be less off-resonance saturation of water at 7T and also there should be slightly more favorable exchange regime at 7T (with a chemical shift difference increasing from ~150 Hz to ~360 Hz).
It should be emphasized that the CEST-MT interaction is especially acute for cartilaginous tissue, since the MT effect is quite strong in that tissue. Thus, additional investigations are required to establish whether the gagCEST method is indeed specific to changes associated with GAG only and not influenced by the changes in the surrounding collagen matrix.
glycoCEST
glycoCEST method, aimed at the detection of glycogen targets the exchanging hydroxyl protons of glycogen with the chemical shift difference of 1ppm from water. Glycogen is the primary storage form of glucose in mammalian tissues. Abnormalities of glycogen metabolism and content are associated with an array of disorders, including obesity, type 2 diabetes and insulin resistance. MRI has been targeting glycogen detection for years predominantly using C13 spectroscopy [8], although detection using proton spectroscopy has also been reported.
glycoCEST was demonstrated in 2007, by van Zijl and co-workers [8]. The effect was shown in the perfused liver ex vivo. It was shown that the glycoCEST signal decreases during perfusion with glucagon which initiates breakdown of glycogen and export of glucose. GlycoCEST effect is also observed in-vivo in human calf muscle (Figure 8, c-d) and in the back muscles during IVD studies [51, 84]. In calf muscle glycoCEST effects on the order of 3-7% were observed. To the best of our knowledge, no human in vivo glycoCEST was reported in liver. In vivo liver studies are generally complicated by motion, T2 effects and, possibly, lipid contamination.
Notice, that the chemical shift associated with glycoCEST and gagCEST are in the same range, as they target the same exchanging group. Again, the CEST method is not selective for the molecule per se, but for a specific type of proton exchange. Thus, additional information, assumptions or analysis are needed in order to differentiate between different metabolites. In the case of gagCEST vs glycoCEST the solution is straightforward, because there is no glycogen in cartilage and no GAG in liver (one of the main target tissues for monitoring glycoCEST). At the same time, care must be taken about muscle. It could be assumed that the glycogen contributes majority of the signal. However, other metabolites, such as creatine cannot yet be excluded.
VI. Detection Methods
Off-Resonance methods
So far we have focused on the classical scheme for CEST, to which we shall refer to as the off-resonance method. However, over the years several alternative methods have been introduced. These will be briefly reviewed below.
On-Resonance Method
Applying RF irradiation on-resonance with the exchanging group (off-resonance from water) is not the only method to detect exchange. For instance, the on-resonance spin-lock experiment is also used to detect exchanging species. It could be viewed as an “on-resonance” version of the experiment.
Another on-resonance method, introduced in 2005, and called OPARACHEE (On-resonance PARamangnetic Chemical Exchange Effects) involves application of a 360° RF pulse on-resonance with water. The idea is that the non-exchanging magnetization will regain its magnitude at the end of the pulse, while exchanging protons will cause signal decay. To compensate for B0 and B1 homogeneities a modified WALTZ-16* pulse train was employed, with the 90 degree of the standard WALTZ-16 sequence replaced by a fixed-length pulse of 2.5msec [88]. The RF intensity and pulse length was optimized for paraCEST, but could, in principle be optimized for diaCEST. One of the advantages of this approach that it avoids application of high power saturation necessary for the complete saturation of the paraCEST exchanging group. Thus, it can detect very low agent concentrations without significant RF deposition. In addition, the exact position of the exchanging group does not need to be known a-priori, a particular advantage for paraCEST agents wherein the chemical shift could change with changes in local temperature or chemical environment. At the same time, the sequence results in substantial signal reduction due to MT effects and direct saturation. In addition, the sequence cannot be used with multiple paraCEST agents, as it lacks the selectivity of the off-resonance approach.
Despite its drawbacks the sequence was successfully applied in several in vivo paraCEST studies [89-91]. An example of OPARACHEE detection of a paraCEST agent in mouse kidney in vivo is shown in Figure 9,a.
Figure 9.

Alternative detection of exchange. (a) In-vivo kidney perfusion study using OPARACHEE. Schematic of the OPARACHEE scheme is shown at the top. The images (zoomed in on the area marked on the anatomical image in the upper left corner) are acquired before and after a bolus injection of 20mM TmDOTAMGly. The hypointensity is observed when the agent reaches the kidneys, and the intensity returns to pre-injection levels as the agent clears out. Reproduced with permission from figure 3 in Ref.[89]. (b) Phantom study demonstrating pCEST vs CEST in various concentration solutions of EuDOTAGly4−, as marked at the low left corner image. While standard CEST images are hypointense when the RF is applied on-resonance with the exchanging pool, pCEST images display suppressed background when RF is off-resonance and are hyperintense when the RF is on-resonance. Schematic of pCEST method is displayed at the top of (b). Reproduced with permission from Figure 5, in Ref.[66]. (c) FLEX sequence applied in a phantom, containing 10mM EuDOTAGly4− and 4% agarose in tris buffer. Top: Flex pulse sequence diagram. Middle: conventional Z-spectrum (black) and MTRasym (red). Bottom: FLEX spectrum. Reproduced from Figure 3 in Ref.[93].
Positive CEST
The standard CEST contrast is negative, i.e., the water proton signal decreases in tissue areas of interest. Typical changes in intensity that must be detected are small, on the order of 5%. When such small signal changes must be detected, background noise and background artifacts can strongly influence the observed effect. The suppression of background signal in CEST studies could allow better utilization of the dynamic range to collect only a “useful” signal, i.e., the small signal originating from the contrast agent of interest, and would minimize background artifacts. Since CEST contrast is negative, it cannot be detected if the overall signal is suppressed. Thus, positive CEST contrast is essential to employ simultaneous background suppression. Such a positive CEST approach (pCEST) was introduced recently and is illustrated at Figure 9,b. The method utilizes an inversion pulse and can be viewed as a modification of the off-resonance spin-lock experiment. It uses saturation-transfer induced changes in relaxation rates to generate positive contrast.
Indeed, as is illustrated in Figure 9,b the method achieves substantial background suppression. The absolute effect sizes are smaller in pCEST than in CEST, but the pCEST sequence provides background suppression and therefore has better dynamic range. Potentially, in non-quantitative studies, if robust background suppression can be achieved, only one CEST image could be acquired, with no need for a control image. However, currently the background suppression is not ideal and the reference image is still required.
FLEX
ST is not the only way to observe exchange. Friedman et.al. [92] have introduced an alternative method based on a series of so-called label transfer modules (LTMs), in which exchangeable solute protons are selectively labeled, and subsequently transferred to water (Figure 9,c). Signal amplification occurs because fresh z-magnetization is present for the solute protons at the start of each LTM, allowing serial transfer of labeled protons to water when applying multiple modules during the preparation time, tprep Different options could be used for the labeling sequence[17]. Specifically, a 90° pulse on-resonance with the exchanging pool, could be used followed by the evolution time which allows chemical shift evolution to separate the different frequency components. Depending on tevol, a different size of magnetization component is flipped back to the z-axis by the second 90-x pulse. When performing a series of acquisitions at different evolution times, a free induction decay (FID) containing the multiple frequency components is obtained. Fourier transform and line fitting allows the separation of the different components based on frequency (chemical shift) and exchange rate (peak width), as is illustrated in Figure 9,c. The experiment brings high-resolution NMR into MRI.
The sequence was successfully applied for detection of diaCEST and paraCEST agents. Notice that MT component can be separated from CEST in this experiment [93], using time domain fitting and taking the advantage of the fast decay of the MT component. As with any fitting procedure, care must be taken here to obtain accurate fit.
Dual Saturation Methods
In a typical ST experiment the saturation is applied at a single frequency only. At the same time, any periodic irradiation with cycle τc applied at frequency ν0 will generate bands at a frequencies ν0±n/τc with complex amplitudes An depending on the particulars of the RF. Recently, irradiation patterns involving two main sidebands received increased attention from the CEST community. The reason is that such techniques could offer several benefits over standard approach, with the main benefit being potential separation of MT and CEST effects.
Narvainen, et.al.[94] studied the influence of modulated irradiation on the MT effect and exchange behavior. Two types of irradiation were investigated: Z-spectroscopy with alternative Phase Modulation (ZAPI) and Sine Modulation (ZAPISM). The first one generates saturation sidebands at frequencies ν0±n/τc, while the latter only at frequencies ±1/2τc (Figure 10,a). It was shown that changing the modulation frequency changes MT effect and can help in differentiating between different T2 components and motion regimes.
Figure 10.
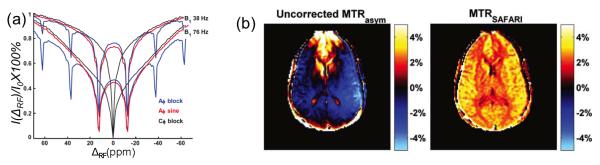
Multiple-Frequency Saturation Methods. (a) Z-spectra measured in heat-denaturated egg white at 400MHz using CW (black), alternating phase (ZAPI, blue) and sine-modulated (ZAPISM, red), for two rms RF amplitudes. Reproduced with permission from Figure 1 in Ref. [94]. (b) 3T APT imaging results in a representative human volunteer: (left) MTRasym image uncorrected for B0 homogeneities and (right) SAFARI-APT image. Reproduced with permission from Figure 5 in Ref.[97]
Lee, et.al. [95] developed a theoretical model to demonstrate that dual frequency saturation results in better suppression of a strongly-coupled spin system. The group has also shown that the asymmetry analysis of the Z-spectra generated from a dual saturation resulted in a superior separation between CEST and MT effects in phantoms [96].
Scheidegger et.al. introduced a technique called SAFARI (Saturation with Frequency Alternating RF Irradiation), that employs dual frequency saturation in combination with standard CEST saturation [97]. The SAFARI method relies on a number of assumptions and efficient image combination to successfully suppress MT asymmetry effects as well as the influence of B0 inhomogeneities. To understand the method it is important to recognize the non-linearity of the saturation process: once the exchanging pool has been completely saturated, adding more power will not increase CEST. At the same time, it is harder to saturate the macromolecular pool, which could be assumed to be not fully saturated, thus leading to an MT effect that varies (approximately) linearly with power. The SAFARI image is acquired with RF irradiation applied with equal power at the control and label frequencies: i.e. at −ΔCS and ΔCS. Originally it was achieved by alternating the frequency of the pulses in the saturation module, though a CW implementation employing cosine (or sine) modulation, similar to ZAPISM, is also possible [98]. The signal in the SAFARI image is modeled as zero-order approximation of additive effects, Eq.10. SAFARI signal is a combination of the CEST, as well as signal loss due to direct water saturation and MT from both off-resonance frequencies:
| (12) |
where I0 is the unsaturated reference signal intensity, δB0 is the B0 inhomogeneity, δMT is the center of MT asymmetry, and P represents a scaling factor proportional to the RF irradiation power. When all of the pulses applied at one frequency, RF power deposited doubles. In the SAFARI analysis, the dual frequency image is doubled and subtracted from the sum of the positive and negative frequency images resulting in:
| (13) |
The right equality is valid assuming that the CEST effect is already in the steady state (P=1), while MT pool is not at steady state, and P doubles with double power deposited. Thus, SAFARI effectively isolates CEST effect from MT asymmetry and B0 inhomogeneity.
Figure 10,b demonstrates APT-SAFARI image comparison to the APT-MTRasym uncorrected for the B0 inhomogeneities. The uncorrected MTRasym shows spatial intensity variation over the brain, corresponding to the water frequency shift. The uncorrected MTRSAFARI map shows a dramatic improvement in homogeneity. The linearity and steady-state assumptions underlying the SAFARI analysis still require additional verification and confirmation. However, the sequence offers practical advantage of robustness, a total of four or five images required, and a simplicity of analysis. These features are invaluable in the clinical environment.
Notice, that while all three techniques described above acknowledge and rely on the superior qualities of the dual (or multi) frequency saturation for the suppression and differentiation of the MT vs CEST effects, the reasoning provided for each are somewhat different. While the authors of ZAPI emphasized the importance of the modulation frequency, Lee and colleagues highlighted a superior saturation and asymmetry analysis advantage, while Scheidegger and co-workers relied on full vs partial saturation achieved in CEST and MT pools, respectively. It would be very interesting and beneficial to generate a more unified explanation of the phenomena observed and probably more techniques using multi-frequency saturation will emerge in the near future.
DQCEST
Another interesting approach is to enhance CEST by adding an intermolecular Double Quantum Coherence (iDQC) filter after the saturation [99]. This approach was shown to enhance CEST effects by almost a factor of two.
VI. Practical challenges
Though straightforward in principle, practical application of CEST in-vivo in a clinical environment faces several challenges. First, as was already discussed in Section II, B1 and B0 inhomogeneities need to be corrected for successful CEST implementation. In the following we will describe some of the additional problems, potential solutions and emerging technologies for successful translational of CEST imaging to the clinic.
SAR and Parallel Imaging Acquisition
An important challenge is associated with several aspects of RF saturation. Ideally, standard CEST should employ prolonged irradiation (long enough so that the system could reach steady-state). For diaCEST, the RF intensity required is generally low, such that the total RF deposition is within FDA dictated SAR limits. ParaCEST agents however, due to their fast exchange, may require RF deposition that exceeds SAR limits. To overcome this challenge, sequences like OPARACHEE or FLEX described above could be used. Alternatively, weaker or shorter RF pulses could be used, at the price of a smaller CEST effect.
An additional advantage could be gained from the use of Parallel Imaging (PI) MRI. Parallel MRI is an accelerated imaging technique that reduces the number of phase encoding steps required for image reconstruction. This reduction is accomplished by making use of redundant spatial encoding information obtained from arrays of surface coils. PI has become a standard part of many clinical imaging protocols, primarily to reduce acquisition times. In the context of CEST, parallel imaging can be used to manage SAR and modify image contrast in several ways. By reducing the number of phase encoding steps, one can increase the repetition time (TR) of the sequence without increasing the total acquisition time. This will lead to a reduction of average SAR, if the same presaturation RF characteristics are used. In addition, if the SAR deposition limit is kept constant and TR is increased, higher RF intensities can be used, thus possibly leading to higher CEST effects in some of the B1 limited applications. In addition, parallel imaging can be used in a standard way to reduce the total acquisition time with other parameters fixed. This may improve the temporal resolution of the CEST imaging, when multiple acquisitions are required, e.g. for better quantification or to monitor dynamic processes. However, PI reconstructions exhibit a decreased Signal-to-Noise Ratio (SNR) due to the reduced number of signal averages acquired, according to a √N rule, and an additional penalty, dependent on the specific receiver-array geometry (the g-factor). Despite these limitations, PI can be combined with CEST without penalties in Contrast-to-Noise, at least in phantoms [100].
Pulsed CEST and Parallel Transmit
One of the main challenges to practical application of CEST on the clinical scanners is achieving RF irradiation long enough to get to the maximum saturation. In contrast to the animal scanners, clinical scanners’ RF amplifiers cannot generate irradiation with a high duty cycle. Typical pulse lengths that can be achieved are around 250-500msec. Achieving longer irradiation times is often associated with a reduction of overall power available for imaging. In addition, long saturation times are often associated with significant intensity droops, again reducing the CEST effect and compromising quantifications.
Thus, pulsed approaches are commonly used on the clinical scanners, where a train of RF pulses is interleaved with crusher gradients or windows. Even then, often only relatively short saturation periods can be achieved resulting in the essentially transient experiment as described above, or low duty cycle RF is used decreasing saturation efficiency.
Several publications explore and optimize the pulsed CEST approach [60, 101]. Short TR and clever k-space acquisition could be used to overcome RF duty cycle limitations required to reach steady state [61, 102].
Exciting opportunities presented itself with the development of parallel transmit. First, parallel transmit could be used in a standard way to minimize the B1 inhomogeneity thus improving CEST. Another opportunity was recently explored by Keupp et.al [103]. In this new parallel transmit approach two amplifiers are used in the interleaved fashion to generate RF with a duty cycle close to 100%. Each amplifier is allowed to rest for sufficient time between the pulses without losing overall RF power. Thus, a long, high duty cycle, pulsed RF saturation train is generated.
Acquisition of Z-spectrum and time
More often than not, a complete Z-spectrum is acquired for CEST. One of the main reasons is that the B0 inhomogeneity changes from pixel to pixel with inter-pixel difference, often as high as 200Hz (on 3T). In addition, quantification approaches based on modeling require information from the entire Z-spectrum (and sometimes at several RF powers). The WASSR B0 correction approach also acquires many off-resonance points. Collection of the images, for both CEST and WASSR, may prove time consuming (depending on the acquisition parameters) and when applied in vivo are more likely to become susceptible to motion, or simply too long for a routine clinical scan.
Thus, speeding up the CEST acquisition is crucial for successful translation of the technique to human applications. One way is to acquire a small subset of Z-spectrum points, around the exchanging group resonance and on the reference side, covering estimated B0 shift range [104]. Another is to use sequences like SAFARI that demonstrate better robustness and require less images.
Additional way to speed up any acquisition where multiple images of the same anatomy are acquired using multi-shot sequences is to use a Key-hole approach. Originally developed for dynamic contrast enhanced MRI, it could be equally well applied to the CEST Z-spectra. In the Key-hole approach the reference image is acquired at high (desired) resolution, while the off-resonance images are acquired at lower number of phase encodes. Reconstructing images using the low resolution data as the k-space center and complementing the periphery of k-space with the information from the high resolution images should result in an improved resolution image with all of the CEST information. Several approaches were evaluated for the efficient data combination for CEST. It was found that the Generalized Series approach, where a modeling theory is applied to reconstruct the combined image, performs best for CEST. However, there is a limit to reduction in matrix size for Key-hole CEST since the minimum spatial resolution is dictated by the size of the object(s) of interest and low-resolution [10]. Further improvement in the technique might be possible by a periodic update of high frequency information, as demonstrated in techniques like block regional interpolation scheme for k-space or BRISK [12].
7T promises and challenges
High magnetic fields offer several advantages for diaCEST. Due to increased frequency separation, any direct saturation effects are decreased and the exchange regime may cross into the more favorable slow exchange. Thus, it could be anticipated that increasing field strength will increase CEST. Moreover, NOE also becomes more prominent at the 7T.
While fields higher than 3T are commonly used in animal studies, human imaging at 7T is at the frontiers of technical development. Some of the main issues are inhomognenous RF profile and high SAR deposition. RF inhomogeneity issues, largely dependent on the size of the RF coil, are particularly acute for body imaging.
Despite the challenges, several papers have reported successful human diaCEST studies: APT in brain [77, 105, 106] and glycoCEST in articular cartilage [83, 87]. Pulsed steady-state approaches (Section III) can proove especially useful at high field [77]. Brain APT imaging at 7T offers increased MTRasym effects; decreased MT effects could be achieved when using very low saturation pulses [77]. A 7T CEST study of multiple sclerosis at 7T [105] is shown in Figure 11.
Figure 11.

APT (a-e) and gagCEST (f-i) imaging at 7T. (a-e) Anatomical images and MTRasym maps from a healthy control (a,c) and an MS subject (b,d). Z-spectrum and MTRasym plots from ROIs marked at (a) and (b). Reproduced from Figure 2 in Ref. [105]. Anatomical images (f) and MTRasym map (g) of a cartilage-repair surgery patient. ROI boxes are shown in (f) corresponding to native (left) and repair tissue (right). Z-spectra (h) and MTRasym curves (i) from the ROIs analysis. Reproduced with permission from Figure 1 in Ref. [87]
As was already mentioned earlier, 7T is particularly beneficial for articular cartilage [83, 87]. Relatively small coil size helps alleviate RF inhomogeneity issues, while higher frequency separation leads to an increase in gagCEST effect, as was already mentioned earlier, in Section V. Figure 11,f-i demonstrates gagCEST in articular cartilage.
A note on quantification
Often, the detection of the presence of the agent (or an exchanging group) is not enough. The exchange rate may change as a result of particular molecular event (e.g. pH), or concentration may change as a result of physiological process. In addition, the CEST experiments are not standardized, due to variation in saturation pulses and sequences it is impossible to quantitatively compare CEST results from difference sites. Thus, quantification methods aimed at measuring agent exchange rate and concentration have been proposed.
As was already mentioned earlier, model fitting could be used to characterize exchanging system [50]. In addition to the two-pool model described in Section II, three pool models containing CEST pool, water pool and MT were proposed [107] as well as four pool models containing two exchanging CEST pools, water pool and MT pool [108]. While model fitting is useful for basic agent characterization in vitro, in its current form it is probably not feasible for the in vivo studies
One of the methods proposed is the so-called ratiometric method, which requires an agent with two exchanging groups. In those situations, a concentration-independent metric can be obtained [109]:
| (14) |
Where ΔCS1 and ΔCS2 are chemical shift values of the two exchanging groups. However, this method is not applicable to all agents.
Thus, methods relying on the CEST dependence on saturation intensity and length were developed, such as QUESP, QUEST (Section V) and QUESTRA [110]. Another method, introduced by Dixon et.al. [111], determines exchanging proton lifetime independent of concentration using the following equation:
| (13) |
Where α is a constant depending on the agent concentration, relaxation times, etc. A linear fit of data represented by I(ΔCS)/[I(−ΔCS) − I(ΔCS)] acquired with a small number of irradiation strengths results in an intercept which is the square of the proton lifetime.
Specific metabolite identification
We can anticipate that one of the topics of the extended research in the near future will be studies verifying and improving the technique specificity to a particular metabolite in vivo. For instance, gluCEST and APT operate at the two frequencies very close to each other (their difference of 0.5ppm at 3T is 64Hz), while spectral lines can be very broad. Thus unwanted saturation is present. Another example is in gagCEST: the influence of collagen on the observed gagCEST cannot be ignored. Similar questions could be asked about glycoCEST, or even about APT dependence on pH vs protein content.
Thus, the question rises, is the experiment selective enough to a specific molecule, or are we detecting complex effects proportional to some complex combination of different molecular contributions. To the best of our knowledge, today, there is no definite answer to this question.
VIII. Conclusion
Introduction of CEST generated a set of new contrast agents, endogenous and exogenous. It led to exciting developments in agent chemistry including paramagnetic compounds, liposomes, nanoparticles and hyperpolarized gases. CEST also led to introduction of new detection methods and to new research into ways to detect and employ embedded exchange and relaxation mechanisms in tissue. It is reasonable to expect that CEST soon will become standard in many clinical protocols. It is amazing how an approach rooted in basic NMR experiment is evolving, finding new applications and opening new opportunities from high resolution NMR experiments to clinical human applications.
CEST mechanism and agents: diaCEST, paraCEST, lipoCEST and hyperCEST
CEST comparison with off-resonance spin-lock
CEST – MT interaction and differentiation methods
Human in vivo applications of endogenous CEST: challenges and opportunities
Alternative detection methods: OPARACHEE, pCEST, FLEX, ZAPI, SAFARI
Footnotes
Publisher's Disclaimer: This is a PDF file of an unedited manuscript that has been accepted for publication. As a service to our customers we are providing this early version of the manuscript. The manuscript will undergo copyediting, typesetting, and review of the resulting proof before it is published in its final citable form. Please note that during the production process errors may be discovered which could affect the content, and all legal disclaimers that apply to the journal pertain.
References
- [1].Caravan P, Ellison JJ, McMurry TJ, Lauffer RB. Gadolinium(III) chelates as MRI contrast agents: structure, dynamics, and applications. Chem Rev. 1999;99:2293–2352. doi: 10.1021/cr980440x. [DOI] [PubMed] [Google Scholar]
- [2].Henkelman RM, Stanisz GJ, Graham SJ. Magnetization Transfer in MRI: a Review. NMR Biomed. 2001;14:57–64. doi: 10.1002/nbm.683. [DOI] [PubMed] [Google Scholar]
- [3].Ward K, Alertas AH, Balaban RS. A New Class of Contrast Agents for MRI Based on Proton Chemical Exchange Dependent Saturation Transfer (CEST) J Magn Reson. 2000;143:79–87. doi: 10.1006/jmre.1999.1956. [DOI] [PubMed] [Google Scholar]
- [4].Zhou J, Payen J-F, Wilson DA, Traystman RJ, van Zijl PCM. Using the amide proton signals of intracellular propteins and peptides to detect pH effects in MRI. Nature Medicine. 2003;9:1085–1090. doi: 10.1038/nm907. [DOI] [PubMed] [Google Scholar]
- [5].Aime S, Barge A, Castelli DD, Fedeli F, Mortillaro A, Nielsen FU, Terreno E. Paramagnetic lanthanide(III) complexes as pH-sensitive chemical exchange saturation transfer (CEST) contrast agents for MRI applications. Magn Reson Med. 2002;47:639–648. doi: 10.1002/mrm.10106. [DOI] [PubMed] [Google Scholar]
- [6].Aime S, Castelli DD, Terreno E. Novel pH-reporter MRI contrast agent. Angew Chem Int Edit. 2002;41:4334–4336. doi: 10.1002/1521-3773(20021115)41:22<4334::AID-ANIE4334>3.0.CO;2-1. [DOI] [PubMed] [Google Scholar]
- [7].Aime S, Castelli DD, Fedeli F, Terreno E. A paramagnetic MRI-CEST agent responsive to lactate concentration. J. Amer. Chem. Soc. 2002;124:9364–9365. doi: 10.1021/ja0264044. [DOI] [PubMed] [Google Scholar]
- [8].van Zijl PCM, Jones CK, Ren J, Malloy CR, Sherry AD. MRI Detection of Glycogen In Vivo by Using Chemical Exchange Saturation Transfer Imgaing (glycoCEST) Proc. Nat. Acad. Sci. U.S.A. 2007;104:4359–4364. doi: 10.1073/pnas.0700281104. [DOI] [PMC free article] [PubMed] [Google Scholar]
- [9].Zhang S, Trokowski R, Sherry AD. A paramagnetic CEST agent for imaging glucose by MRI. J. Amer. Chem. Soc. 2003;125:15288–15289. doi: 10.1021/ja038345f. [DOI] [PubMed] [Google Scholar]
- [10].McMahon MT, Gilad AA, DeLiso MA, Cromer Berman SM, Bulte JW, van Zijl PCM. New “Multicolorȝ Polypeptide Diamagnetic Chemical Exchange Saturation Transfer (DIACEST) Contrast Agents for MRI. Magn. Reson. Med. 2008;60:803–812. doi: 10.1002/mrm.21683. [DOI] [PMC free article] [PubMed] [Google Scholar]
- [11].Gilad AA, McMahon MT, Walczak P, Winnard PT, Jr, Raman V, van Laarhoven HWM, Skoglund CM, Bulte JWM, van Zijl PCM. Artificial Reporter Gene Providing MRI Contrast Based on Proton Exchange. Nature Biotechnology. 2007;25:217–219. doi: 10.1038/nbt1277. [DOI] [PubMed] [Google Scholar]
- [12].Jones CK, Schlosser MJ, van Zijl PCM, Pomper MG, Golay X, Zhou JY. Amide proton transfer imaging of human brain tumors at 3T. Magn Reson Med. 2006;56:585–592. doi: 10.1002/mrm.20989. [DOI] [PubMed] [Google Scholar]
- [13].Sheth VR, Yuguo L, Chen LQ, Howison C, Flask CA, Pagel MD. Measuring In Vivo Tumor pHe With CEST-FISP MRI. Magn. Reson. Med. 2012;67:760–768. doi: 10.1002/mrm.23038. [DOI] [PMC free article] [PubMed] [Google Scholar]
- [14].Sun PZ, Zhou J, Sun W, Huang J, van Zijl PCM. Detection of the Ischemic Penumbra Using pH-Weigheted MRI. J Cerebr Blood F Met. 2007;27:1129–1136. doi: 10.1038/sj.jcbfm.9600424. [DOI] [PubMed] [Google Scholar]
- [15].Ling W, Regatte RR, Navon G, Jerschow A. Assessment of Glycosaminoglycan Concnetration In Vivo by Chemical Exchange-Dependent Saturation Transfer (gagCEST) Proc. Nat. Acad. Sci. U.S.A. 2008;105:2266–2279. doi: 10.1073/pnas.0707666105. [DOI] [PMC free article] [PubMed] [Google Scholar]
- [16].Zhou J, van Zijl PCM. Chemical exchange saturation transfer imaging and spectrosopcy. Prog. Nucl. Magn. Reson. Spectrosc. 2006;48:109–136. [Google Scholar]
- [17].van Zijl PCM, Yadav NN. Chemical Exchange Saturation Transfer (CEST): What is in a Name and What Isn’t? Magn. Reson. Med. 2011;65:927–948. doi: 10.1002/mrm.22761. [DOI] [PMC free article] [PubMed] [Google Scholar]
- [18].Hancu I, Dixon TW, Woods M, Vinogradov E, Sherry AD, Lenkinski RE. CEST and PARACEST MR Contrast Agents. Acta Radiologica. 2010;51:910–923. doi: 10.3109/02841851.2010.502126. [DOI] [PMC free article] [PubMed] [Google Scholar]
- [19].Sherry AD, Woods M. Chemical Exchange Saturation Transfer Contrast Agents for Magnetic Resonance Imaging. Annual Review of Biomedical Engineering. 2008;10:391–411. doi: 10.1146/annurev.bioeng.9.060906.151929. [DOI] [PMC free article] [PubMed] [Google Scholar]
- [20].Woods M, Woessner DE, Sherry AD. Paramagnetic Lanthande Complexes as PARACEST Agents for Medical Imaging. Chem. Soc. Rev. 2006;35:500–511. doi: 10.1039/b509907m. [DOI] [PMC free article] [PubMed] [Google Scholar]
- [21].Zhang S, Merrit M, Woessner DE, Lenkinski RE, Sherry AD. PARACEST agents: modulating MRI contrast via water proton exchange. Acc. Chem. Res. 2003;36:783–790. doi: 10.1021/ar020228m. [DOI] [PubMed] [Google Scholar]
- [22].Aime S, Castelli DD, Geninatti Crich S, Gianolio E, Terreno E. Pushing the Sensitivity Envelope of Lanthanide-Based Magentic Resonance Imaging (MRI) Contrast Agents for Molecular Imagign Applications. Acc. Chem. Res. 2008;42:822–831. doi: 10.1021/ar800192p. [DOI] [PubMed] [Google Scholar]
- [23].Aime S, Geninatti Crich S, Gianolio E, Giovenzana GB, Tei L, Terreno E. High Sensitivy Lanthanide(III) Based Probes for MR-Medical Imaging. Coord. Chem. Rev. 2006;250:1562–1579. [Google Scholar]
- [24].Bryant RG. The Dynamics of Water-Protein Interactions. Annual Review of Biophysics and Biomolecular Structure. 1996;25:29–53. doi: 10.1146/annurev.bb.25.060196.000333. [DOI] [PubMed] [Google Scholar]
- [25].Wolff SD, Balaban RS. Magnetization transfer contrast (MTC) and tissue water proton relaxation in vivo. Magn Reson Med. 1989;10:135–144. doi: 10.1002/mrm.1910100113. [DOI] [PubMed] [Google Scholar]
- [26].Zhou J, Lal B, Wilson DA, Laterra J, van Zijl PCM. Amide Proton Transfer (APT) Contrast for Imaging of Brain Tumors. Magn Reson Med. 2003;50:1120–1126. doi: 10.1002/mrm.10651. [DOI] [PubMed] [Google Scholar]
- [27].Cai K, Haris M, Singh A, Kogan F, Greenberg J, Hariharan H, Detre JA, Reddy R. Magnetic Resonance Imaging of Glutamate Nature Medicine. 2012;18:302–307. doi: 10.1038/nm.2615. [DOI] [PMC free article] [PubMed] [Google Scholar]
- [28].Zhou J, Tryggestad E, Wen Z, Lal B, Zhou T, Grossman R, Wang S, Yan K, Fu D-X, Ford E, Tyler B, Blakeley J, Laterra J, van Zijl PCM. Differentiation between Glioma and Radiation Necrosis using Molecular Magnetic Resonance Imaging of Endogenous Proteins and Peptides. Nature Medicine. 2011;17:130–134. doi: 10.1038/nm.2268. [DOI] [PMC free article] [PubMed] [Google Scholar]
- [29].Zhang S, Winter P, Wu K, Sherry AD. A Novel Europium(III)-Based MRI Contrast Agent. J. Am. Chem. Soc. 2001;123:1517–1518. doi: 10.1021/ja005820q. [DOI] [PubMed] [Google Scholar]
- [30].Snoussi K, Bulte JW, Gueron M, van Zijl PCM. Sensitive CEST Agents Based on Nucleic Acid Imino Proton Exchange: Detection of Poly(rU) and a Dendrimer-Poly(rU) Model for Nucleic Acid Delivery and Pharmacology. Magn Reson Med. 2003;49:998–1005. doi: 10.1002/mrm.10463. [DOI] [PubMed] [Google Scholar]
- [31].Goffeney N, Bulte JW, Duyn J, Bryant LHJ, van Zijl PCM. Sensitive NMR detection of cationic-polymer-based gene delivery systems using saturation transfer via proton exchange. J. Amer. Chem. Soc. 2001;123:8628–8629. doi: 10.1021/ja0158455. [DOI] [PubMed] [Google Scholar]
- [32].Chan KWY, McMahon MT, Liu G, Kato Y, Bhujwalla ZM, Artemov D, van Zijl PCM. Imaging of glucose uptake in breast tumors using non-labeled D-glucose; Proceedings of the International Society of Magnetic Resonance in Medicine, 19th Meeting and Excibition; Montreal, Canada. 2011.p. 551. [Google Scholar]
- [33].Walker-Samuel S, Johnson P, Pedley B, Lythgoe MF, Golay X. Assessment of tumor glucose intake using glucoCEST; 19th Annual Meeting of ISMRM; Montreal, Canada. 2011.p. 962. [Google Scholar]
- [34].Longo DL, Dastru W, Digilio G, Keupp J, Langereis S, Lanzardo S, Prestigio S, Steinbach O, Terreno E, Uggeri F, Aime S. Iopamidol as Responsive MRI-Chemical Exchange Saturation Transfer Contrast Agent for pH Mapping of Kidneys: In Vivo Studies in Mice at 7T, Magn. Reson. Med. 2011;65:202–211. doi: 10.1002/mrm.22608. [DOI] [PubMed] [Google Scholar]
- [35].Zhang S, Winter P, Wu K, Sherry AD. A novel Europium(III)-based MRI contrast agent. J. Amer. Chem. Soc. 2001;123:1517–1518. doi: 10.1021/ja005820q. [DOI] [PubMed] [Google Scholar]
- [36].Zhang S, Wu K, Sherry AD. Unusually sharp dependence of water exchange rate versus Lanthanide ionic radii for a series of tetraamide complexes. J. Amer. Chem. Soc. 2002;124:4226–4227. doi: 10.1021/ja017133k. [DOI] [PubMed] [Google Scholar]
- [37].Zhang S, Sherry AD. Physical characteristics of lanthanide complexes that act as magnetization transfer (MT) contrast agents. J. Solid State Chem. 2003;171:38–43. [Google Scholar]
- [38].Aime S, Barge A, Batsanov A, Botta M, Castelli DD, Fedeli F, Mortillaro A, Parker D, Puschmann H. Controlling the Variation of Axial Water Exchange Rates in Macrocylic Lanthanode (III) Complexes. Chem Commun. 2002;10:1120–1121. doi: 10.1039/b202862j. [DOI] [PubMed] [Google Scholar]
- [39].Zhang S, Malloy C, Sherry AD. MRI Thermometry Based on PARACEST Agents. J. Amer. Chem. Soc. 2005;127:17572–17573. doi: 10.1021/ja053799t. [DOI] [PMC free article] [PubMed] [Google Scholar]
- [40].Yoo B, Pagel MD. A PARACEST MRI Contrast Agent To Detect Enzyme Activity. J. Amer. Chem. Soc. 2006;128:14032–14033. doi: 10.1021/ja063874f. [DOI] [PubMed] [Google Scholar]
- [41].Yoo B, Raam MS, Rosenblum RM, Pagel MD. Enzyme-Responsive PARACEST MRI Contrast Agents: a New Biomedical Imaging Approach for Studies of the Proteasome. Contrast Media Mol I. 2007;2:189–198. doi: 10.1002/cmmi.145. [DOI] [PubMed] [Google Scholar]
- [42].Aime S, Carrera C, Delli Castelli D, Geninatti Crich S, Terreno E. Tunable Imaging of Cells Labeled with MRI-PARACEST Agents. Angew Chem Int Edit. 2005;44:1813–1815. doi: 10.1002/anie.200462566. [DOI] [PubMed] [Google Scholar]
- [43].Castelli DD, Gianolio E, Geninatti Crich S, Terreno E, Aime S. Metal Containing Nanosized Systems for MR-Molecular Imaging Applications. Coord. Chem. Rev. 2008;252 [Google Scholar]
- [44].Aime S, Castelli DD, Terreno E. Supramolecular Adducts Between Poly-L-Argininge and [Tm(III) DOTP]: A Route to Sensitivity-Enhanced Magnetic Resonance Imaging - Chemical Exchange Saturation Transfer Agents. Angew Chem Int Edit. 2003;42:4527–4529. doi: 10.1002/anie.200352132. [DOI] [PubMed] [Google Scholar]
- [45].Zhao JM, Harel Y, McMahon MT, Zhou J, Sherry AD, Sgouros G, Bulte JWM, van Zijl PCM. Size-Induced Enhancement of Chemical Exchange Satiration Transfer (CEST) Contrast in Liposomes. J. Am. Ceram. Soc. 2008;130:5178–5184. doi: 10.1021/ja710159q. [DOI] [PMC free article] [PubMed] [Google Scholar]
- [46].Aime S, Castelli DD, Terreno E. Highly sensitive MRI chemical exchange saturation agents using liposomes. Angew Chem Int Edit. 2005;44:5513–5515. doi: 10.1002/anie.200501473. [DOI] [PubMed] [Google Scholar]
- [47].Terreno E, Cabella C, Carrera C, Castelli DD, Mazzon R, Rollet S, Stancanello J, Visigalli M, Aime S. From Spherical to Osmotically Shrunken Paramagnetic Liposomes: An Improved Generation of LIPOCEST MRI Agents with Highly Shifted Water Protons. Angew Chem Int Edit. 2007;46:966–968. doi: 10.1002/anie.200604027. [DOI] [PubMed] [Google Scholar]
- [48].Schroeder L, Lowery TJ, Hilty C, Wemmer DE, Pines A. Molecular Imaging Using a Targeted Magnetic Resonance Hyperpolarized Biosensor Science. 2006;314:446–449. doi: 10.1126/science.1131847. [DOI] [PubMed] [Google Scholar]
- [49].Sun PZ, Farrar CT, Sorensen AG. Correction for Artifacts Induced by B0 and B1 Field Inhomogeneities in pH-Sensitive Chemical Exchange Saturation Transfer (CEST) Imaging. Magn Reson Med. 2007;58:1207–1215. doi: 10.1002/mrm.21398. [DOI] [PubMed] [Google Scholar]
- [50].Stancanello J, Terreno E, Castelli DD, Cabella C, Uggeri F, Aime S. Development and Validation of a Smoothing-Splines-Based Correction Method for Improving the Analysis of CEST-MR Images. Contrast Media Mol I. 2008;3:136–149. doi: 10.1002/cmmi.240. [DOI] [PubMed] [Google Scholar]
- [51].Kim M, Gillen J, Lamndman B, Zhou JY, van Zijl PCM. Water suppression shift referencing (WASSR) for chmical exchange saturation transfer (CEST) experiments. Magn. Reson. Med. 2009;61:1441–1450. doi: 10.1002/mrm.21873. [DOI] [PMC free article] [PubMed] [Google Scholar]
- [52].Overhauser AW. Polarization of Nuclei in Metals. Phys. Rev. 1953;92:411 LP–415. [Google Scholar]
- [53].Solomon I. Relaxation Processes in a System of Two Spins. Phys. Rev. 1955;99:559–565. [Google Scholar]
- [54].Forsen S, Hoffman RA. Study of Moderaltely Rapid Chemical Exchange Reactions by Means of Nuclear Manetic Double Resonance. J. Chem. Phys. 1963;39:2892–2901. [Google Scholar]
- [55].Hoffman RA, Forsen S. Transient and Steady-State Overhauser Experiments in the Investigation of Relaxation Process. Analogies between Chemical Exchange and Relaxation. J. Chem. Phys. 1966;45:2049–2060. [Google Scholar]
- [56].McConnell HM. Reaction rates by nuclear magnetic resonance. J. Chem. Phys. 1961;35:41–48. [Google Scholar]
- [57].Ernst RR, Bodenhausen G, Wokaun A. Principles of Nuclear Magnetic Resonance in One and Two Dimensions. In: Rowlinson JS, editor. The International Series of Monographs in Chemistry. Clarendon Press; Oxford: 1994. [Google Scholar]
- [58].Desvaux H, Berthault P. Study of dynamic processes in liquids using off-resonance rf irradiation. Prog. Nucl. Magn. Reson. Spectrosc. 1999;35:295–340. [Google Scholar]
- [59].Boulat B, Bodenhausen G. Cross Relaxation in Magnetic Resonance: An Extension of the Solomon Equations for a Consistent Description of Saturation. J. Chem. Phys. 1992;97:6040–6043. [Google Scholar]
- [60].Sun PZ, Benner T, Kumar A, Sorensen AG. Investigation of Optimizing and Translating pH-Sensitive Pulsed-Chemical Exchange Saturation Transfer (CEST) Imaging to a 3T Clinical Scanner. Magn. Reson. Med. 2008;60:834–841. doi: 10.1002/mrm.21714. [DOI] [PMC free article] [PubMed] [Google Scholar]
- [61].Dixon TW, Hancu I, Rathnakar JS, Sherry AD, Lenkinski RE, Alsop DC. A Multislice Gradient Echo Pulse Sequence for CEST imaging. Magn. Reson. Med. 2010;63:253–256. doi: 10.1002/mrm.22193. [DOI] [PMC free article] [PubMed] [Google Scholar]
- [62].Zhou J, Wilson DA, Sun PZ, Klaus JA, van Zijl PCM. Quantitative description of proton exchange process between water and endogenenous and exogenenous agents for WEX, CEST, and APT experiments. Magn Reson Med. 2004;51:945–952. doi: 10.1002/mrm.20048. [DOI] [PubMed] [Google Scholar]
- [63].McMahon MT, Gilad AA, Zhou J, Sun PZ, Bulte JWM, Van Zijl PCM. Quantifying Exchange Rates in Chemical Exchange Saturation Transfer Agents Using Saturation Time and Saturation Power Dependensies of the Magnetization Transfer Effect on the Magnetic Resonance Imaging Signal (QUEST and QUESP): pH Calibration for Poly-L-Lysine and a Starburst Dendrimer. Magn Reson Med. 2006;55:836–847. doi: 10.1002/mrm.20818. [DOI] [PMC free article] [PubMed] [Google Scholar]
- [64].Trott O, Palmer AGI. R1rho Relaxation Outside the Fast-Exchange Limit. J. Magn. Reson. 2002;154:157–160. doi: 10.1006/jmre.2001.2466. [DOI] [PubMed] [Google Scholar]
- [65].Jin T, Autio J, Obata T, Kim S-G. Spin-Locking Versus Chemical Exchange Saturation Transfer MRI for Investigating Chemical Exchange Process Between Water and Labile Metabolite Proteins. Magn. Reson. Med. 2010 doi: 10.1002/mrm.22721. DOI: 10.1002/mrm.22721. [DOI] [PMC free article] [PubMed] [Google Scholar]
- [66].Vinogradov E, Soesbe TC, Balschi JA, Sherry AD, Lenkinski RE. pCEST: Positive Contrast Using Chemical Exchange Saturation Transfer. J. Magn. Reson. 2012;215:64–73. doi: 10.1016/j.jmr.2011.12.011. [DOI] [PMC free article] [PubMed] [Google Scholar]
- [67].Kogan F, Singh A, Cai K, Haris M, Hariharan H, Reddy R. Investigation of Chemical Exchange at Intermediate Exchange Rates Using a Combination of Exchange Saturation Transfer (CEST) and Spin-Locking Methods (CESTrho) Magn. Reson. Med. 2012;68:107–119. doi: 10.1002/mrm.23213. [DOI] [PMC free article] [PubMed] [Google Scholar]
- [68].van Zijl PCM, Zhou J, Mori N, Payen J-F, Mori S. Mechanism of magnetization transfer during on-resonance water saturation: a new approach to detect mobile proteins, peptides, and lipids. Magn. Reson. Med. 2003;49:440–449. doi: 10.1002/mrm.10398. [DOI] [PubMed] [Google Scholar]
- [69].Henkelman RM, Huang X, Xiang Q-S, Stanisz GJ, Swanson SD, Bronskill MJ. Quantitative Interpretation of Magnetization Transfer. Magn. Reson. Med. 1993;29:759–766. doi: 10.1002/mrm.1910290607. [DOI] [PubMed] [Google Scholar]
- [70].Hua J, Jones CK, Blakeley J, Smith SA, van Zijl PCM, Zhou J. Quantitative description of the assymetry in magnetization transfer effects around the water resonance in the human brain. Magn Reson Med. 2007;58:786–793. doi: 10.1002/mrm.21387. [DOI] [PMC free article] [PubMed] [Google Scholar]
- [71].Ng M-C, Hua J, Hu Y, Luk K, Lam E. Magnetization Transfer (MT) Assymetry Around Water Resonance in Human Cervical Spinal Cord. J. Magn. Reson. 2009;29:523–528. doi: 10.1002/jmri.21610. [DOI] [PMC free article] [PubMed] [Google Scholar]
- [72].Soesbe TC, Rojas-Quijano FA, Sherry AD. In vivo MRI beyond the MT window using SWIFT-CEST and a Terbium-based PARACEST contrast agent; Proceedings of the International Society of Magnetic Resonance in Medicine, 20th Meeting and Excibition; Melbourne, Australia. 2012.p. 367. [Google Scholar]
- [73].Song X, Gilad AA, Joel S, Liu G, Bar-Shir A, Liang Y, Gorelik M, Pekar J, van Zijl PCM, Bulte JW, McMahon MT. CEST Phase Mapping Using a Length and Offset VARied Saturation (LOVARS) Scheme. Magn. Reson. Med. 2011 doi: 10.1002/mrm.23312. [DOI] [PMC free article] [PubMed] [Google Scholar]
- [74].Liu G, Chan KWY, Song X, Zhang J, Gilad AA, Bulte JW, van Zijl PCM, McMahon MT. Normalized Magnetization Ratio (NOMAR) Filtering for Creation of Tissue Selective Contrast Maps. Magn. Reson. Med. 2012 doi: 10.1002/mrm.24271. DOI: 10.1002/mrm.24271. [DOI] [PMC free article] [PubMed] [Google Scholar]
- [75].Sun PZ, Zhou J, Sun W, Huang J, van Zijl PCM. Suppression of Lipid Artifacts in Amide Proton Transfer Imaging. Magn Reson Med. 2005;54:222–225. doi: 10.1002/mrm.20530. [DOI] [PubMed] [Google Scholar]
- [76].Jin T, Wang P, Zong X, Kim S-G. MR Imaging of the Amide-Proton Transfer Effect and the pH-Insensitive NOE at 9.4T. Magn. Reson. Med. 2012 doi: 10.1002/mrm.24315. [DOI] [PMC free article] [PubMed] [Google Scholar]
- [77].Jones CK, Polders D, Hua J, Zhu H, Hoogduin HJ, Zhou J, Luijten P, van Zijl PCM. In Vivo Three Dimensional Whole-Brain Pulsed Steady-State Chemical Exchange Saturation Transfer at 7T. Magn. Reson. Med. 2012:1579–1589. doi: 10.1002/mrm.23141. [DOI] [PMC free article] [PubMed] [Google Scholar]
- [78].Mori S, Abeygunawardana C, van Zijl PCM. Water exchange filter with improved sensitivity (WEX II) to study solvent-exchangeable protons: application to the consensus zinc finger peptide CP-1. J Magn Reson B. 1996;110:96–101. doi: 10.1006/jmrb.1996.0015. [DOI] [PubMed] [Google Scholar]
- [79].Sun PZ, Zhou J, Huang J, van Zijl PCM. Simplified Quantitative Description of Amide Proton Transfer (APT) Imaging During Acute Ischemia. Magn Reson Med. 2007;57:405–410. doi: 10.1002/mrm.21151. [DOI] [PubMed] [Google Scholar]
- [80].Zhao X, Wen Z, Huang F, Lu S, Wang X, Hu S, Zu D, Zhou J. Saturation Power Dependence of Amide Proton Transfer Image Contrasts in Human Brain Tumors and Strokes at 3T. Magn. Reson. Med. 2011;66:1033–1041. doi: 10.1002/mrm.22891. [DOI] [PMC free article] [PubMed] [Google Scholar]
- [81].Saar G, Zhang B, Ling W, Regatte RR, Navon G, Jerschow A. Assessment of Glycosaminoglycan Concentratioin Changes in the Intervertebral Disc via Chemical Exchange Saturation Transfer. NMR Biomed. 2012;25:255–261. doi: 10.1002/nbm.1741. [DOI] [PMC free article] [PubMed] [Google Scholar]
- [82].Varma G, Lenkinski RE, Vinogradov E. Keyhole Chemical Exchange Saturation Transfer. Magn. Reson. Med. 2012 doi: 10.1002/mrm.23310. DOI: 10.1002/mrm.23310. [DOI] [PMC free article] [PubMed] [Google Scholar]
- [83].Singh A, Haris M, Cai K, Kassey VB, Kogan F, Reddy D, Hariharan H, Reddy R. Chemical Exchange Saturation Transfer Magnetic Resonance Imaging of Human Knee Cartilage at 3T and 7T. Magn. Reson. Med. 2012;68:588–594. doi: 10.1002/mrm.23250. [DOI] [PMC free article] [PubMed] [Google Scholar]
- [84].Kim M, Chan Q, Anthony M-P, Cheung KM, Samartzis D, Khong P-L. Assessment of Glycosaminoglycan Distribution in Human Lumbar Intervertebral Discs Using Chemical Exchange Saturation Transfer at 3T: Feasibility and Initial Experience. NMR Biomed. 2011;24:1137–1144. doi: 10.1002/nbm.1671. [DOI] [PubMed] [Google Scholar]
- [85].Varma G, Kourtelidis F, Mahuranthakam A, Hackney DB, Lenkinski RE, Vinogradov E. Age-related assessment of intervertebral disc degeneration in the lumbar spine using gagCEST; Proceedings of the International Society of Magnetic Resonance in Medicine, 20th Meeting and Excibition; Melbourne, Australia. 2012. [Google Scholar]
- [86].Kim M, Chan Q, Anthony M-P, Samartzis D, Cheung KM, Khong P-L. Chemical Exchange Saturation Transfer and T2 Mapping in Subjects with Intervertebral Disc Degeneration at 3 Tesla; Proceedings of the International Society of Magnetic Resonance in Medicine, 20th Meeting and Excibition; Melbourne, Australia. 2012.p. 0675. [Google Scholar]
- [87].Schmitt B, Zbyn S, Stelzeneder D, Jellus V, Paul D, Lauer L, Bachert P, Trattnig S. Cartilage Quality Assessment by Using Glycosaminoglycan Chemical Exchange Saturuation Transfer and 23Na MR Imaging at 7T. Radiology. 2012;260:257–264. doi: 10.1148/radiol.11101841. [DOI] [PubMed] [Google Scholar]
- [88].Vinogradov E, Zhang S, Lubag A, Balschi JA, Sherry AD, Lenkinski RE. On resonance low B1 pulses for imaging of the effects of PARACEST agents. J. Magn. Reson. 2005;176:54–63. doi: 10.1016/j.jmr.2005.05.016. [DOI] [PubMed] [Google Scholar]
- [89].Vinogradov E, He H, Lubag A, Balschi JA, Sherry AD, Lenkinski RE. MRI Detection of Paramagnetic Chemical Exchange Effects in Mice Kidneys In Vivo. Magn Reson Med. 2007;57:650–655. doi: 10.1002/mrm.21393. [DOI] [PubMed] [Google Scholar]
- [90].Jones CK, Li AX, Suchy M, Hudson RHE, Menon RS, Bartha R. In Vivo Detection of PARACEST Agents With Relaxation Correction. Magn. Reson. Med. 2010;63:1184–1192. doi: 10.1002/mrm.22340. [DOI] [PMC free article] [PubMed] [Google Scholar]
- [91].Li AX, Suchy M, Li C, Gati JS, Meakin S, Hudson RHE, Menon RS, Bartha R. IIn Vivo Detection of MRI-PARACEST Agents in Mouse Brain Tumors at 9.4T. Magn. Reson. Med. 2011;66:67–72. doi: 10.1002/mrm.22772. [DOI] [PubMed] [Google Scholar]
- [92].Friedman JI, McMahon MT, Stivers JT, van Zijl PCM. Indirect Detection of Labile Solute Proton Spectra via the Water Signal Using Frequency-Labeled Exchange (FLEX) Transfer. J. Amer. Chem. Soc. 2010;132:1813–1815. doi: 10.1021/ja909001q. [DOI] [PMC free article] [PubMed] [Google Scholar]
- [93].Lin C-Y, Yadav N, Friedman JI, Ratnakar SJ, Sherry AD, van Zijl PCM. Using Frequency-Labeled Exchange Transfer to Separate Out Conventional Magnetization Transfer Effects from Exchange Transfer Effects When Detecting PARACEST Agents. Magn. Reson. Med. 2012;67:906–911. doi: 10.1002/mrm.24161. [DOI] [PMC free article] [PubMed] [Google Scholar]
- [94].Narvainen J, Hubbard PL, Kauppinen RA, Morris GA. Z-Spectroscopy with Alternating-Phase Irradiation. J Magn Reson. 2010;207:242–250. doi: 10.1016/j.jmr.2010.09.004. [DOI] [PubMed] [Google Scholar]
- [95].Lee J-S, Khitrin AK, Regatte RR, Jerschow A. Unifrom Saturation of a Strongly Coupled Spin System by Two-Frequency Irradiation. J. Chem. Phys. 2011;134:234504. doi: 10.1063/1.3600758. [DOI] [PMC free article] [PubMed] [Google Scholar]
- [96].Lee J-S, Regatte RR, Jerschow A. Separating Chemical Exchange Saturation Transfer Contrast from Magnetization Transfer Asymmetry under Two-Frequency RF Irradiation. J. Magn. Reson. 2012;215:56–63. doi: 10.1016/j.jmr.2011.12.012. [DOI] [PMC free article] [PubMed] [Google Scholar]
- [97].Scheidegger R, Vinogradov E, Alsop D. Amide proton transfer imaging with improved robustness to magnetic field inhomogeneity and magnetization transfer assymetry using Saturation with Frequency ALternating RF Irradiation (SAFARI) Magn. Reson. Med. 2011;66:1275–1285. doi: 10.1002/mrm.22912. [DOI] [PMC free article] [PubMed] [Google Scholar]
- [98].Scheidegger R, Vinogradov E, Dai W, Alsop DC. Amide Proton Transfer Imaging With Continous Wave Dual Frequency Saturation can Detect the Amide Proton Peak in the Z-spectrum Acquired at 3T; Proceedings of the International Society of Magnetic Resonance in Medicine, 19th Meeting and Excibition; Montreol, Canada. 2011. [Google Scholar]
- [99].Ling W, Eliav U, Navon G, Jerschow A. Chemical Exchange Saturation Transfer by Intermolecular Double-Quantum Coherence. J Magn Reson. 2008;194:29–32. doi: 10.1016/j.jmr.2008.05.026. [DOI] [PMC free article] [PubMed] [Google Scholar]
- [100].Vinogradov E, Grant AK, Robson PM, Hancu I, Dixon TW, Sherry AD, Lenkinski RE. Application of Parallel Imaging to Reduce SAR in CEST experiments; Proceedings of the International Society of Magnetic Resonance in Medicine, 17th Meeting and Excibition; Honolulu, Hawai, USA. 2009. [Google Scholar]
- [101].Schmitt B, Zaiss M, Zhou J, Bachert P. Optimization of Pulse Train Presaturation for CEST Imaging in Clinical Scanners. Magn. Reson. Med. 2010 doi: 10.1002/mrm.22750. [DOI] [PubMed] [Google Scholar]
- [102].Shah T, Lu L, Dell KM, Pagel MD, Griswold MA, Flask CA. CEST-FISP: A Novel Technique for Rapid Chemical Exchange Saturation Transfer MRI at 7T. Magn. Reson. Med. 2011;65:432–437. doi: 10.1002/mrm.22637. [DOI] [PMC free article] [PubMed] [Google Scholar]
- [103].Keupp J, Baltes C, Harvey PR, van den Brink J. Parallel RF Transmission Based MRI Techniue for Highly Sensitive Detection og Amide Proton Transfer in the Human Brain; Proceedings of the International Society of Magnetic Resonance in Medicine, 19th Meeting and Excibition; Montreol, Canada. 2011.p. 710. [Google Scholar]
- [104].Zhou J, Blakeley JO, Hua J, Kim M, Laterra J, Pomper MG, Zijl PC. Practical Data Acquisition Method for Human Brain Tumor Amide Proton Transfer (APT) imaging. Magn. Reson. Med. 2008;60:842–849. doi: 10.1002/mrm.21712. [DOI] [PMC free article] [PubMed] [Google Scholar]
- [105].Dula A, Asche EM, Landman B, Welch EB, Pawate S, Sriram S, Gore JC, Smith SA. Development of Chemical Exchange Saturation Transfer at 7T. Magn. Reson. Med. 2011;66:831–838. doi: 10.1002/mrm.22862. [DOI] [PMC free article] [PubMed] [Google Scholar]
- [106].Gerigk L, Schmitt B, Steltjes B, Roder F, Essig M, Bock M, Schlemmer H-P, Rothke M. 7T Imaging of Cerebral Radiation Necrosis After Arteriovenous Malformations Treatment Using Amide Proton Transfer (APT) Imaging. J Magn Reson Im. 2012;35:1207–1209. doi: 10.1002/jmri.23534. [DOI] [PubMed] [Google Scholar]
- [107].Desmond KL, Stanisz GJ. Understanding Quantitative Pulsed CEST in the Presence of MT. Magn. Reson. Med. 2011;67:979–990. doi: 10.1002/mrm.23074. [DOI] [PubMed] [Google Scholar]
- [108].Li AX, Hudson RHE, Barrett JW, Jones CK, Pasternak SH, Bartha R. Four-pool modeling of proton exchange processes in biological systems in the presence of MRI-paramagnetic chemical exchange saturation transfer (PARACEST) agents. Magn Reson Med. 2008;60:1197–1206. doi: 10.1002/mrm.21752. [DOI] [PubMed] [Google Scholar]
- [109].Terreno E, Castelli DD, Cravotto G, Milone L, Aime S. Ln(III)-DOTAMGly Complexes: A Versatile Series to Assess the Determinants of the Efficacy of Paramagnetic Chemical Exchange Saturation Transfer Agents for Magnetic Resonance Imaging Applications. Invest Radiol. 2004;39:235–239. doi: 10.1097/01.rli.0000116607.26372.d0. [DOI] [PubMed] [Google Scholar]
- [110].Sun PZ. Simplified Quantification of Labile Proton Concentration-Weighted Chemical Exchange Rate (kws) with RF Saturation Time Dependent Ratiometric Analysis (QUESTRA): Normalization of Relaxation and RF Irradiation Spillover Effects for Improved Quantitative Chemical Exchange Saturation Transfer (CEST) MRI. Magn. Reson. Med. 2012;67:936–942. doi: 10.1002/mrm.23068. [DOI] [PMC free article] [PubMed] [Google Scholar]
- [111].Dixon TW, Ren J, Lubag AJM, Rathnakar J, Vinogradov E, Hancu I, Lenkinski RE, Sherry AD. A Concentration-Independent Method to Measure Exchange Rates in PARACEST Agents. Magn. Reson. Med. 2010;63:625–632. doi: 10.1002/mrm.22242. [DOI] [PMC free article] [PubMed] [Google Scholar]
- [112].Guivel-Scharen V, Sinnwell T, Wolff SD, Balaban RS. Detection of Proton Chemical Exchange between Metabolites and Water in Biological Tissues. J. Magn. Reson. 1998;133:36–45. doi: 10.1006/jmre.1998.1440. [DOI] [PubMed] [Google Scholar]
- [113].Zhu H, Jones CK, van Zijl PC, Barker GJ, Zhou J. Fast 3D Chemical Exchange Saturation transfer (CEST) Imaging of the Human Brain. Magn. Reson. Med. 2010;64:638–644. doi: 10.1002/mrm.22546. [DOI] [PMC free article] [PubMed] [Google Scholar]